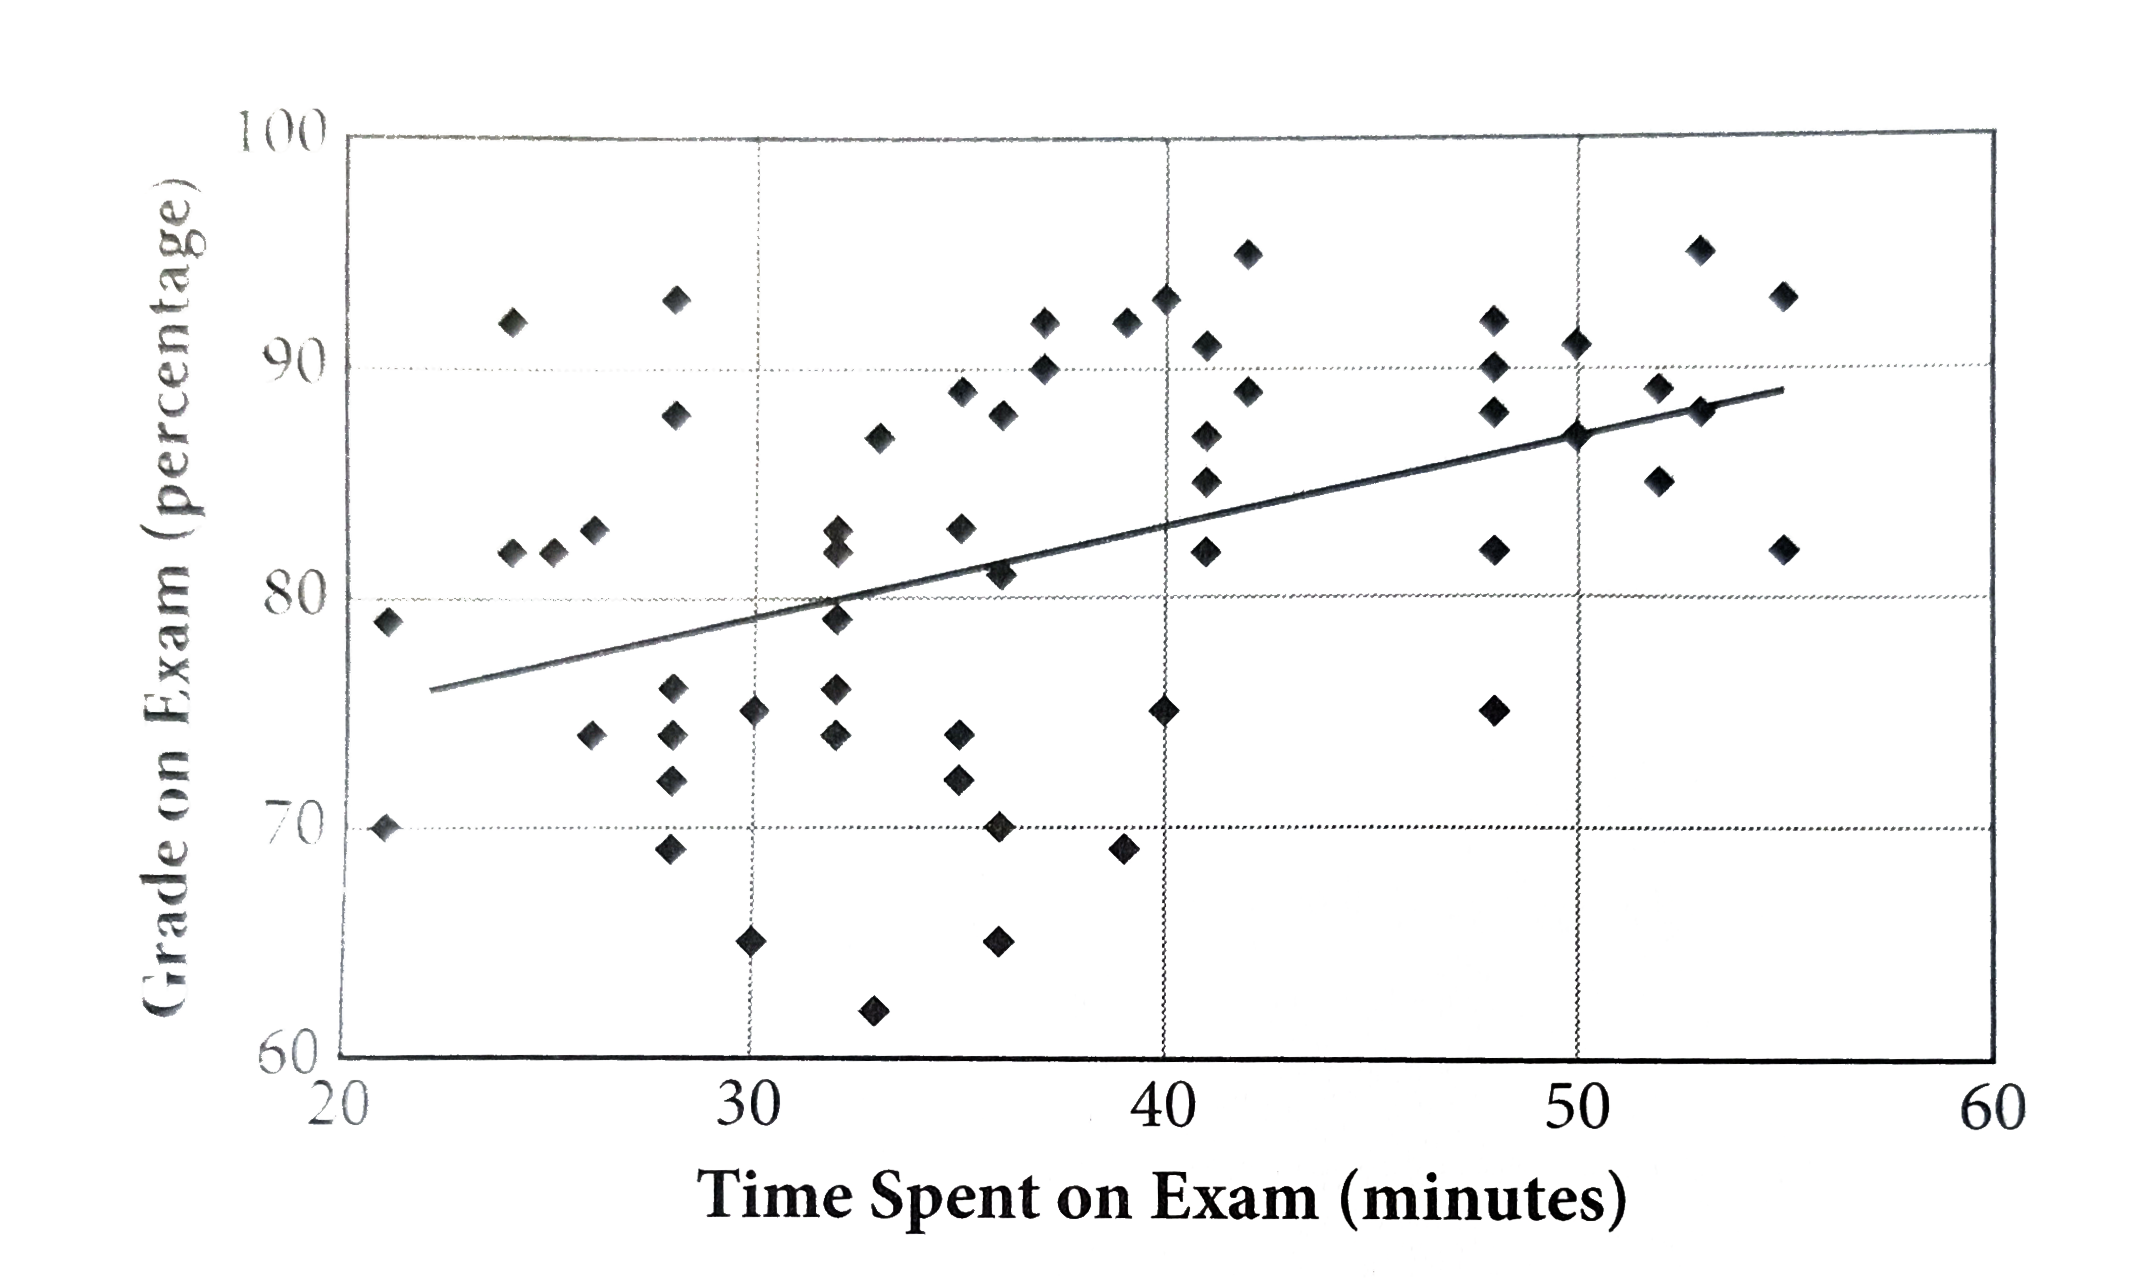
A physicas professor presented the scatterplot above to her first-year students. What is the significance of the slope of the line of best fit ?
The slope represents the rate at which time spent on an exam increases based on a student's exam performance.
The slope represents the average grade on the exam.
The slope represents the rate at which a student's exam grade increases based on time spent on the exam.
The slope has no significance.
The correct Answer is:C
The slope of a line is always a rate of change of some sort, so you can eliminate (B) and (D). The graph indicates thet time spent on the exam is the independent variable, so exam performance depends on it. The choice that correctly describes this relationship is (C ).
Topper's Solved these Questions
- BOOK - KAPLANCHAPTER - SCATTERPLOTSEXERCISE - LINE OF BEST FIT1videos
SCATTERPLOTS
- BOOK - KAPLANCHAPTER - SCATTERPLOTSEXERCISE - SCATTERPLOT MODELING1videos
SCATTERPLOTS
- BOOK - KAPLANCHAPTER - SCATTERPLOTSEXERCISE - SCATTERPLOT MODELING1videos
SCATTERPLOTS
- BOOK - KAPLANCHAPTER - SAT MATH: TIMING ANS SECTION MANAGEMENT STRATEGIESEXERCISE - TRY ON YOU OWN5videos
SAT MATH: TIMING ANS SECTION MANAGEMENT STRATEGIES
- BOOK - KAPLANCHAPTER - SYSTEMS OF LINEAR EQUATIONSEXERCISE - NUMBER OF POSSIBLE SOLUTIONS1videos
SYSTEMS OF LINEAR EQUATIONS
Similar Questions
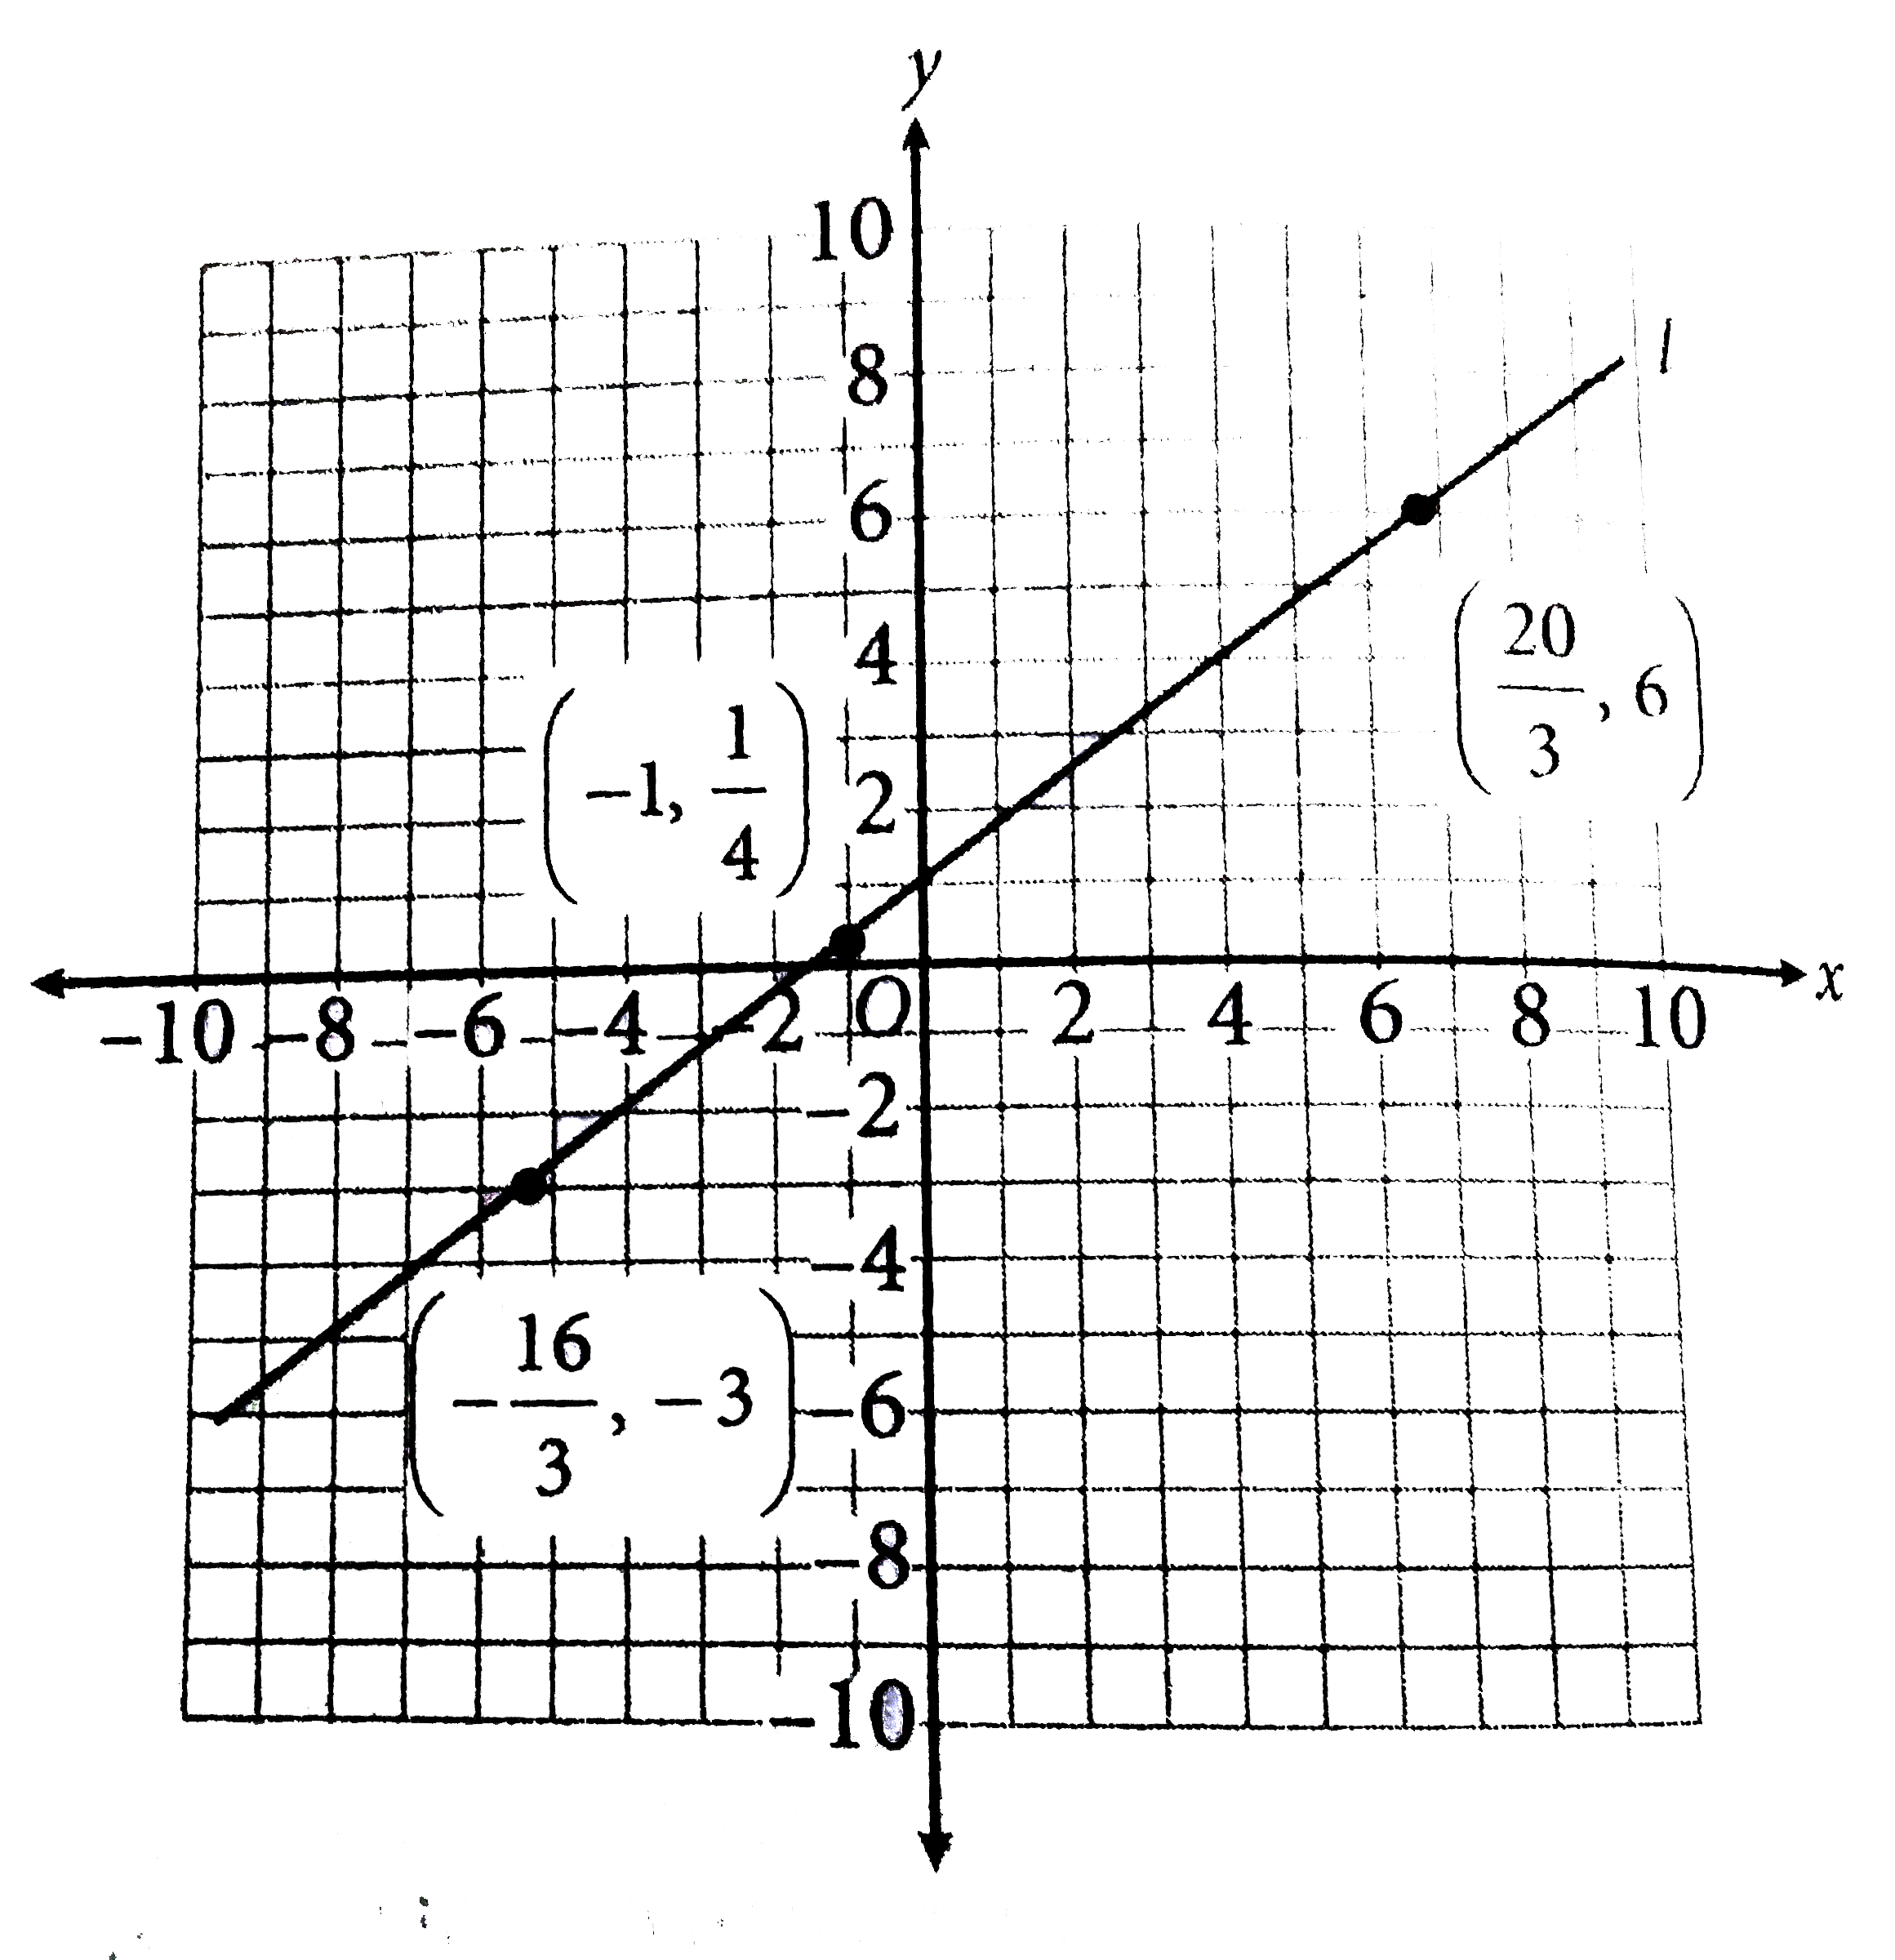
What is the slope of line l shown in the xy-plane above?View SolutionA biologist places a colony consisting of 5000 bacteria into a petri dish. After the intial placement of the bacteria at time t = 0, the biologist measures and estimates the number of bacteria present every half hour. This data was then fitted by an exponential curve of the form y=c.2kt where c and k are constants, t is measured in hours, and y is measured in thousands of bacteria. The scatterplot together with the exponential curve are shown below.
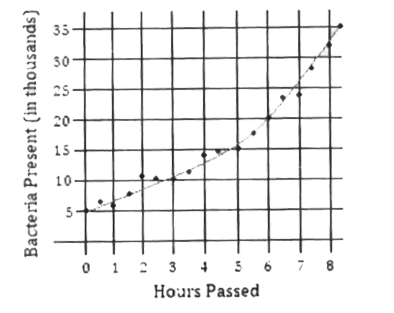
Suppose that the data was fitted with a quadratic function of the form t2+bt+c instead of an exponential function. Assume that the quadratic funtion agrees with the scatterplot at times t = 0 and t = 6. What is the t - coordinate of the vertex of the graph of the quadratic function?View Solution
Knowledge Check
- Question 1 - Select One
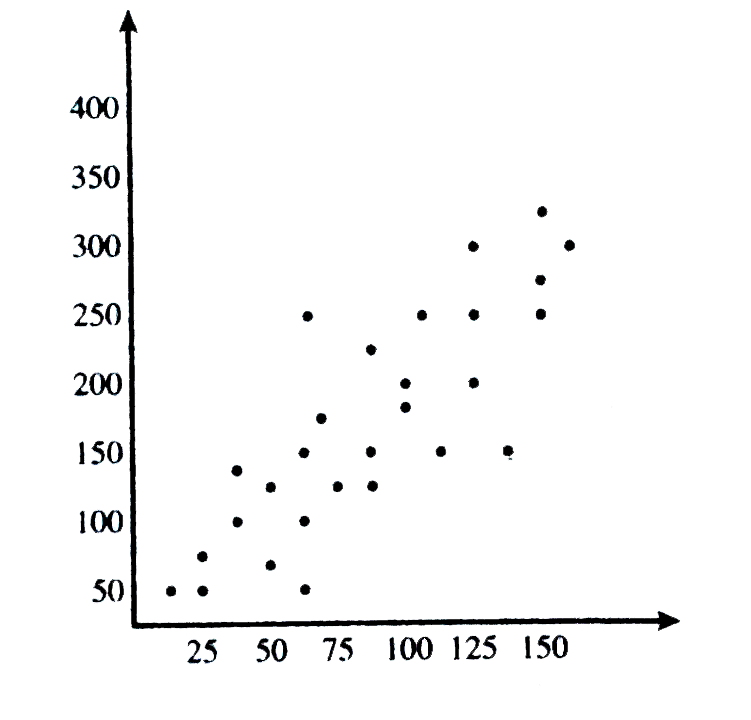
For the scatterplot above , which is closest to the slope of the line of best fit ?A12B1C2D3 - Question 2 - Select One
Ten 25- year - old men were asked how many hours per week they exercise and their resting heart rate was taken in beats per minute (BPM). The results are shown as points in the scatterplot below, and the line of best fit is drawn.
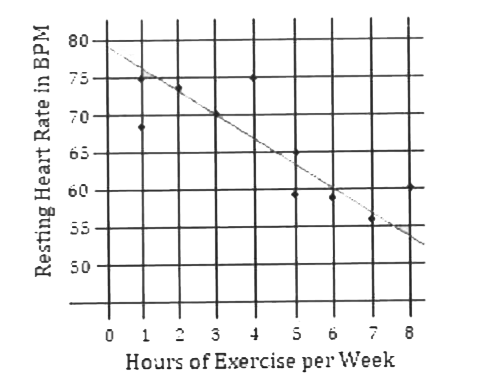
Which of the following is the best interpretation of the slope of the line of best fit in the context of this problem?AThe predicted number of hours that a person must exercise to maintain a resting heat rate of 50 BPM.BThe predicted resting heat rate of a person that does not exercise.CThe predicted decrease in resting heart rate, in BPM, for each one - hour increase in weekly exercise.DThe predicted increase in the number of hours of exercise needed to increase the resting heart rate by one BPM. - Question 3 - Select One
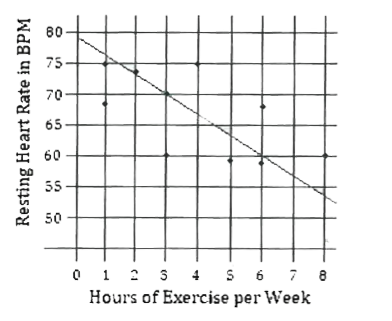
Ten 25 - years - old men were asked how many hours per week they exercise and their resting heart rate was taken in beats per minute (BPM). The results are shown as points in the scatterplot above, and the line of best fit is drawn. What is the resting heart rate, in BPM, of the men represented by the data point that is farthest from the line of best fit?A60B66C67D75
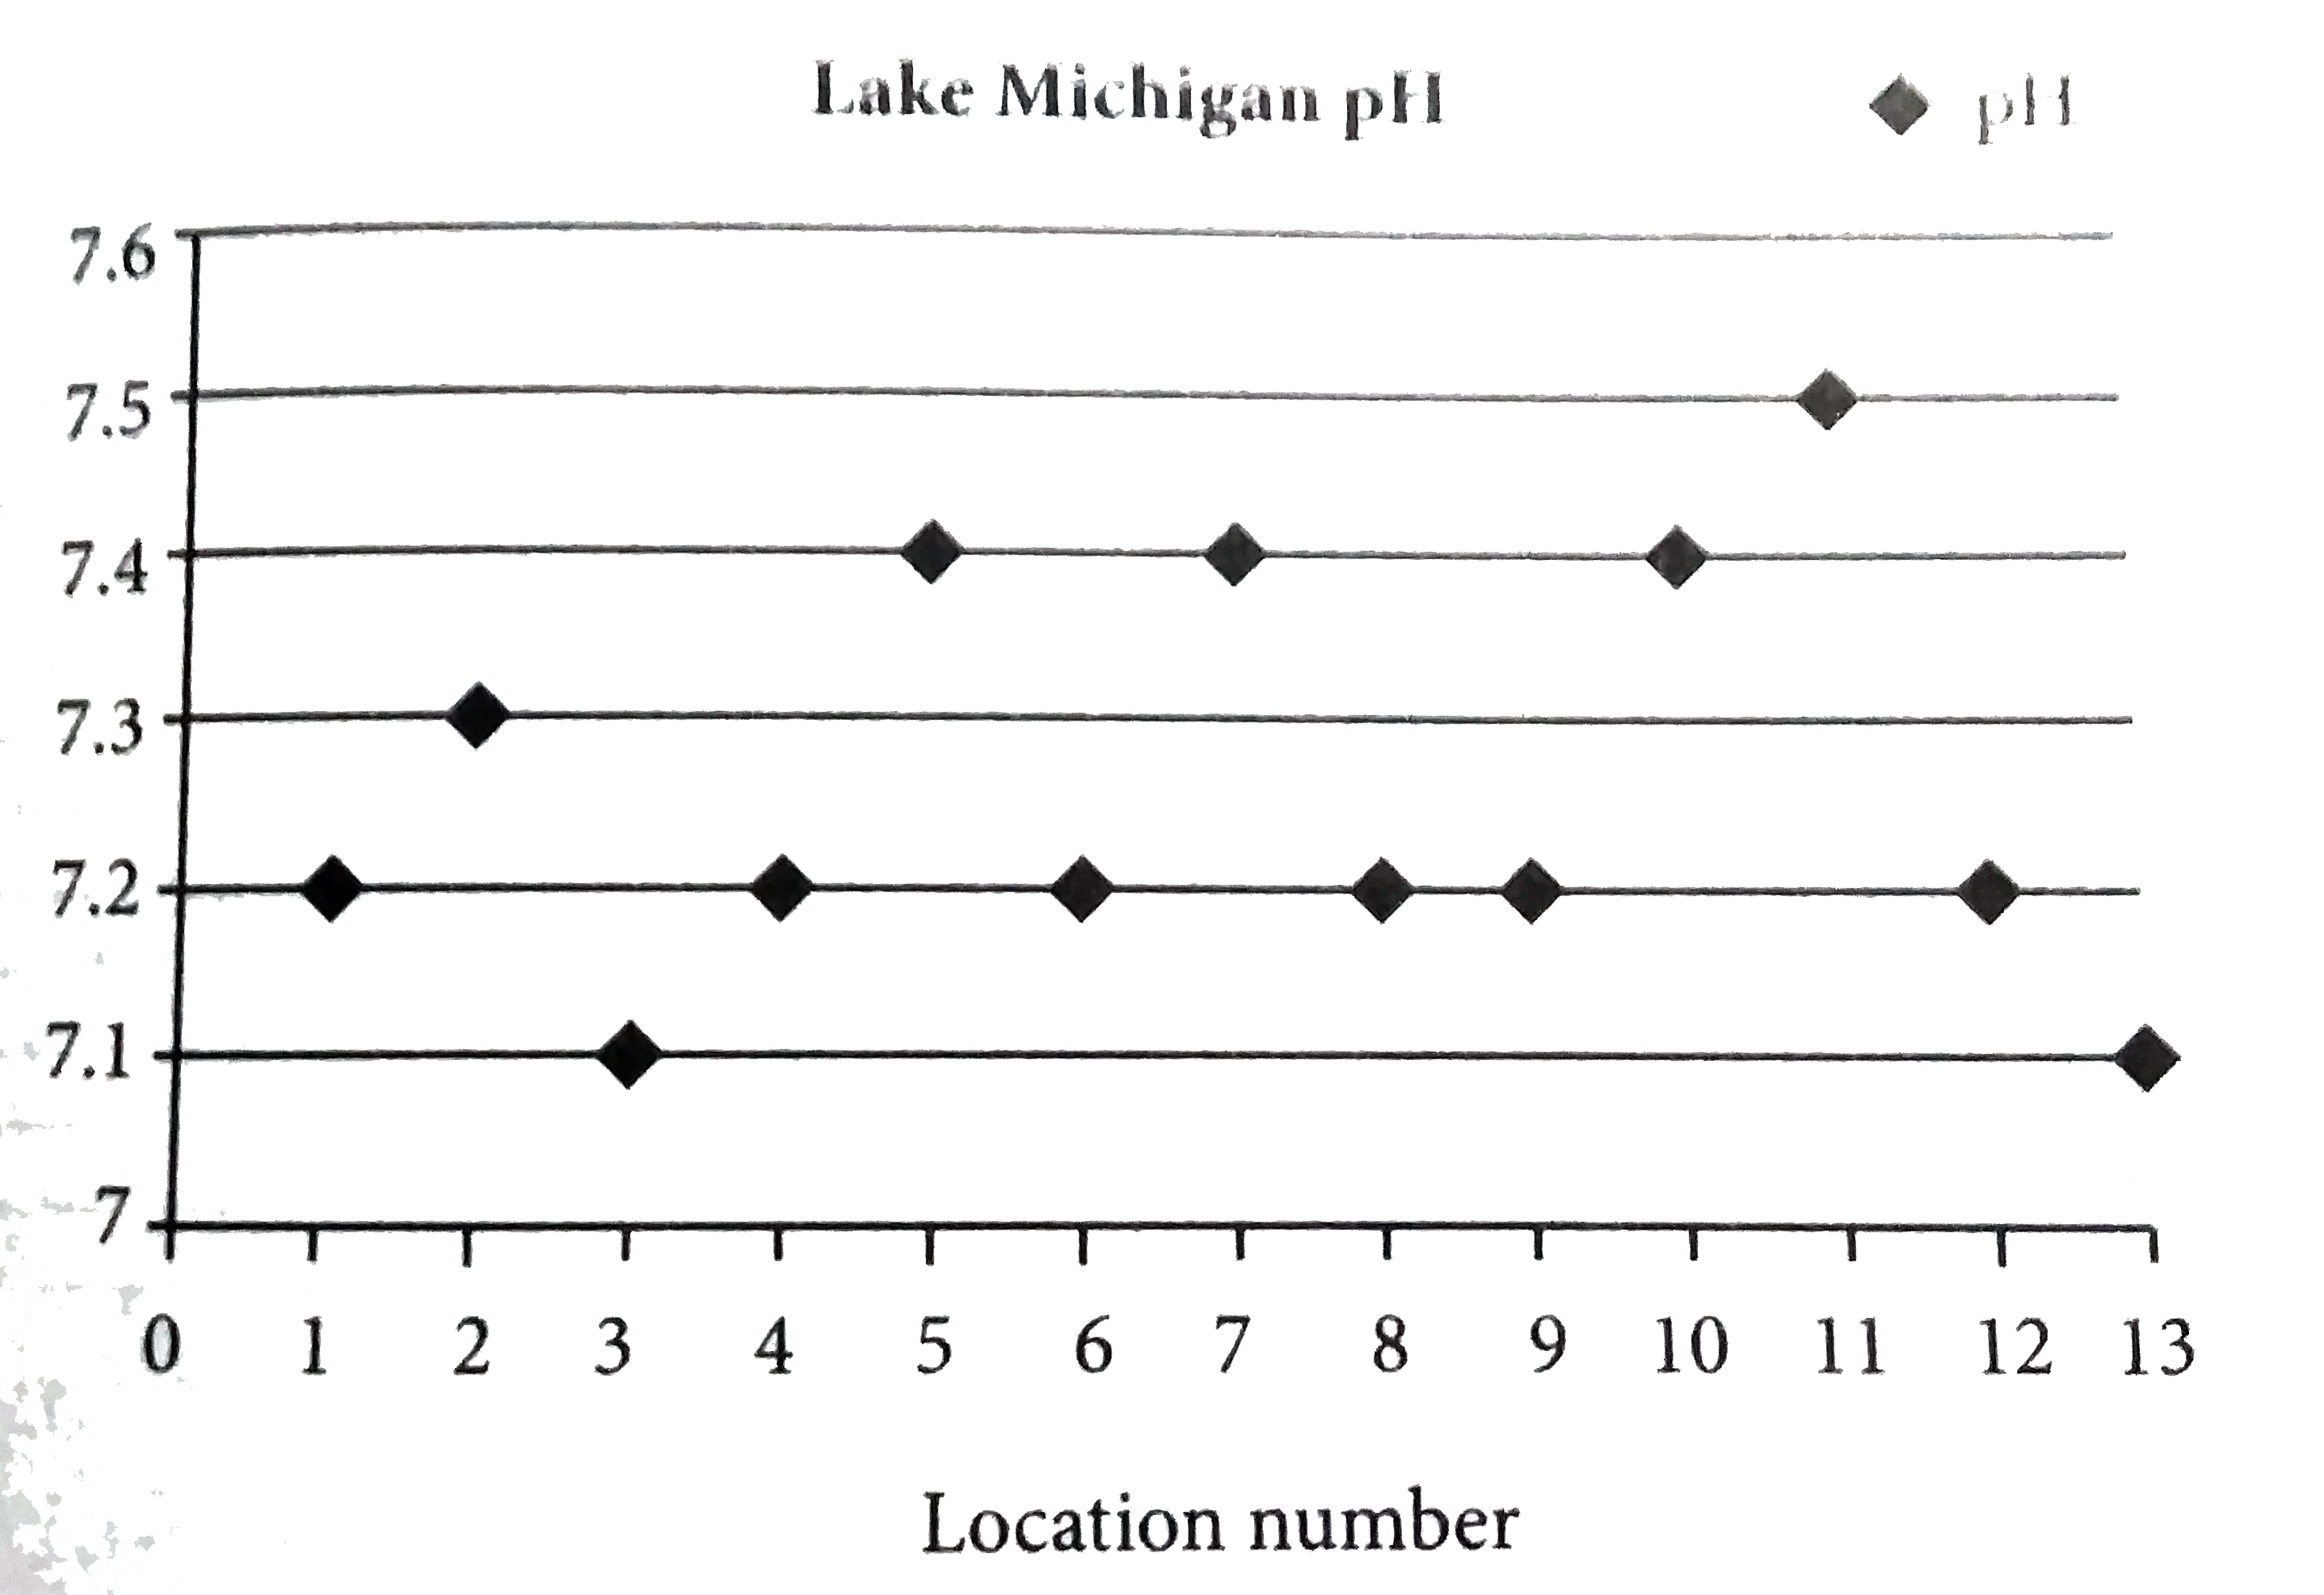
The pH of the water in Lake Michigan was tested at 13 locations along the illions shoreline. The data is presented in the scatterplot above. Which of the following best represents the mode of the pH in the collected data?View Solution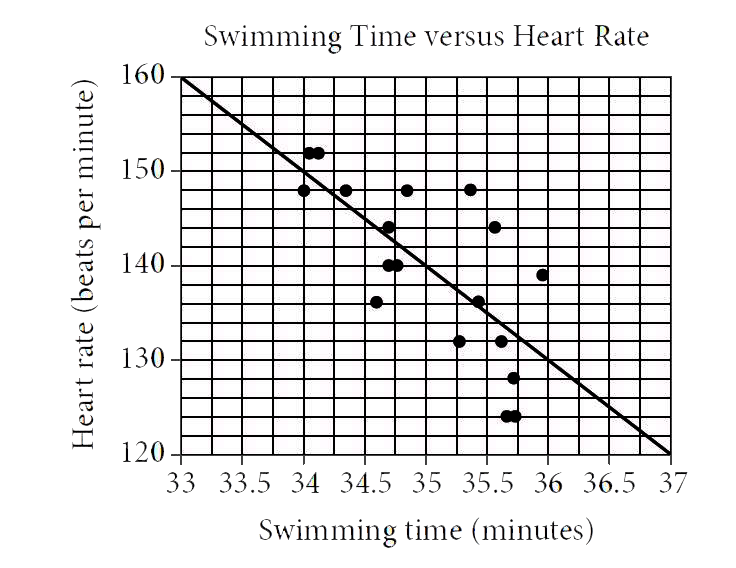
Michael swam 2,000 yards on each of eighteen days. The scatterplot above shows his swim time for and corresponding heart rate after each swim. The line of best fit for the data is also shown. For the swim that took 34 minutes, Michael’s actual heart rate was about how many beats per minute less than the rate predicted by the line of best fit?View Solution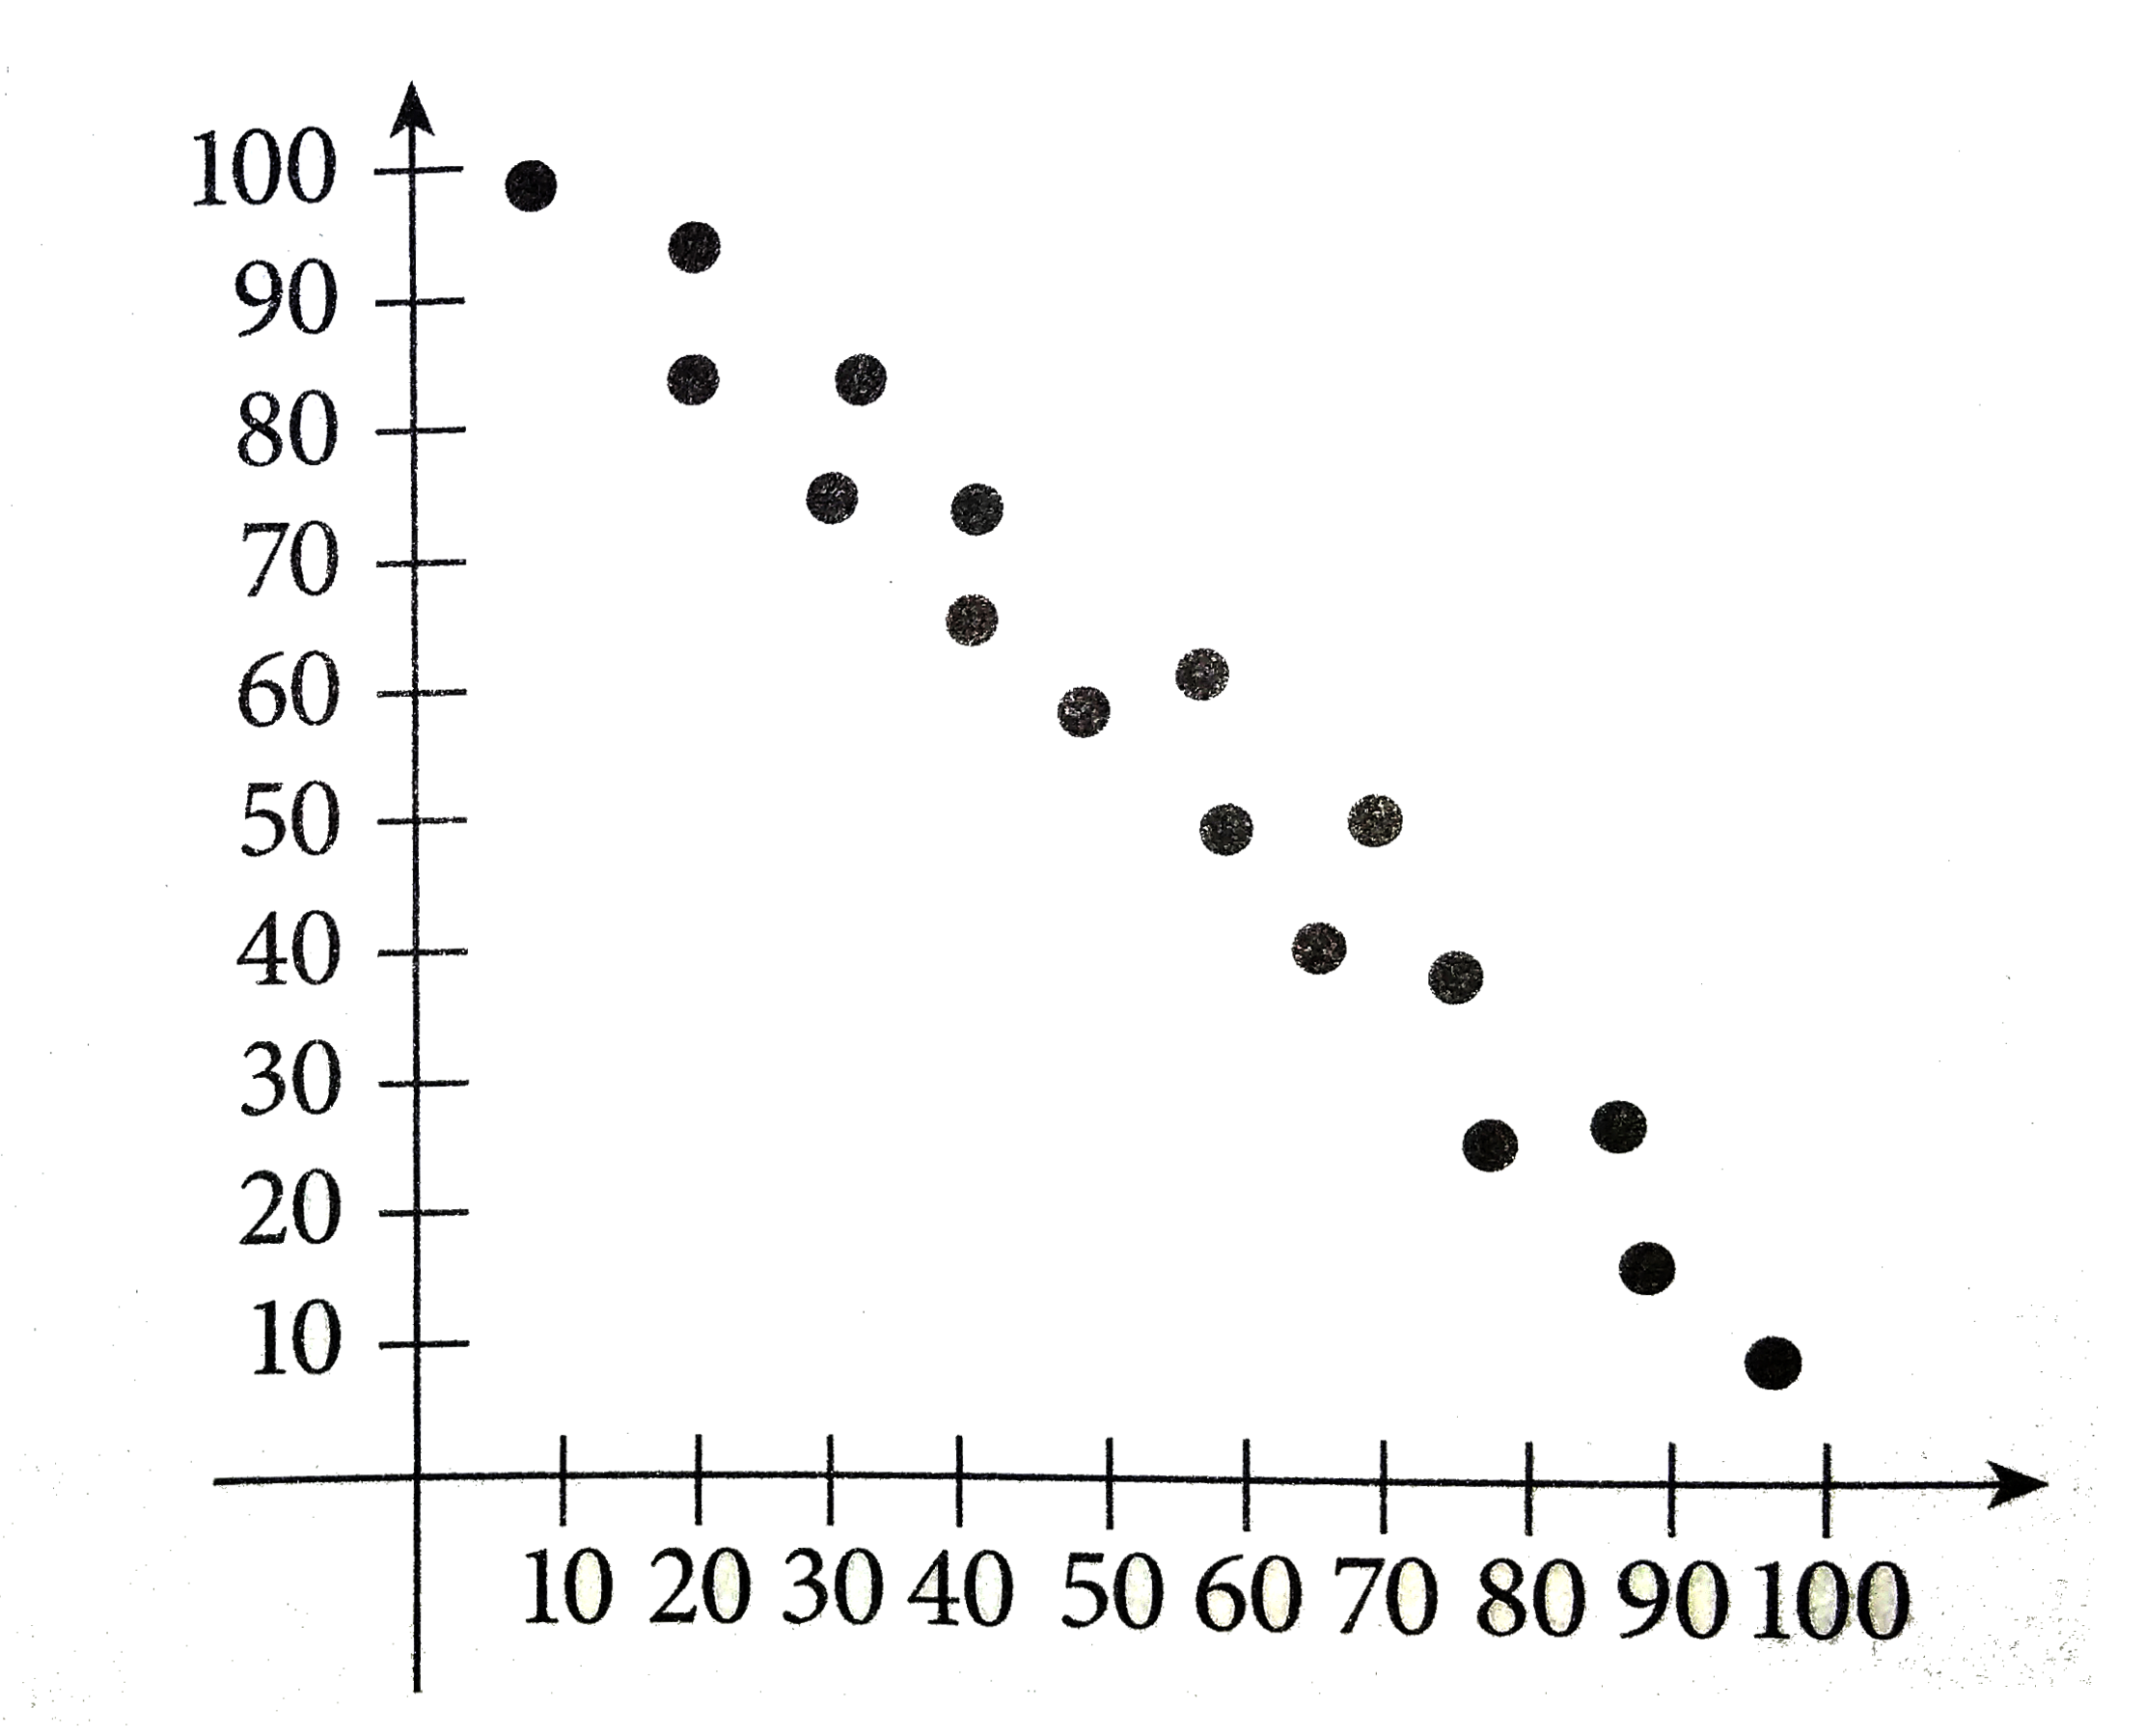
Which of the following is most likely the slope of the line of best fit for the scatterplot above?View Solutionwhat is the greatest difference between the actual value of the stock and the value of the stock predicted by the line of best fit?
View SolutionIn the 1990s, the park rangers at Yellowstone National park implemented a program aimed at increasing the dwindling coyote population in Montana. Results of studies of the coyote population in the park are shown in the scatterplot below.

Based on the line of best fit in the scatterplot above, which of the following is the closest to the average annual increase in coyotes in Yellowstone Park between 1995 and 2000?View Solution

