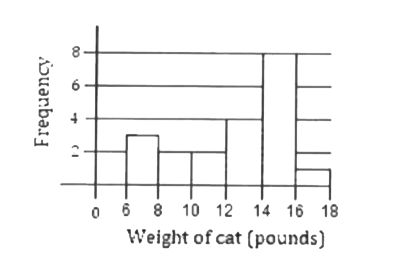
The histogram above shows the distribution of the weights, in pounds, of 18 cats in a shelter. Which of the following could be the median weight of the 18 cats represents in the histogram?
10 pounds
11 pounds
13.5 pounds
16 pounds
The correct Answer is:C
Step by step video, text & image solution for The histogram above shows the distribution of the weights, in pounds, of 18 cats in a shelter. Which of the following could be the median weight of the 18 cats represents in the histogram? by Maths experts to help you in doubts & scoring excellent marks in Class 12 exams.
Similar Questions
Which of the following represents order of cat ?
View SolutionAges of 20 Students Enrolled in a College Class
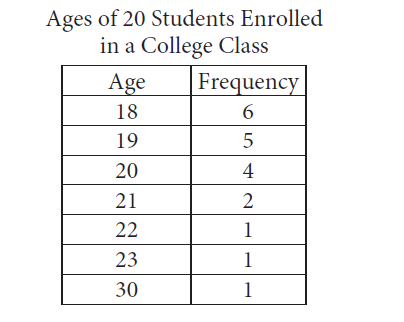
The table above shows the distribution of ages of the 20 students enrolled in a college class. Which of the following gives the correct order of the mean, median, and mode of the ages?View Solution
Knowledge Check
- Question 1 - Select One
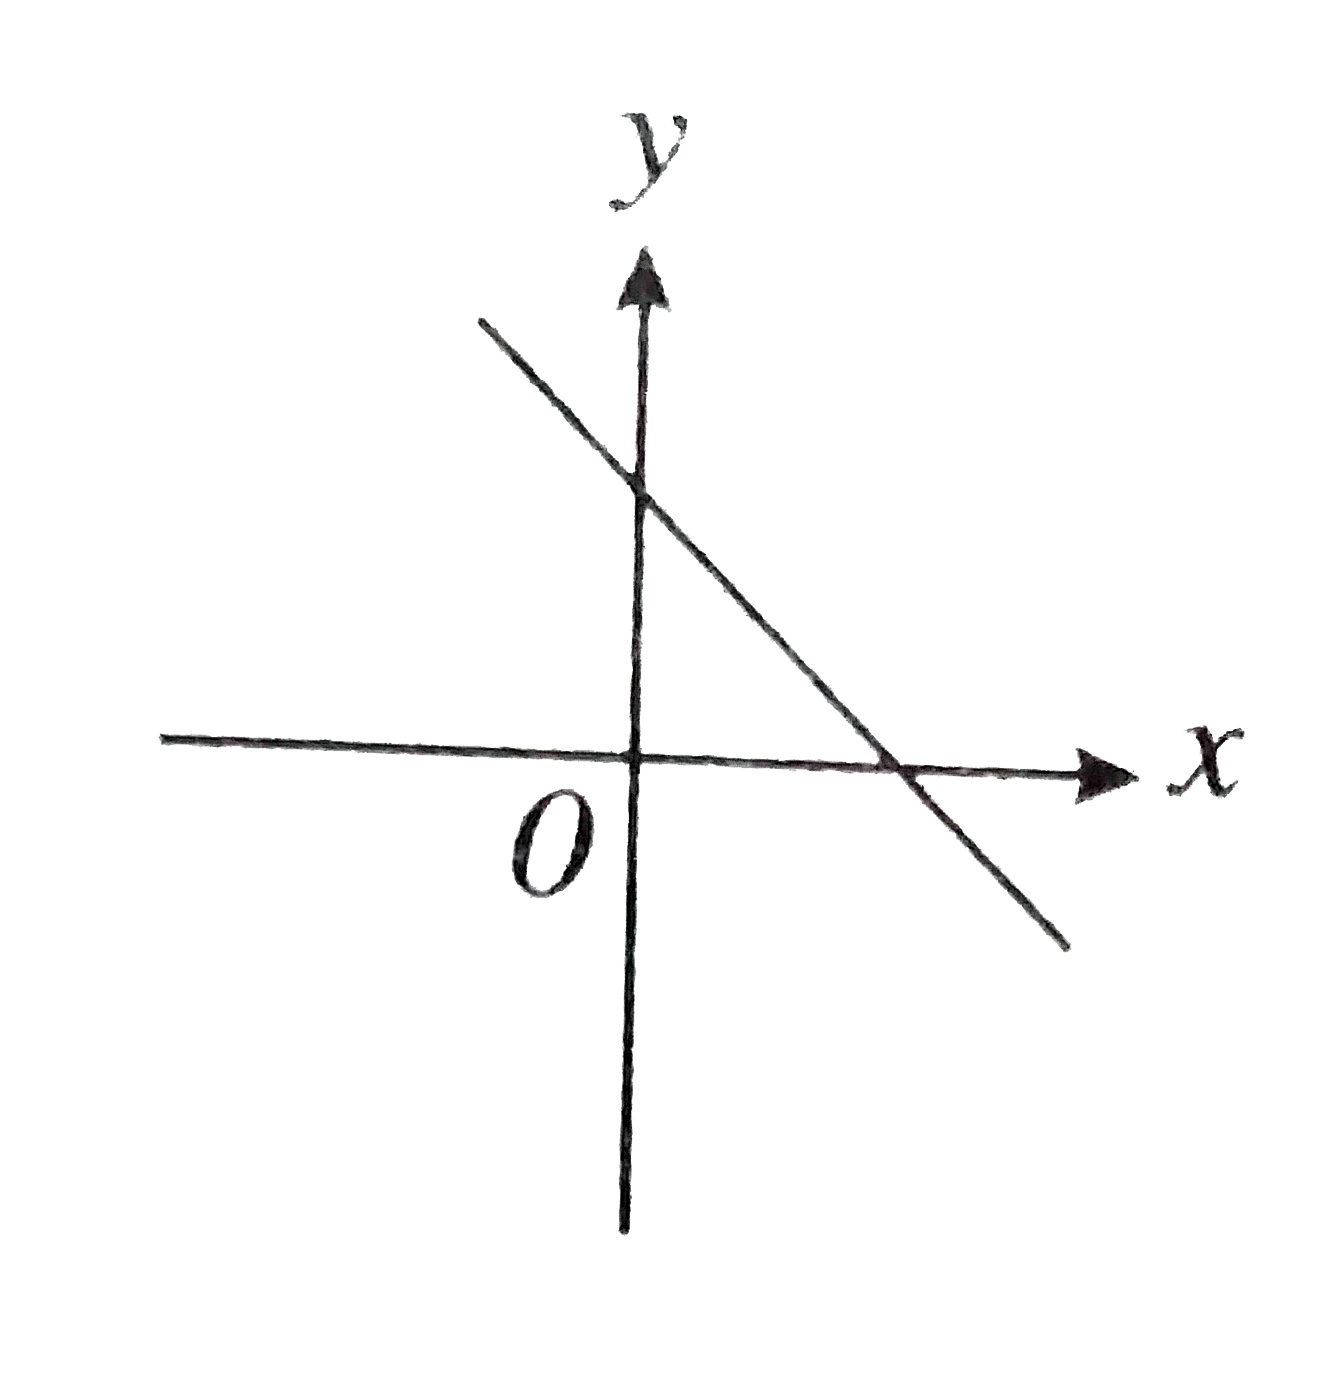
Which of the following could be the equation of the line represented in the graph above?Ay=2x+4By=2x-4Cy=-2x-1Dy=-2x+4 - Question 2 - Select One
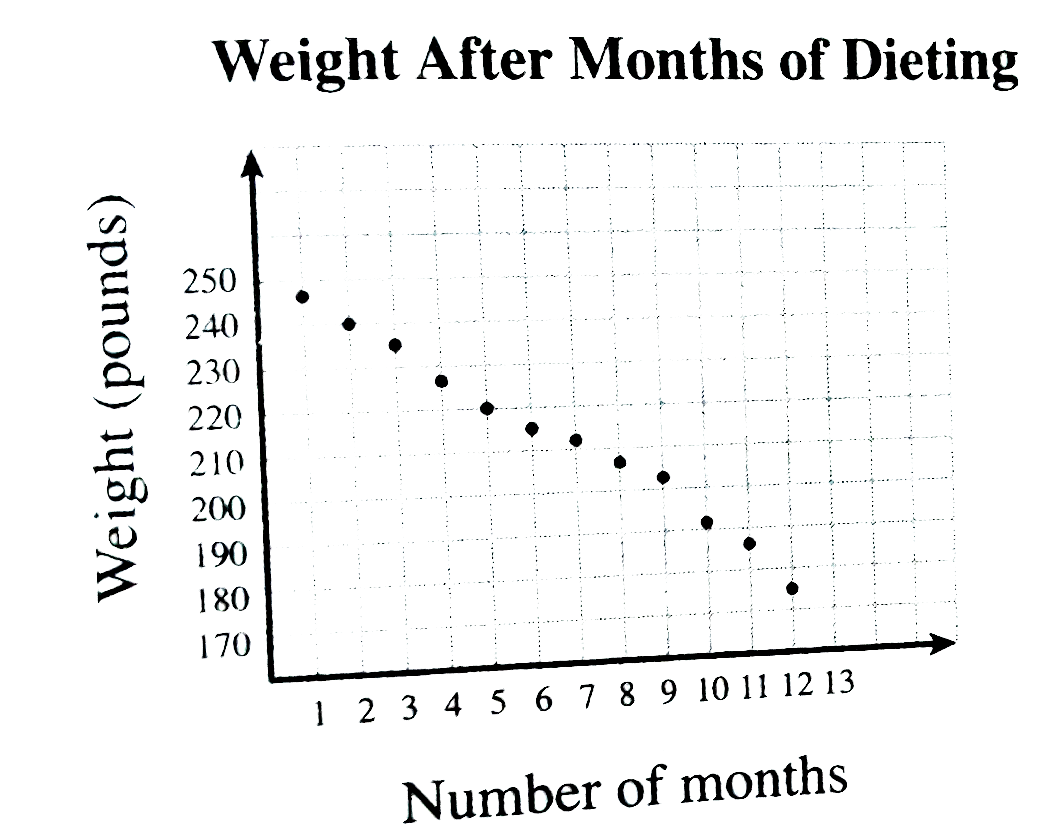
John joins a program to lose weight. Each month he records the number of months in the program and his weight at the end of the month. The graph of his progress is shown above.
Which of the following could be the equation of the line that best fits this data ?Aw=-0.159x+254.3Bw=0.159x+254.5Cw=6.28x+254.5Dw=-6.28x+254.5 - Question 3 - Select One
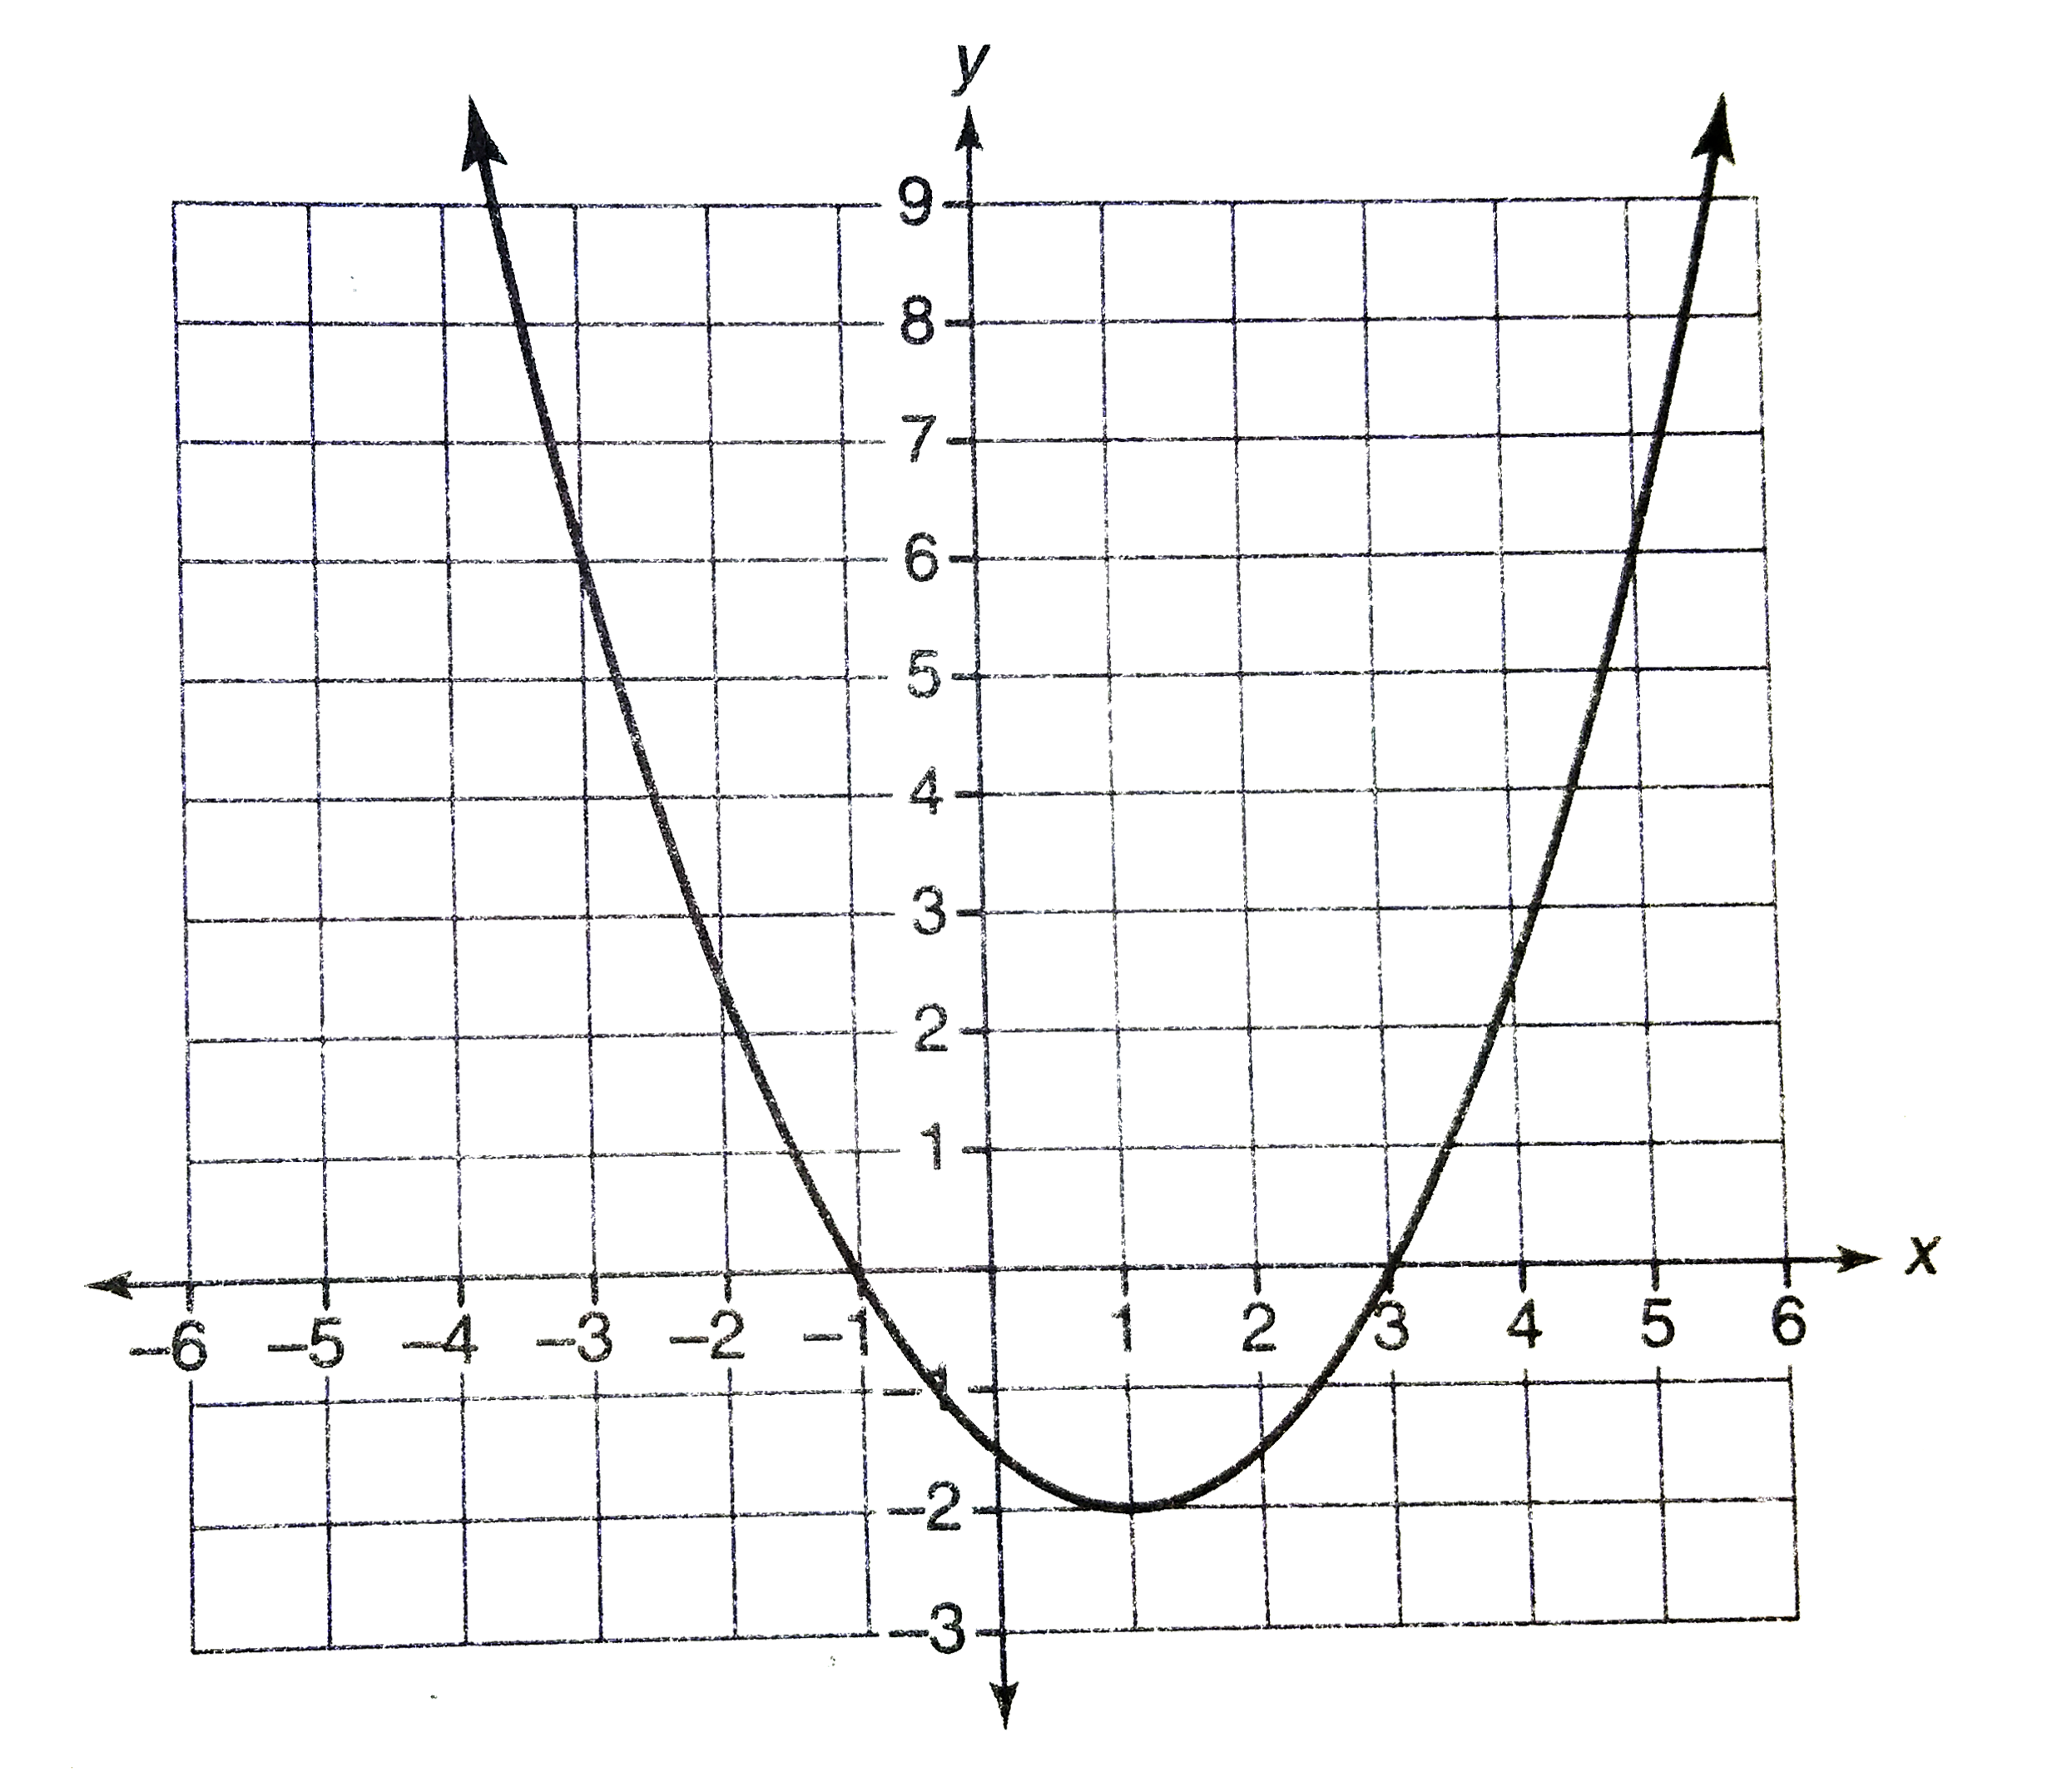
The figure above shows the graph of the quadratic function f with a minimum point at (1,−2). If f(5)=f(c), then which of the following could be the values of c?A−5B−3C0D6
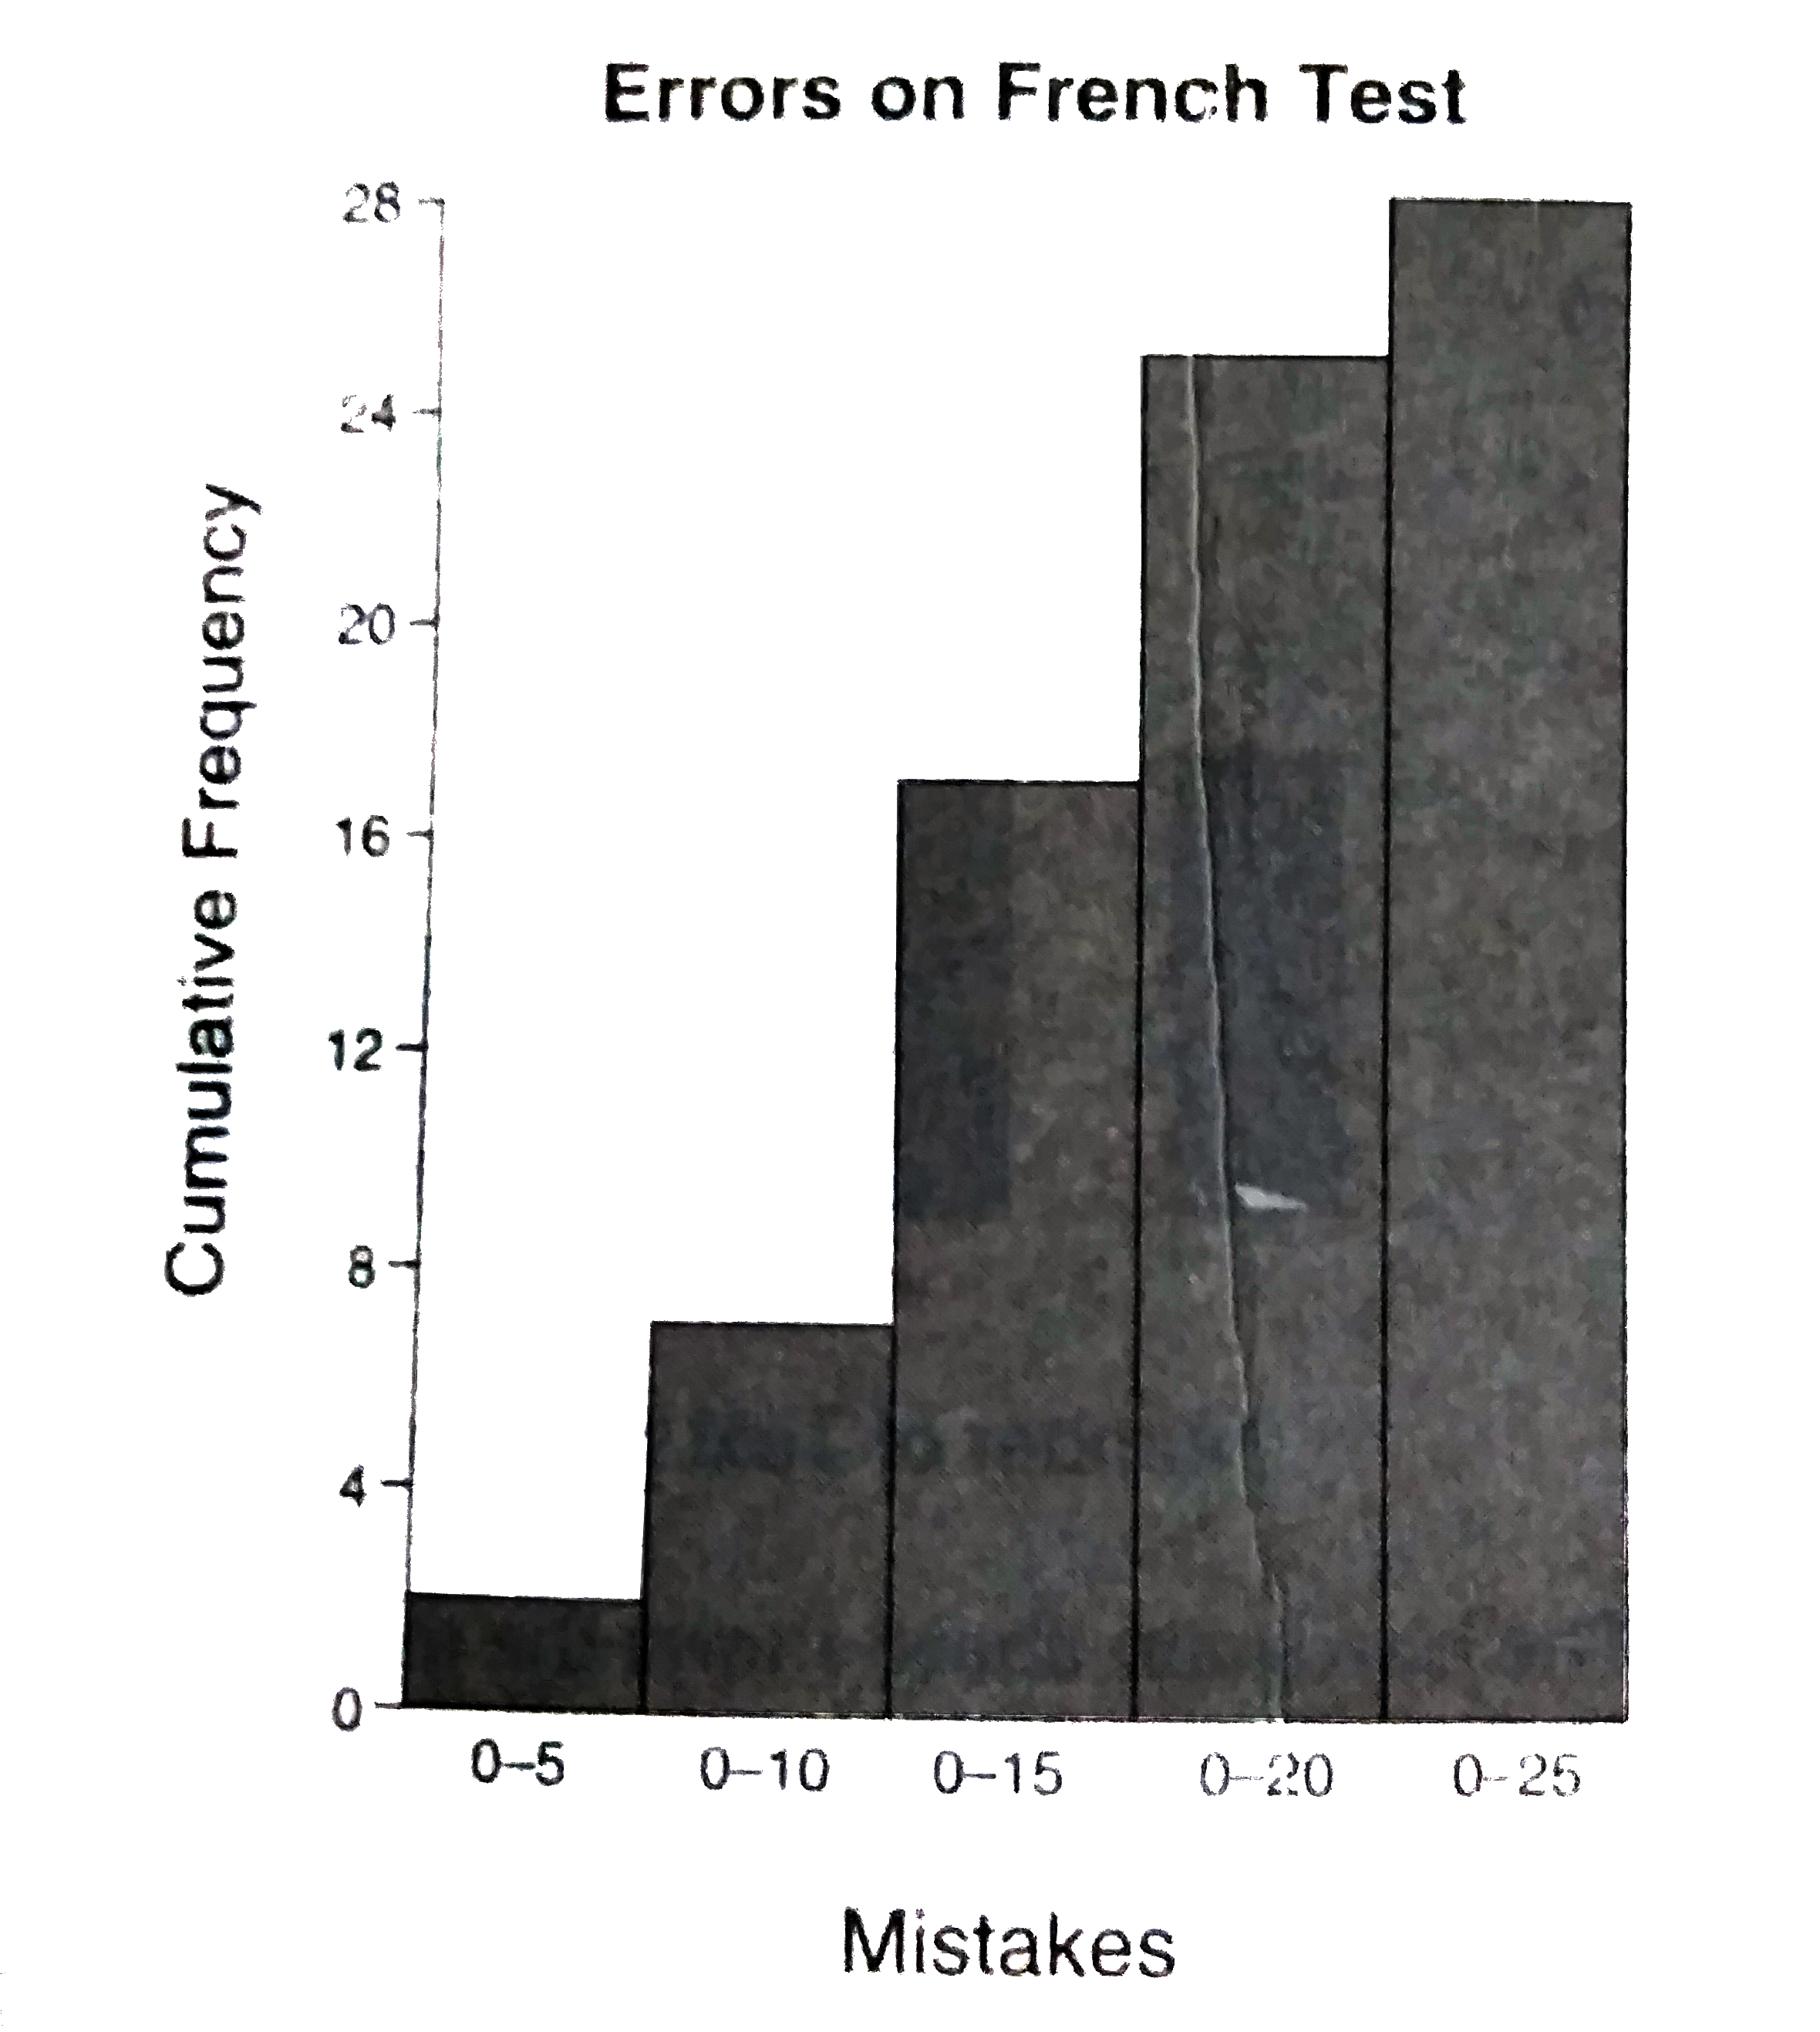
The cumulative histogram above shows the distribution of mistakes 28 students in a French languge class made on a test. What is the probability that a student selected at random made more than 10 mistakes?View SolutionWhich one of the following could be a solution of the equation x2−7x−18=0?
View Solution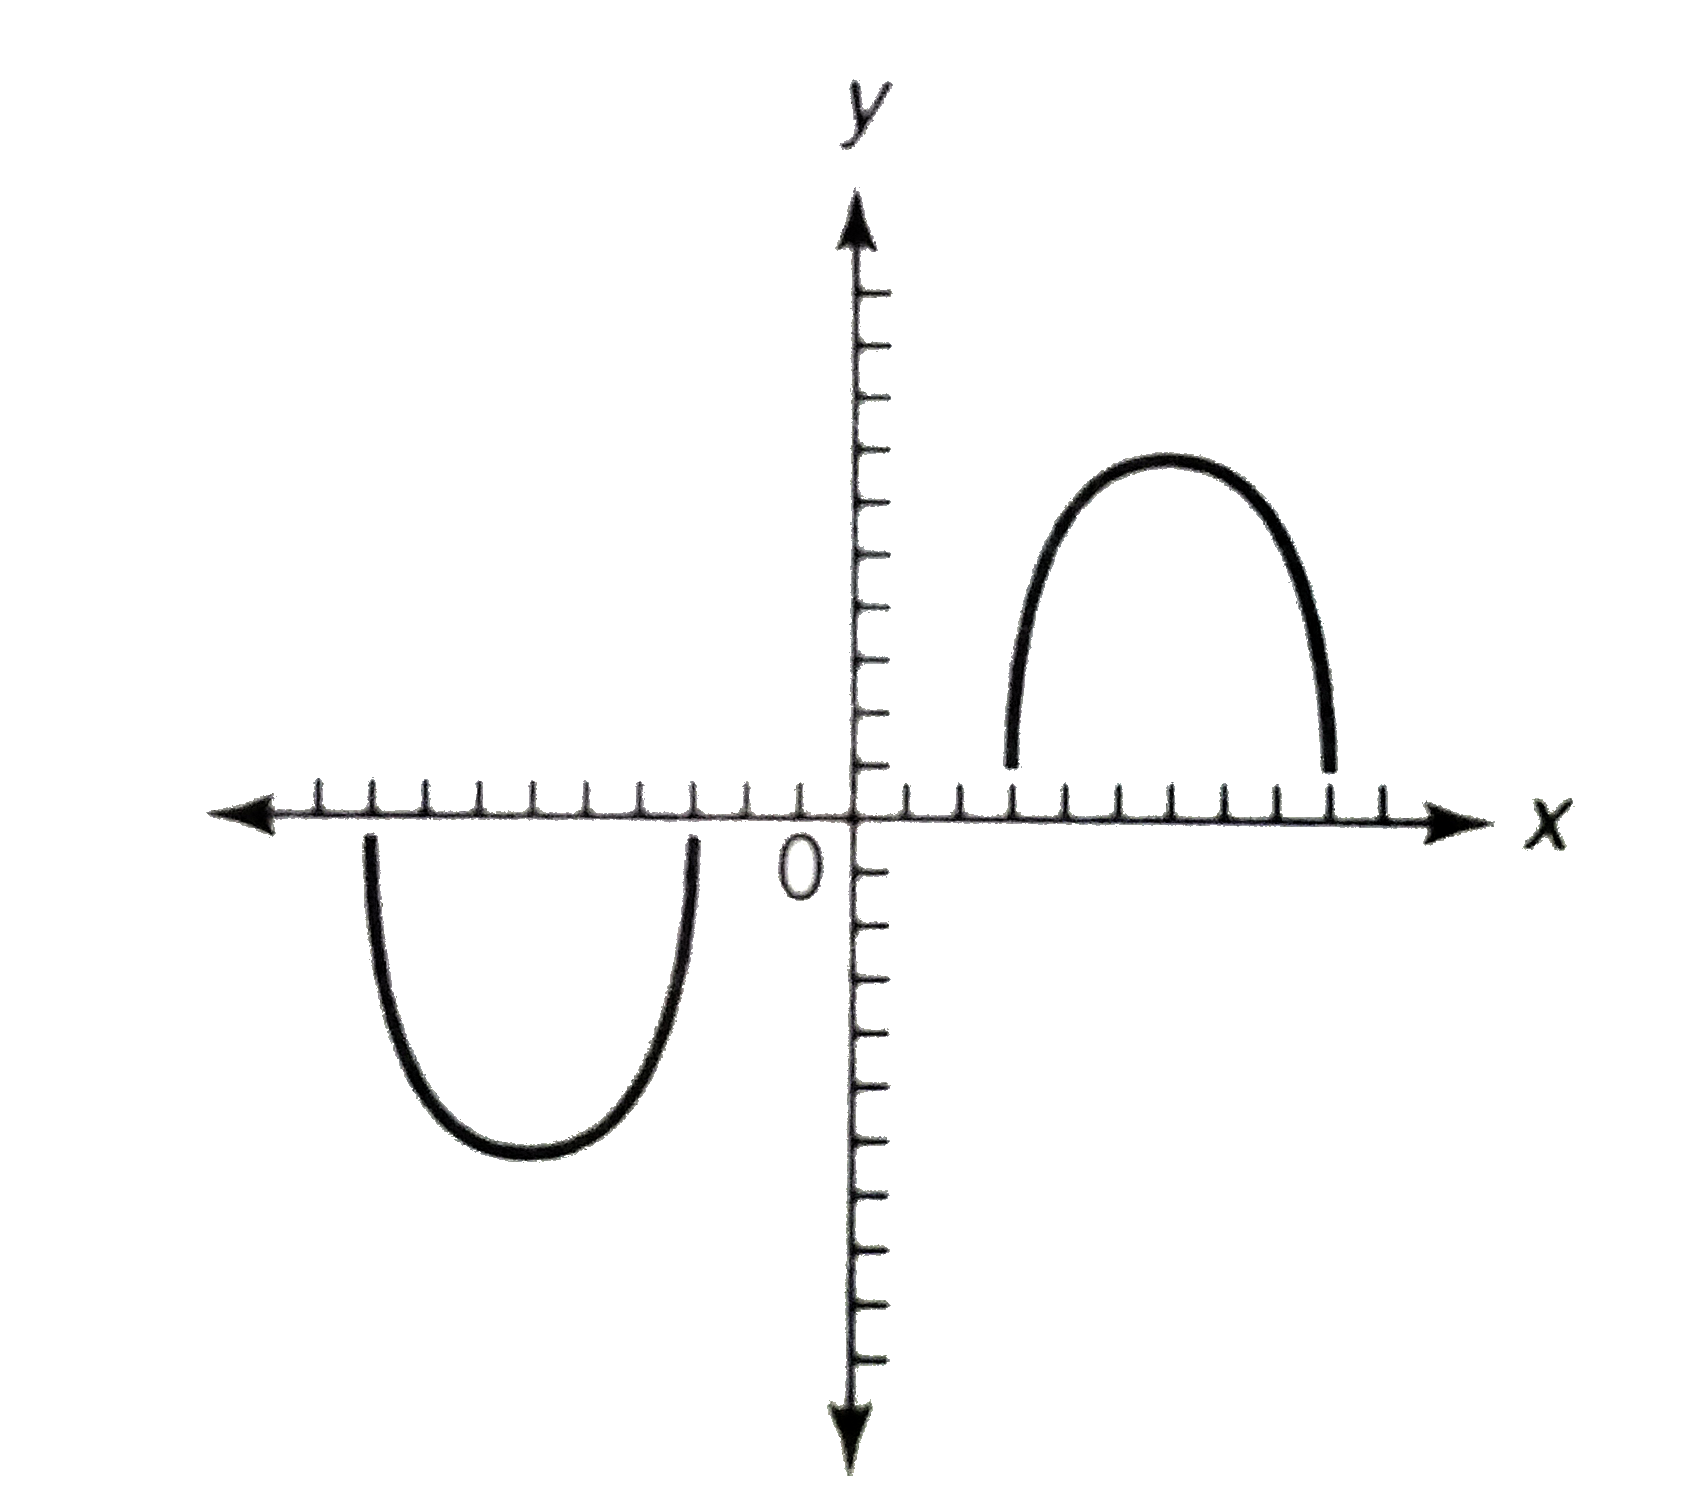
The graph of the function f is shown above. Which of the following could represent the graph of y=|f(x)|?View Solution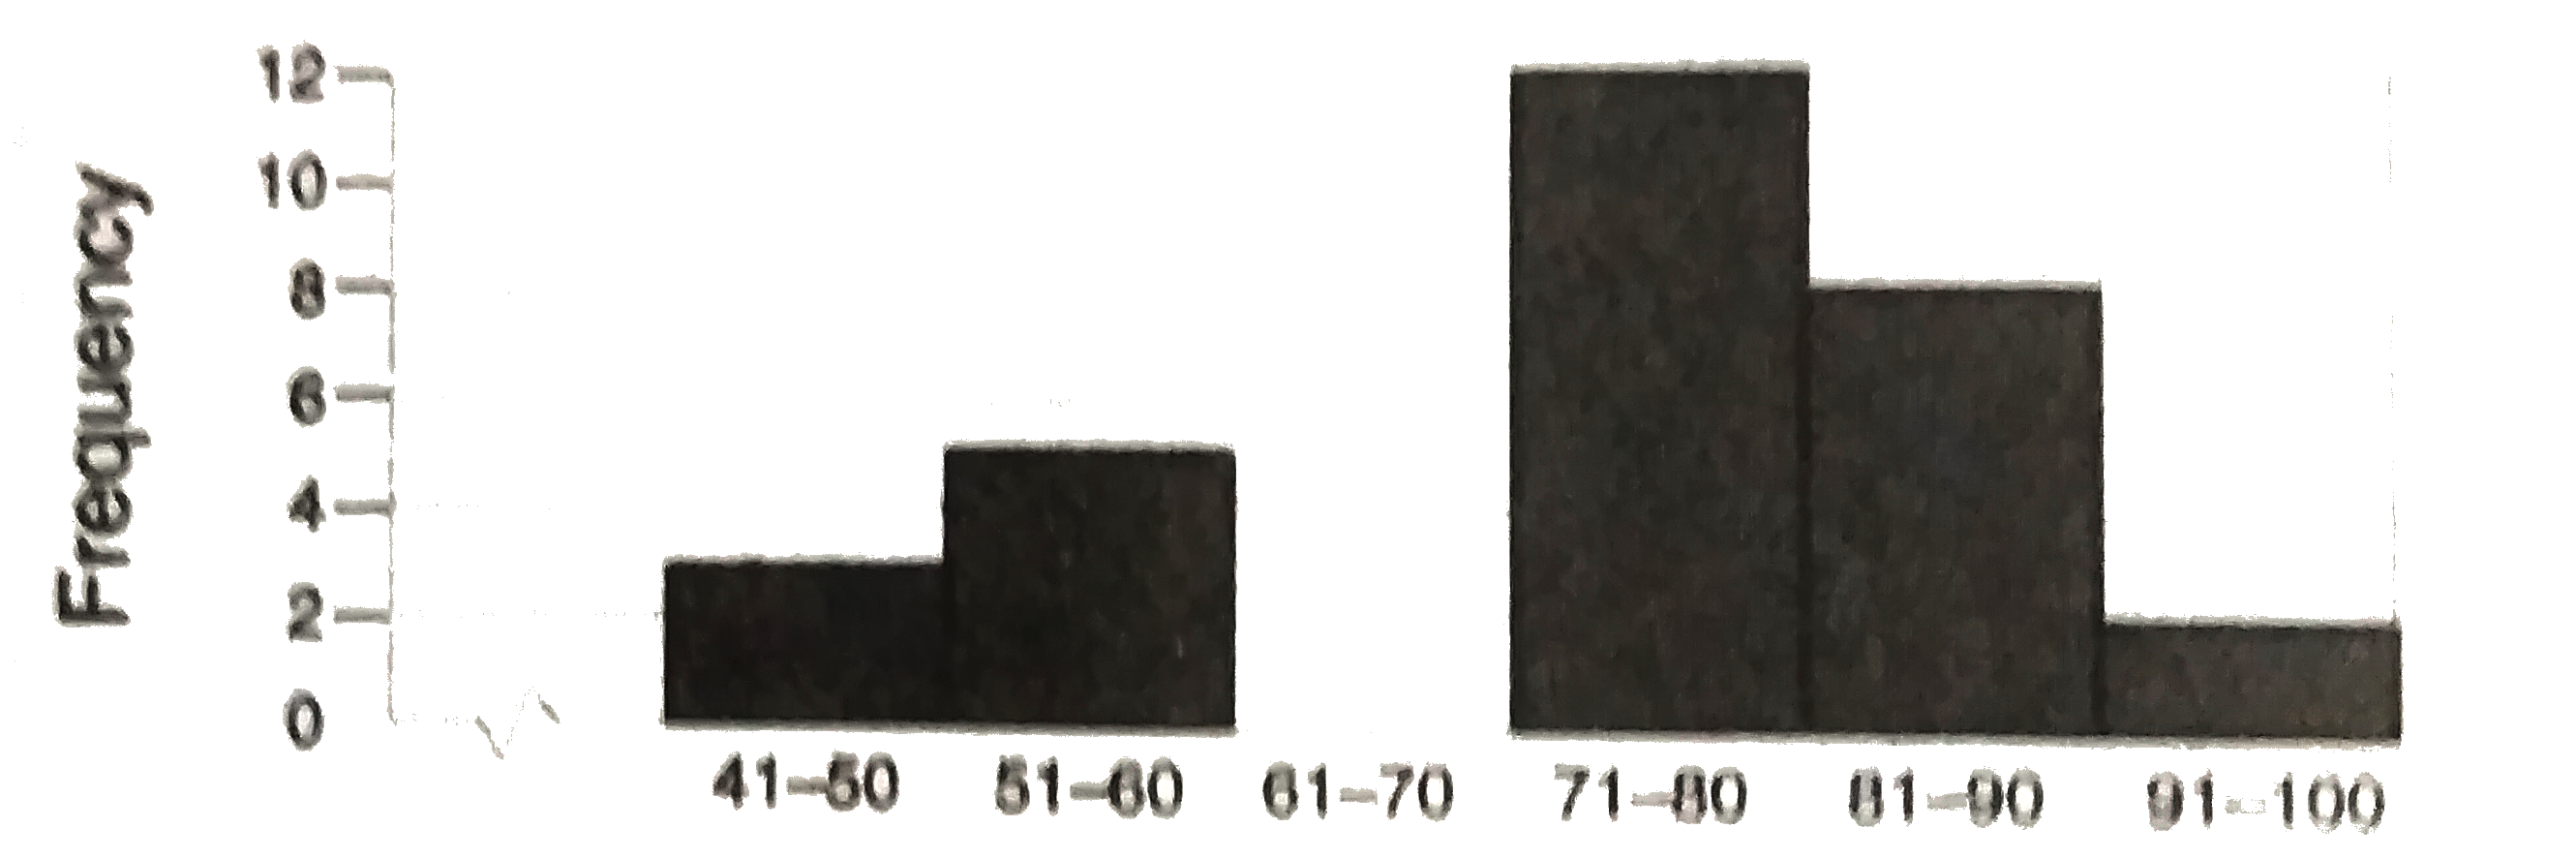
The histogram above shows the distribution of 30 test scores. If test score is selected at random, what is the probability that the score falls in the interval that contains the median score?View Solution
The histogram above shows the result of a survey taken of 25 individuals who were polled about how many weeks of vacation per year they receive. Which of the following is closest to the average (arithmetic mean) number of weeks of vacation per individual?View Solution

