Column A12 students from section A and 15 students from section B failed an Anthropolgy exam. Thus, an equal percentage of attendees failed the exam from either sectionColumnBNumber of attendees for the exam from section ANumber of attendees for the exam from section B
If column A is larger
If column B is larger
If the columns are equal
If there is not enough information to decide
The correct Answer is:B
To solve the problem step by step, we will denote the number of attendees from section A as a and from section B as b. We know the following:
- 12 students from section A failed the exam.
- 15 students from section B failed the exam.
- An equal percentage of attendees failed the exam from both sections.
Step 1: Set up the equations based on the given information
From the information provided, we can express the number of students who failed in terms of the total number of attendees and the percentage of students who failed.
For section A:
Number of students who failed=a⋅x100=12
For section B:
Number of students who failed=b⋅x100=15
Step 2: Solve for a and b
From the equation for section A, we can rearrange it to find a:
a=12⋅100x=1200x
From the equation for section B, we can rearrange it to find b:
b=15⋅100x=1500x
Step 3: Compare a and b
Now we have:
a=1200xandb=1500x
Since the denominators are the same, we can compare the numerators:
1200and1500
Clearly, 1500>1200, which implies:
b>a
Conclusion
Thus, the number of attendees from section B who took the exam is greater than the number of attendees from section A. Therefore, we conclude that:
Column B is larger than Column A.
The correct option is option 2.
---
- 15 students from section B failed the exam.
- An equal percentage of attendees failed the exam from both sections.
Number of students who failed=a⋅x100=12
Number of students who failed=b⋅x100=15
a=12⋅100x=1200x
b=15⋅100x=1500x
a=1200xandb=1500x
1200and1500
b>a
Similar Questions
There are 100 students in class VII in a school. 40 students are in Section A, 33 in Section B, and the remaining students are in Section C. Find what percentage of students are there in each section.
View Solution300 students took an exam. 28% failed. Calculate the number of students who passed the exam.
View Solution
Knowledge Check
- Question 1 - Select One
Column AA set has exactly five consecutive positive integersColumn BThe percentage decrease in the average of the number when one of the numbers is dropped from the set20%
AIf column A is largerBIf column B is largerCIf the columns are equalDIf there is not enough information to decide - Question 2 - Select One
A transverse section of a young dicot root can be distinguished from that of a young dicot stem by the presence of :
AA) radial arrangements of xylem and phloemBB) interfascicular cambiumCC) intrafascicular cambiumDD) collateral arrangement of xylem and phloem
The number of students in section X A and X B are 30 and 35 respectively. The mean scores of students in the mathematices test are as follows:
 View Solution
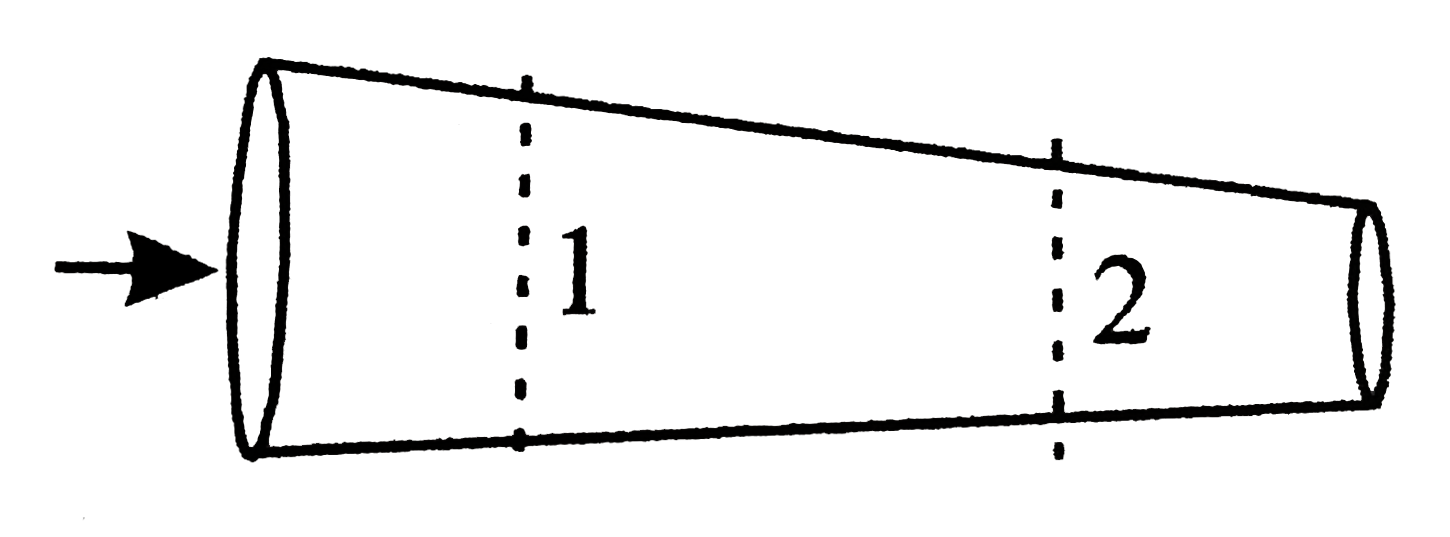
Consider a conductor of variable cross section in which current is flowing from cross section 1 to 2. Then
 View Solution
There are two examination rooms A and B. If 10 candidates are sent from A to B, the number of students in each room is same. If 20 candidates are sent from B to A, the number of students in A is double the number of students in B. Find the number of students in each room.
View SolutionIn a school there are two sections section A and section B of class X . There are 32 students in section A and 36 students in section B . Determine the minimum number of books required for their class library so that they can be distributed equally among students of section A or section B .
View SolutionIn a school there are two sections - section A and section B of Class VI. There are 32 students in section A and 36 in section B. Determine the minimum number of books required for their class library so that they can be distributed equally among students of section A or section B.
View SolutionThe following table gives the distribution of students of two sections according to the marks obtained by them

Represent the marks of the students of both the sections on the same graph by two frquency polygons. From the two polygons compare the performance of the two sections.View Solution

