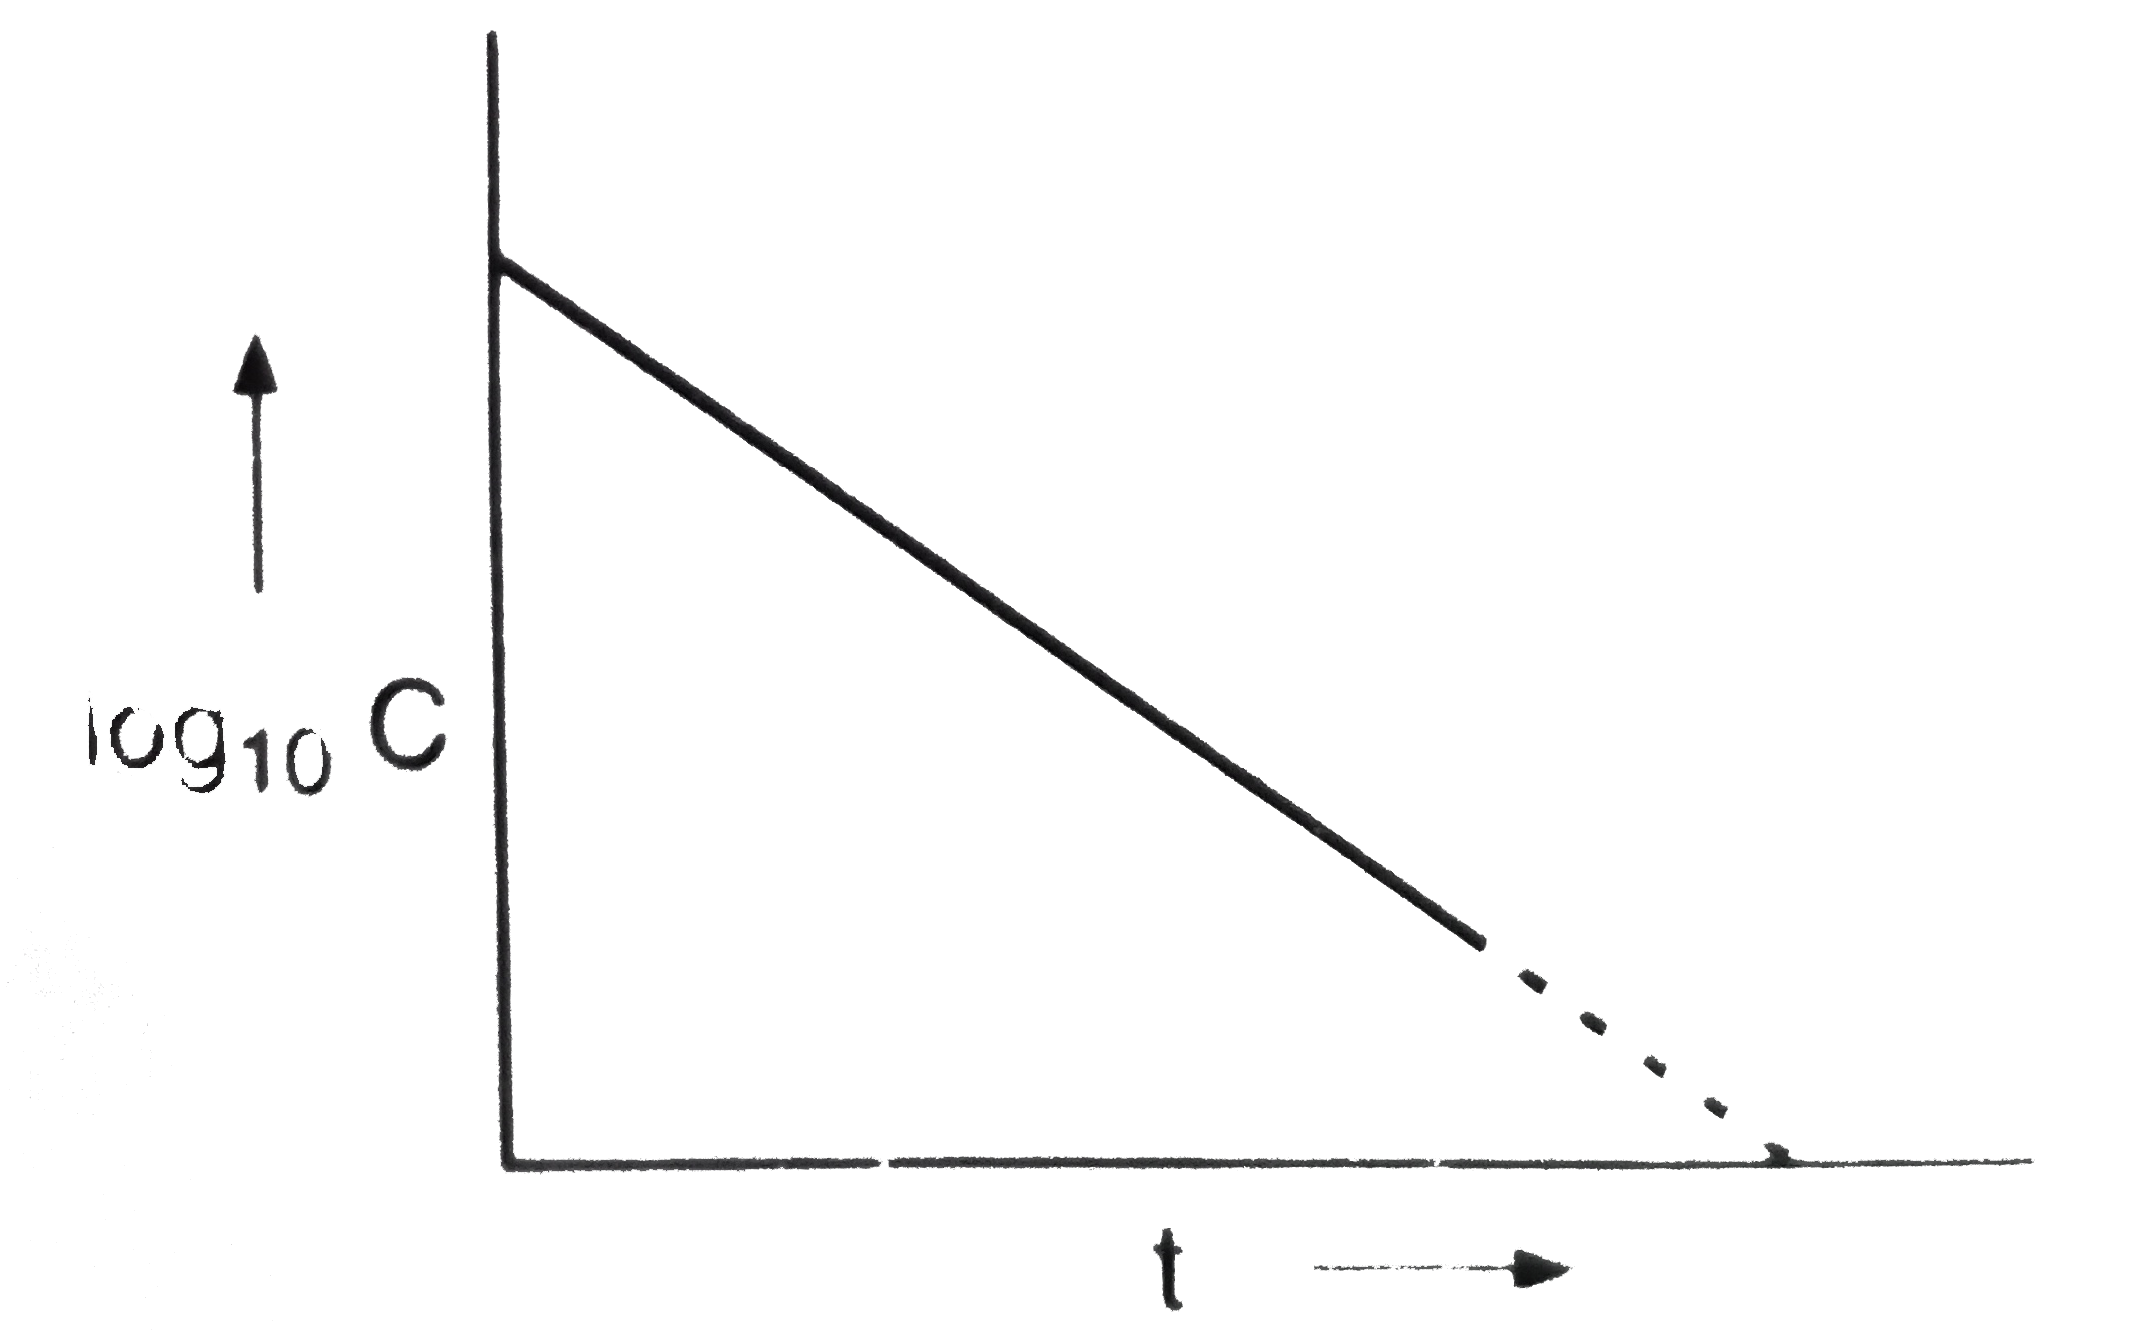
Variation of log10K with 1T is shown by the following graph in which straight line is at 45∘ , hence ΔH∘ is: 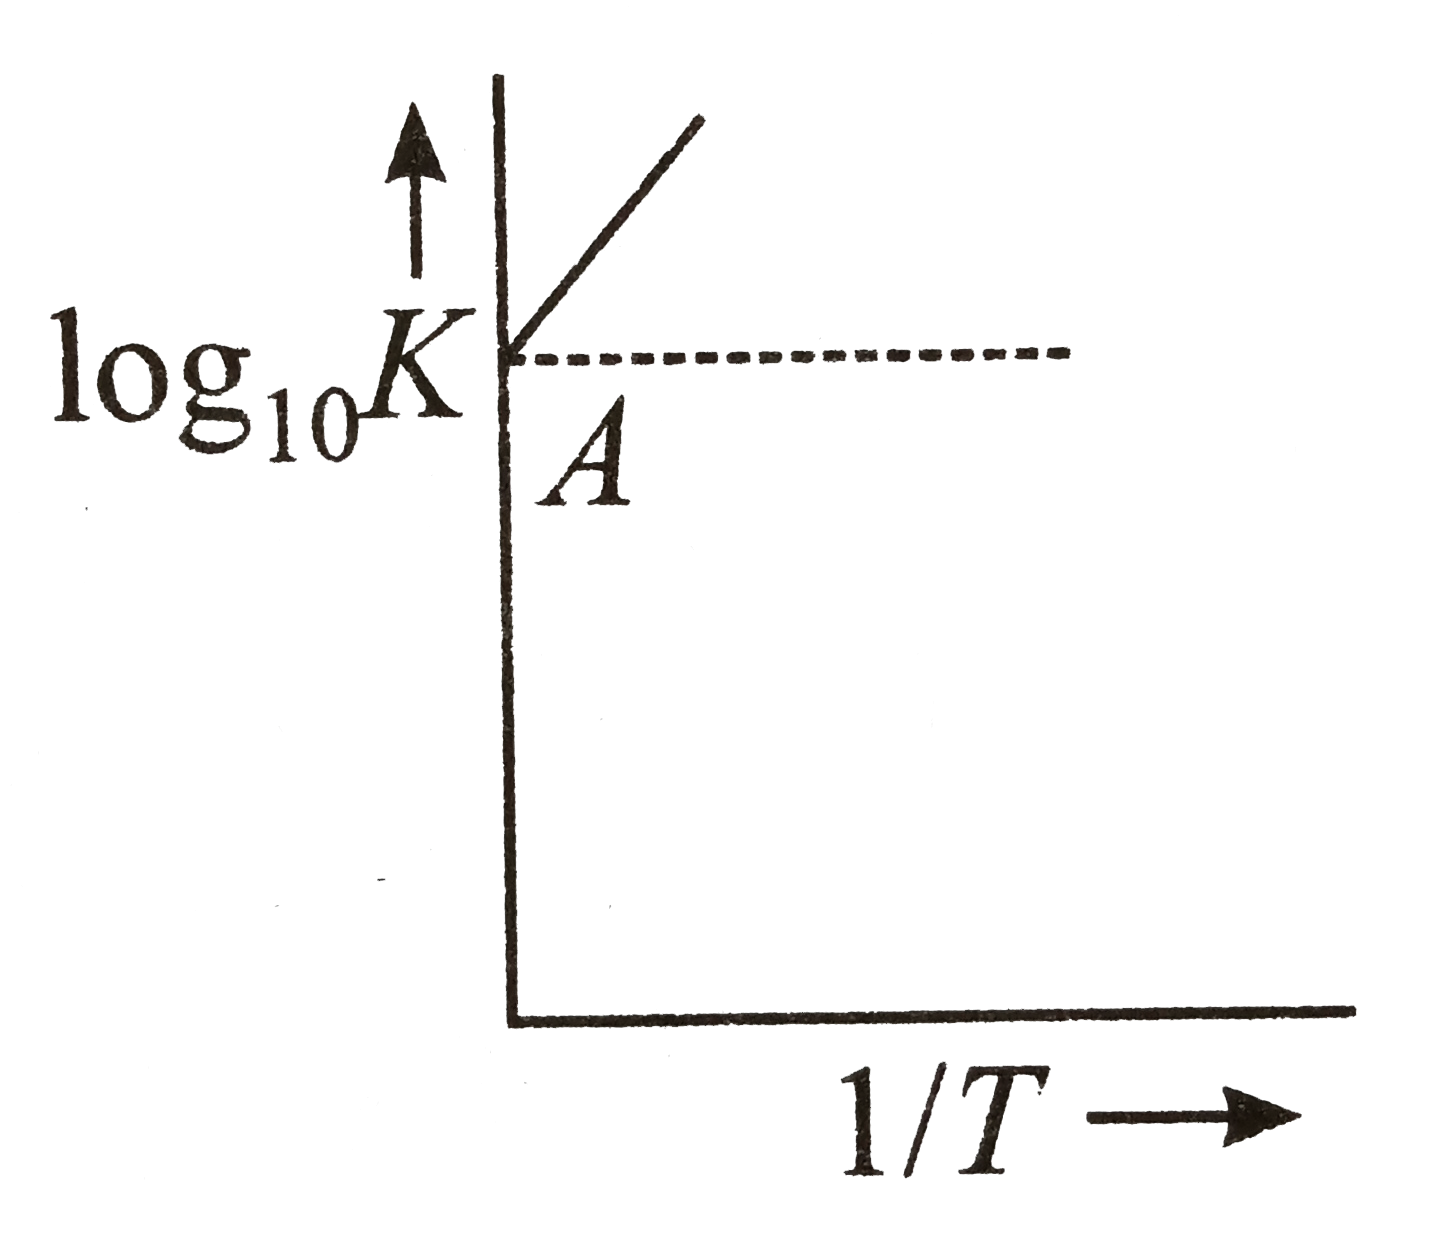
+4.606cal
–4.606cal
2 cal
–2cal
The correct Answer is:B
Step by step video, text & image solution for Variation of log_(10)K with (1)/(T) is shown by the following graph in which straight line is at 45^(@) , hence Delta H^(@) is: by Chemistry experts to help you in doubts & scoring excellent marks in Class 12 exams.
Updated on:21/07/2023Topper's Solved these Questions
- CHEMICAL EQUILIBRIUMBOOK - MOTIONCHAPTER - CHEMICAL EQUILIBRIUMEXERCISE - Exercise - 2
99 Videos
- CHEMICAL EQUILIBRIUMBOOK - MOTIONCHAPTER - CHEMICAL EQUILIBRIUMEXERCISE - Exercise - 3
67 Videos
- CHEMICAL EQUILIBRIUMBOOK - MOTIONCHAPTER - CHEMICAL EQUILIBRIUMEXERCISE - SOLVED EXAMPLES
10 Videos
- CHEMICAL BONDING BOOK - MOTIONCHAPTER - CHEMICAL BONDING EXERCISE - EXERCISE -4 LEVEL-II
40 Videos
- Chemical KineticsBOOK - MOTIONCHAPTER - Chemical KineticsEXERCISE - Exercise - 4 (Level - II) (SUBJECTIVE PROBLEM)
1 Videos
Similar Questions
Knowledge Check
Which of the following graph yield a straight line?
AGraph :√y versus x for the equation y=4x2BGraph : y versus √x for the equationy=36√xCGraph : y versus 1/x for the equation y=(4/x)−2DGraph : K versus v for equation K=hv−ϕ0 where h and ϕ0 are constants.In S.H.M. which one of the following graphs is a straight line ?
AP.E. against displacementBacceleration against timeqCtotal energy against displacementDvelocity against displacementWhich of the following graphs is not a straight line for an ideal gas ?
AV→TBT→PCn→1TDn→1P
In SHM, graph of which of the following is a straight line?
View SolutionVariation of KH (Henry's law constant) with temperature T is shown by following graphs I−IV

correct representation is
View SolutionMatch the following :−
List-I List -II
(P) Plot of lot t1/2 vs log[A0] is a straight line with a slope of '-1' (1) Zero order
( Q ) Plot of log t1/2 vs log[A0] is a straight line with a slope of '1' (2) 2nd order
( R ) Plot of log Kp vs 1/T is a straight line with a negative slope (3) ΔH∘ is negative
( S ) Plot of log Kp vs 1/T is a straight line with a positive slope (4) ΔH∘ is positive
View SolutionWhen loge k is plotted against 1T using the Arrhenius equation a straight line is expected with a slope equal to ,
View SolutionIf a plant of log10 C versust t gives a straight line for a given reaction, then the reaction is :
View Solution

