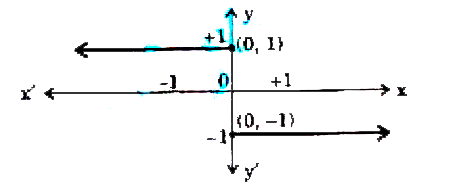
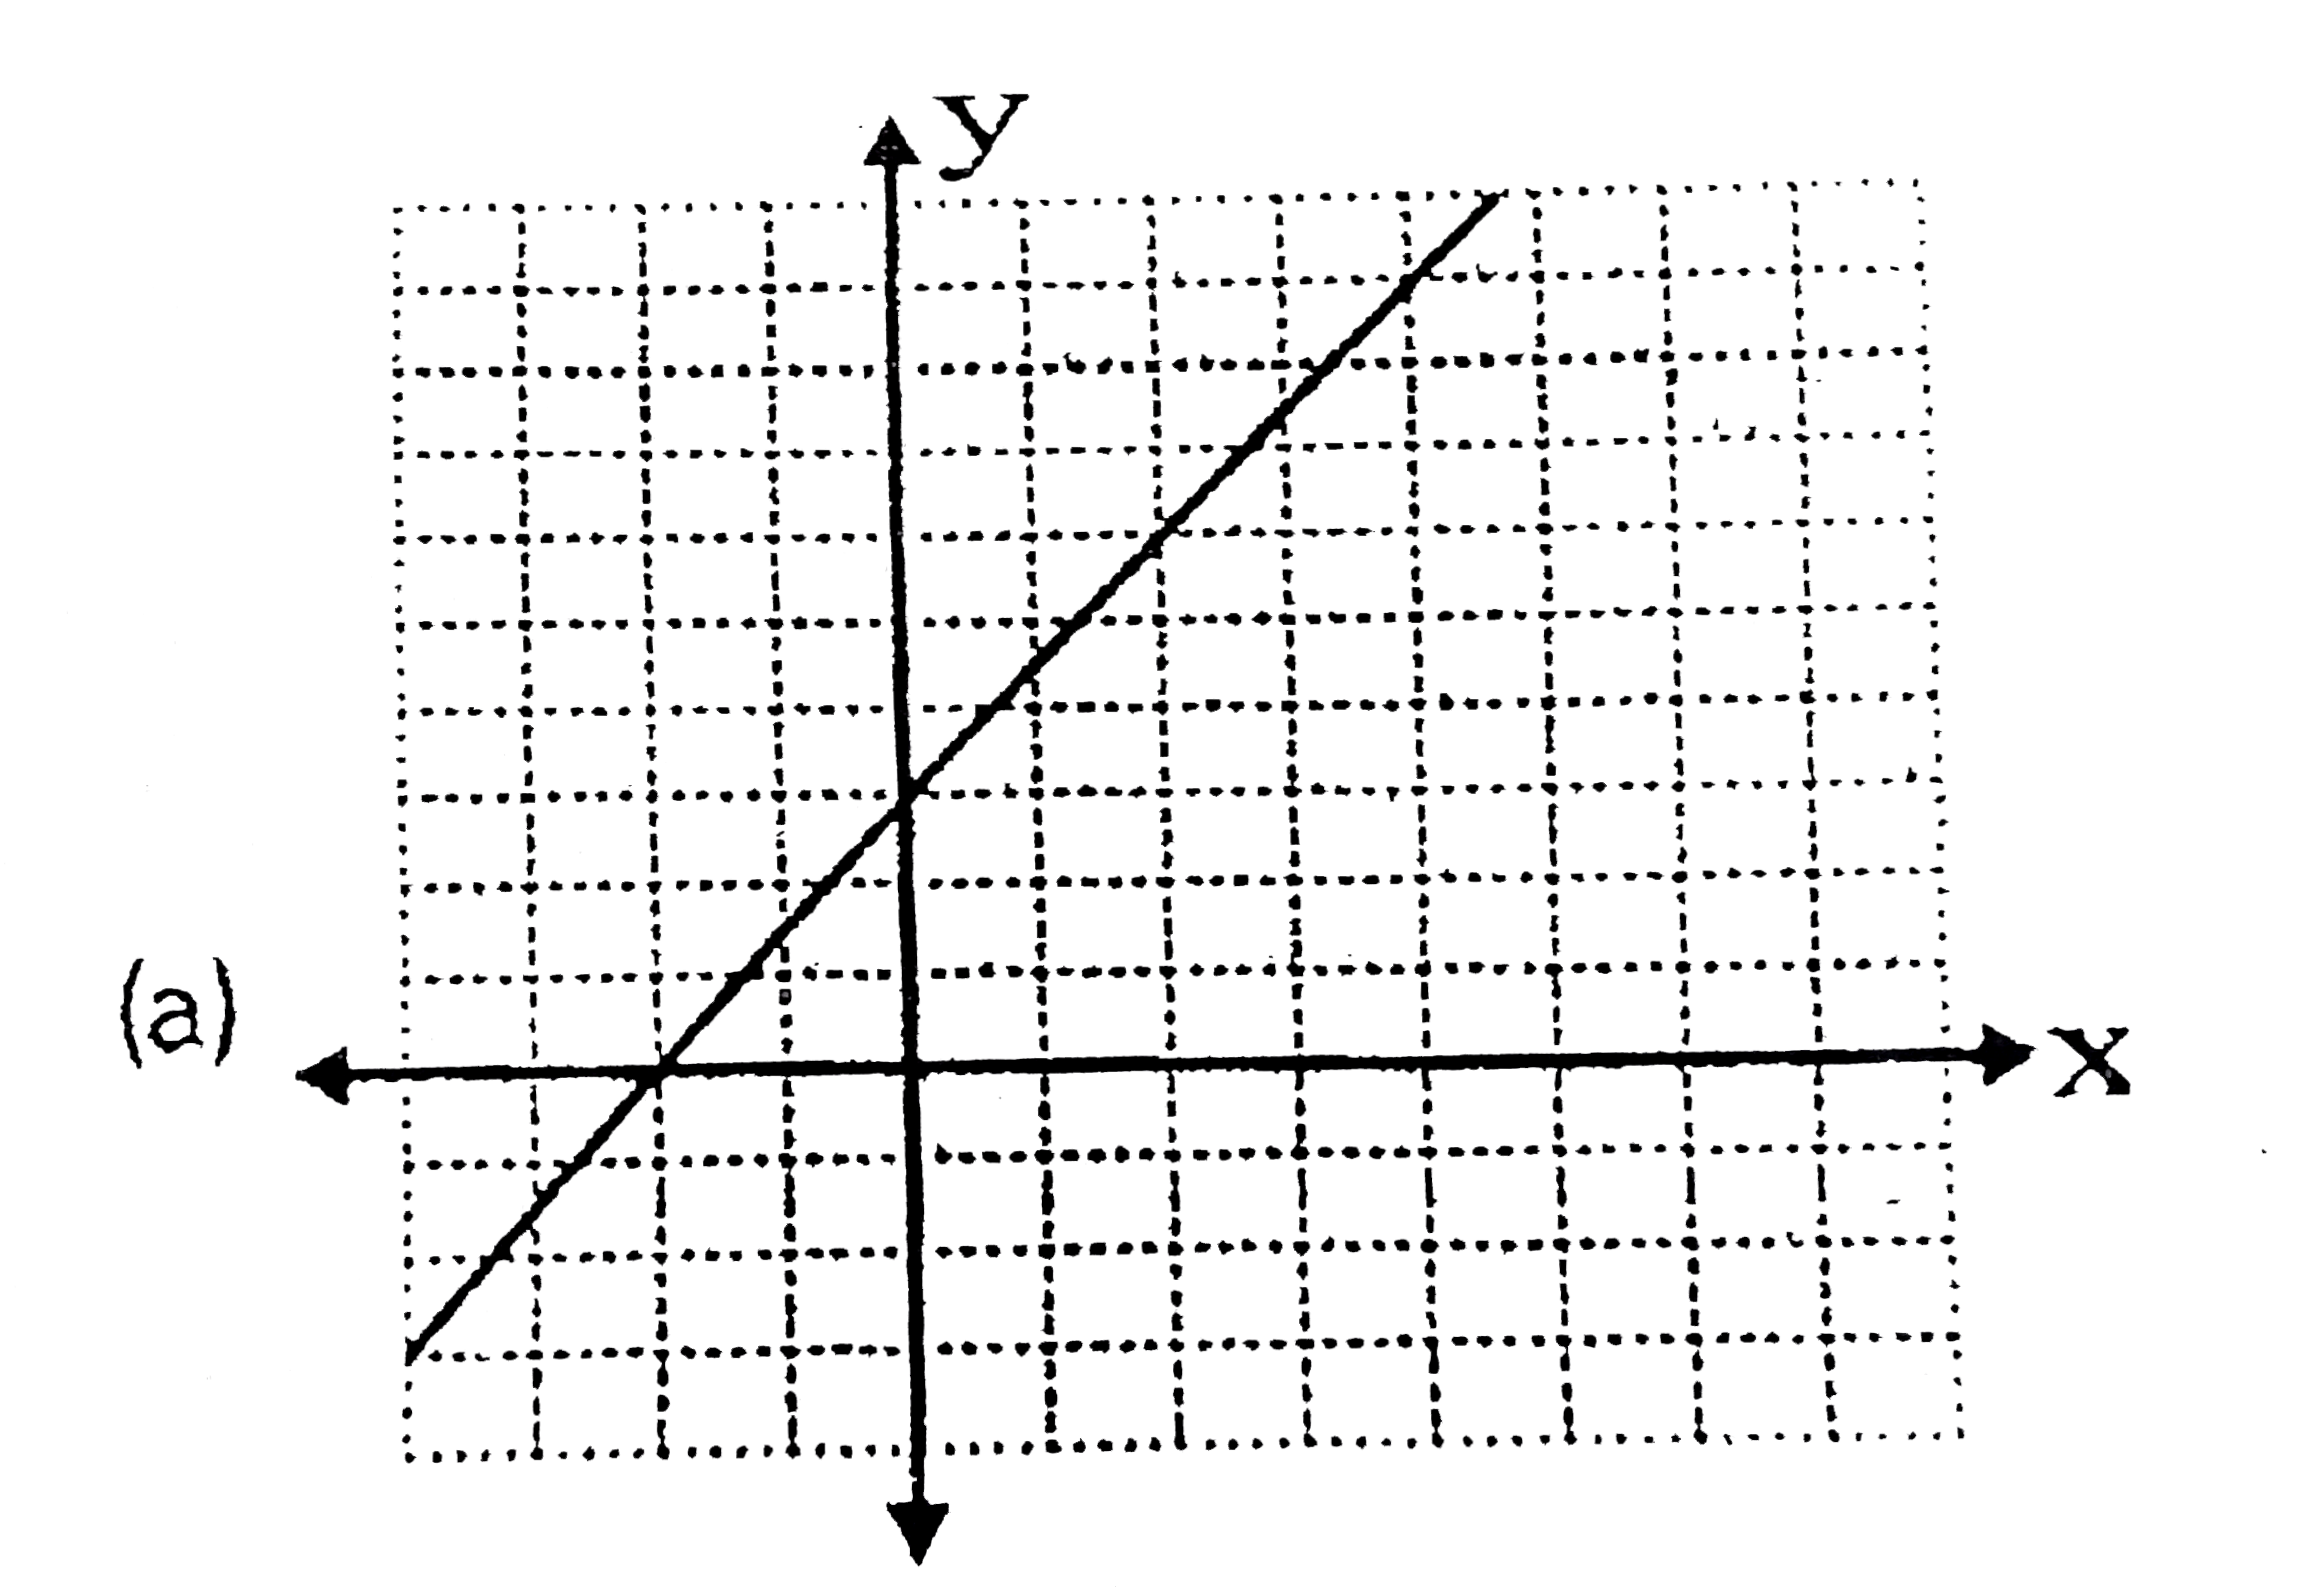
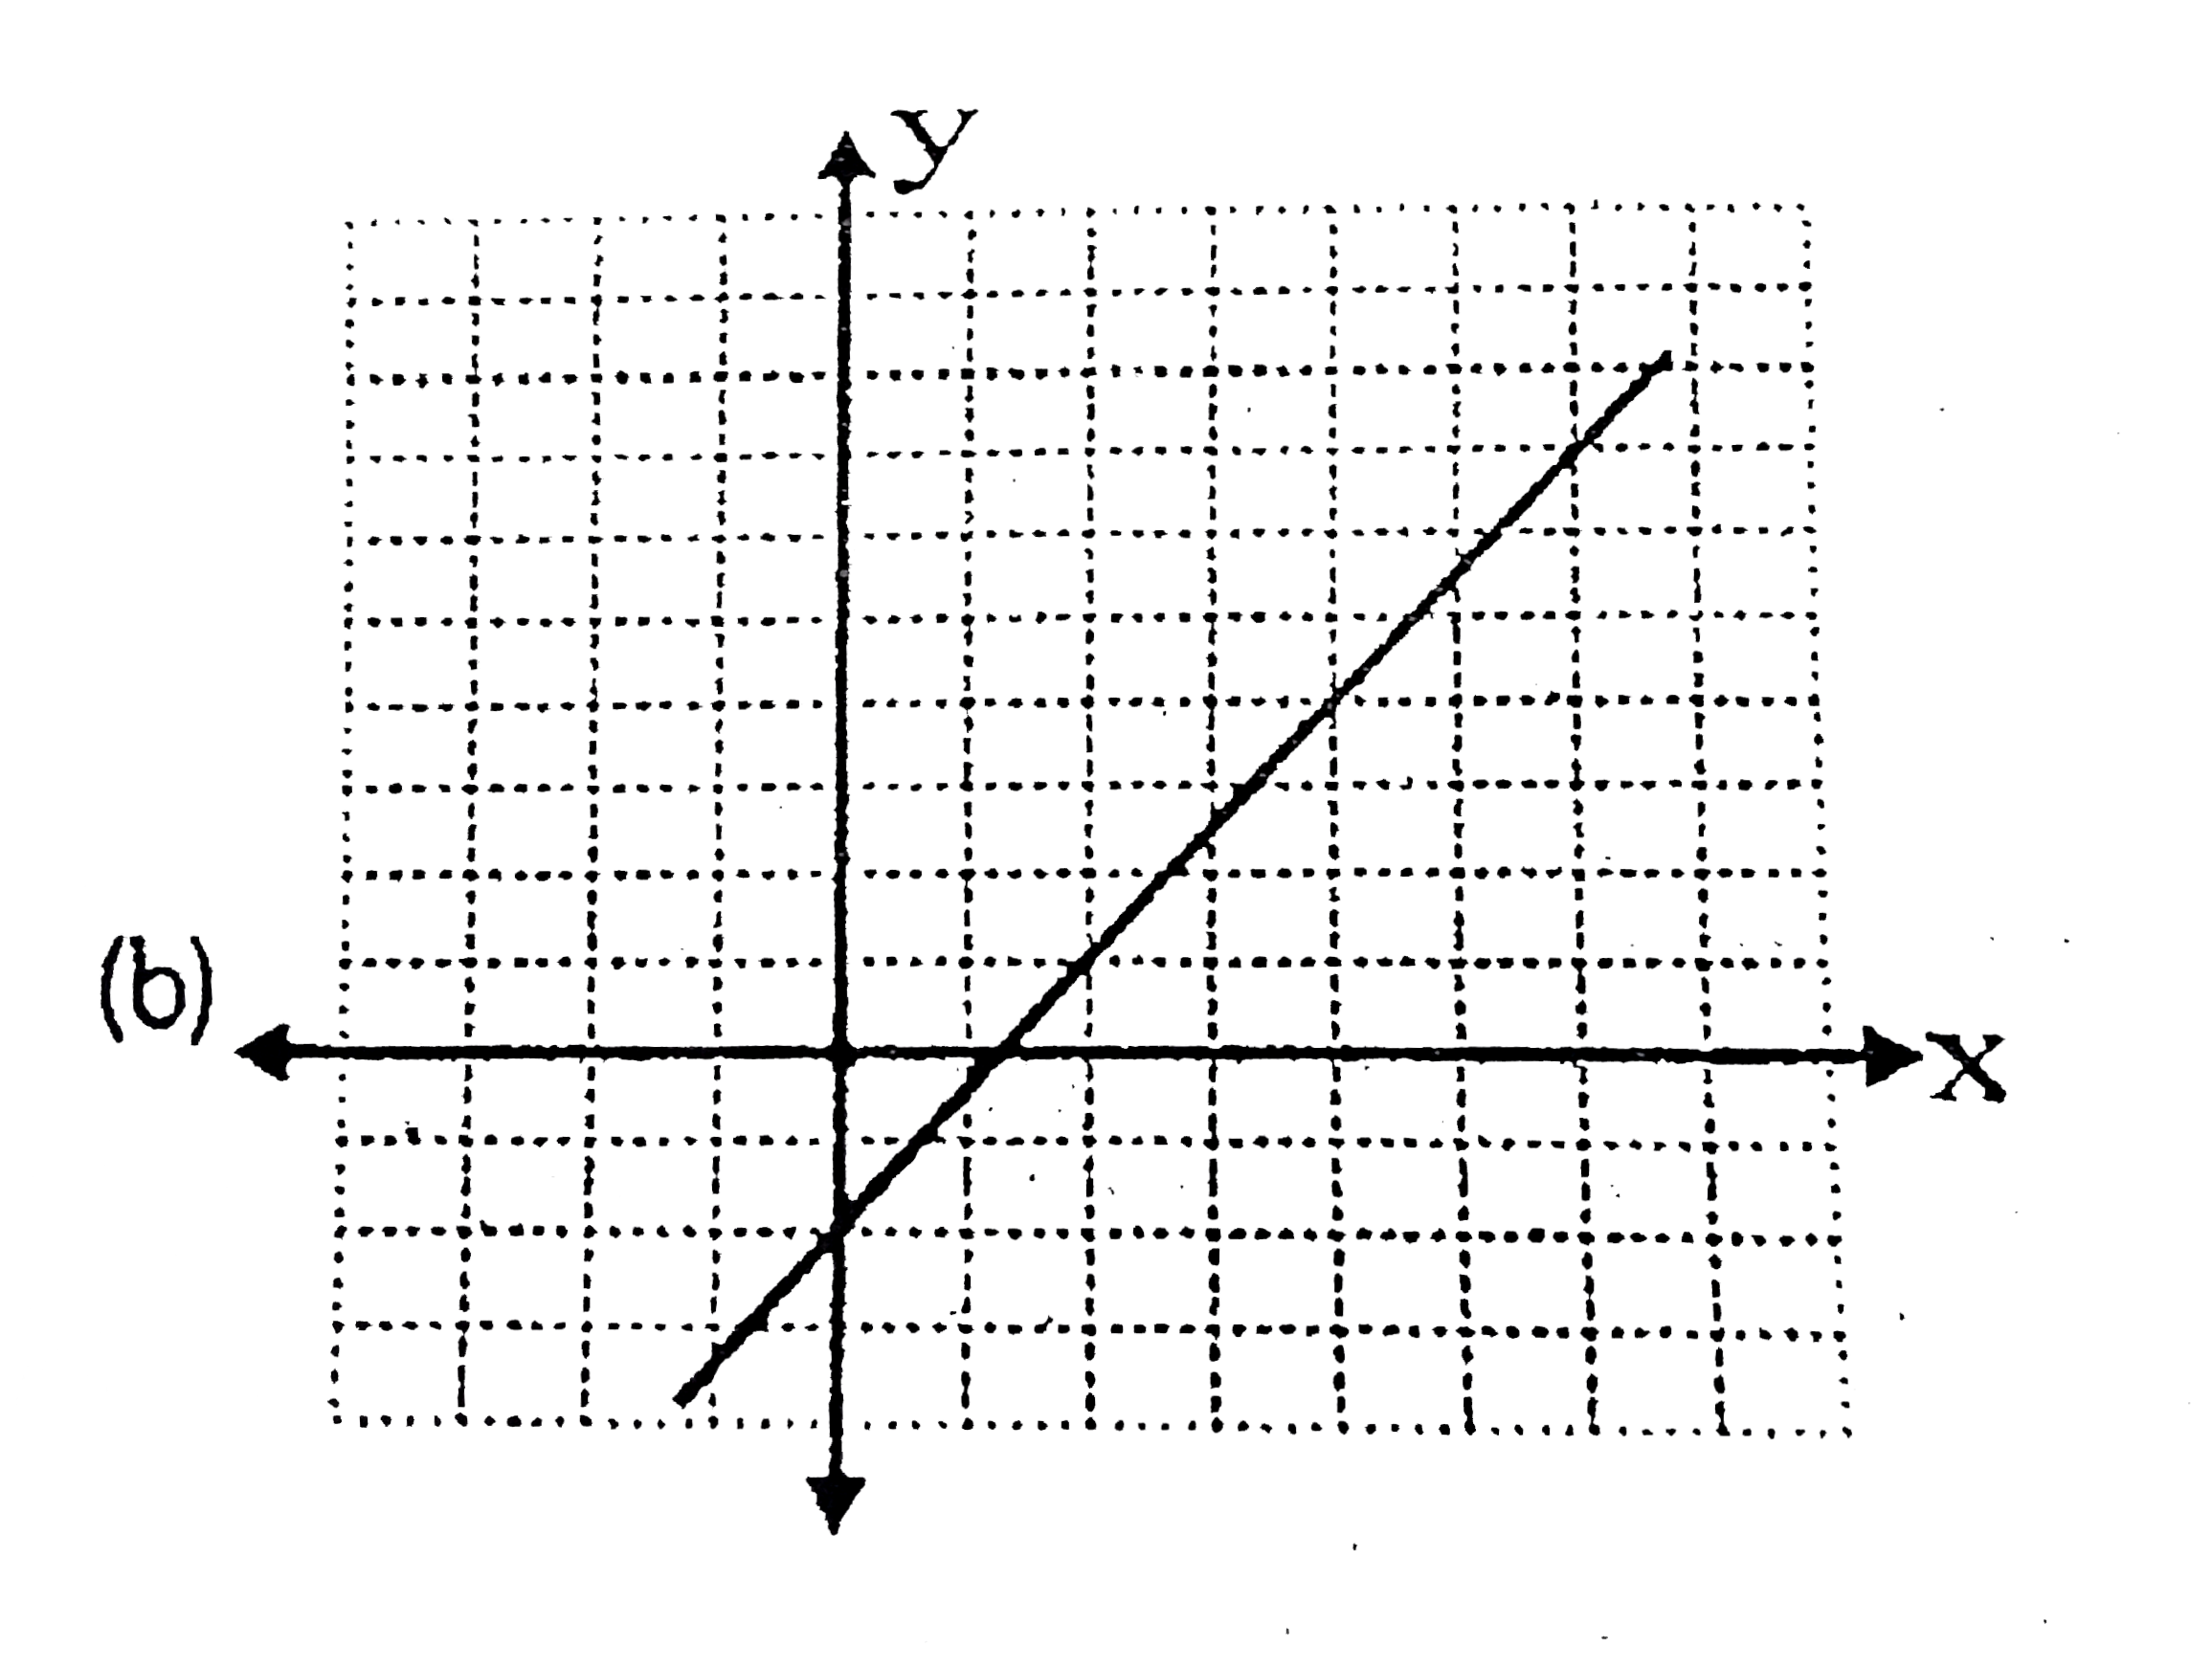
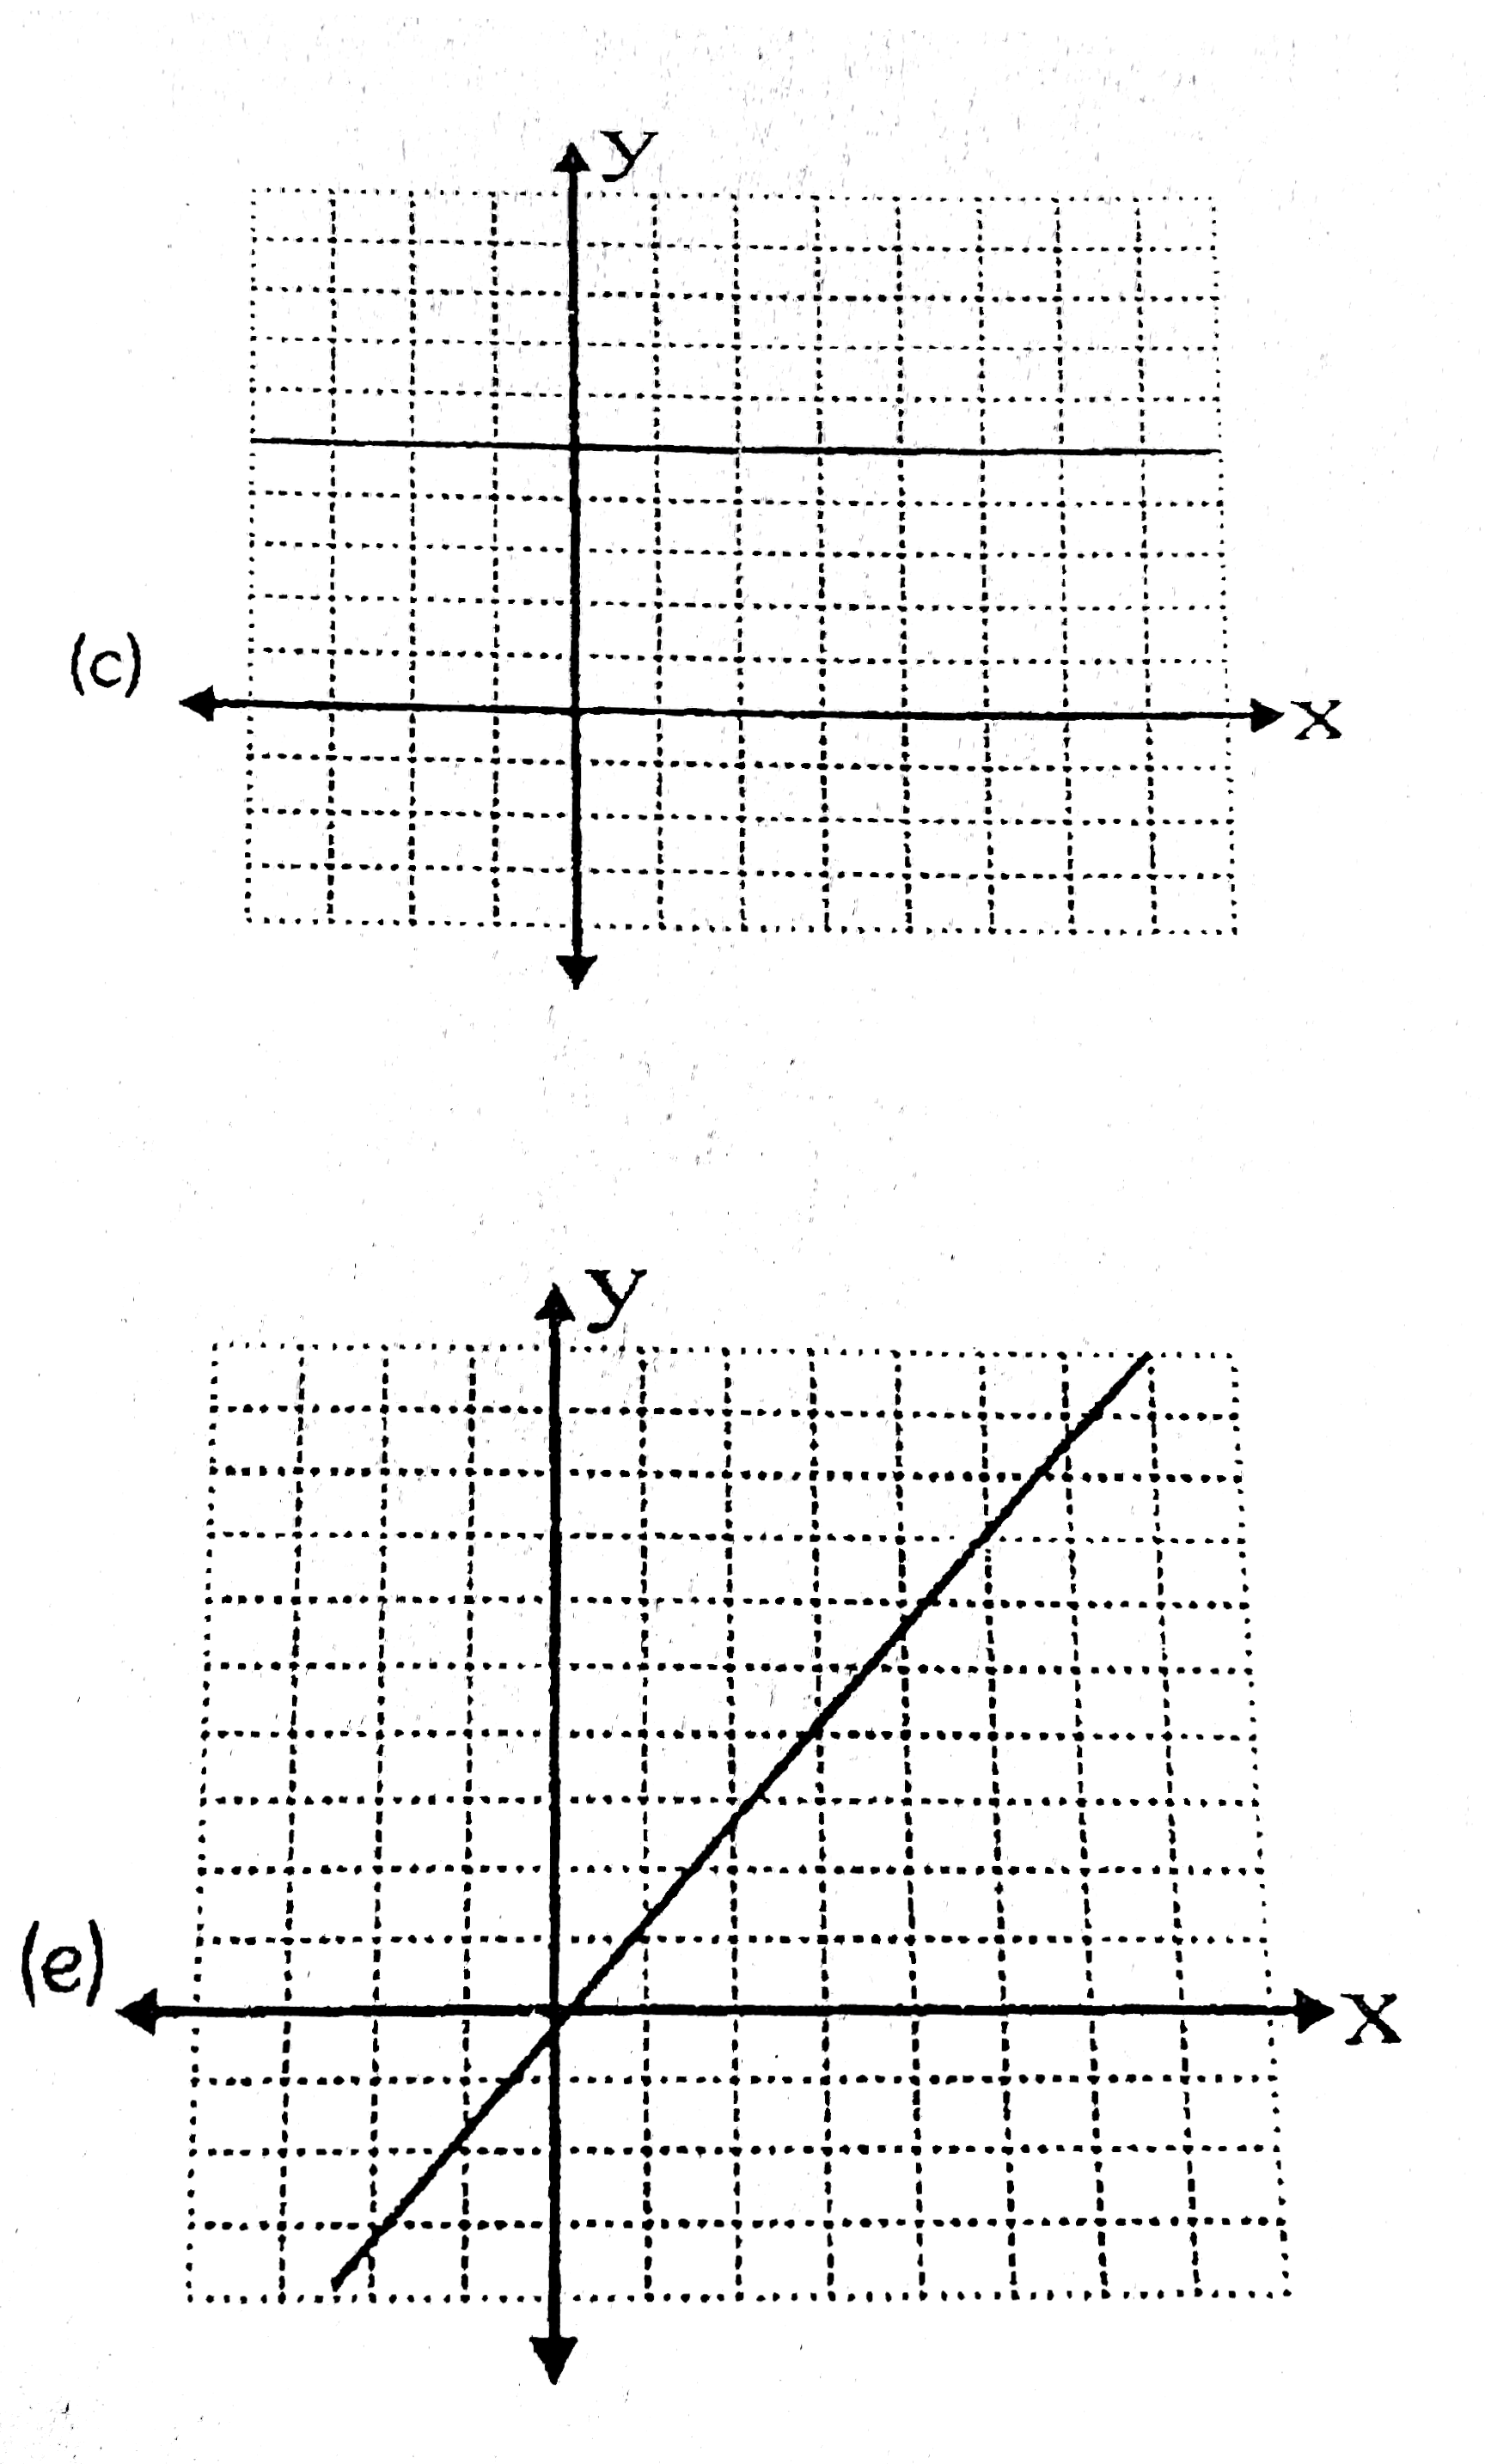
Write equations for the straight lines shown in the following graphs.

Video Solution
Text Solution
(a) y=32x+3, (b) y=32x−2, (c) y=5, (d) y=x+5 (e) y=32x, (f) x=4
|
Topper's Solved these Questions
- MISCELLANEOUSBOOK - ALLENCHAPTER - MISCELLANEOUSEXERCISE - Part -II Example
61 Videos
- MISCELLANEOUSBOOK - ALLENCHAPTER - MISCELLANEOUSEXERCISE - Part -II Example Some worked out Examples
1 Videos
- KINEMATICS (MOTION ALONG A STRAIGHT LINE AND MOTION IN A PLANE)BOOK - ALLENCHAPTER - KINEMATICS (MOTION ALONG A STRAIGHT LINE AND MOTION IN A PLANE)EXERCISE - BEGINNER S BOX-7
8 Videos
- PHYSICAL WORLD, UNITS AND DIMENSIONS & ERRORS IN MEASUREMENT BOOK - ALLENCHAPTER - PHYSICAL WORLD, UNITS AND DIMENSIONS & ERRORS IN MEASUREMENT EXERCISE - EXERCISE-IV
8 Videos
Similar Questions
Knowledge Check
The displacement time graph of a particle executing S.H.M. (in straight line) is shown. Which of the following statements is true?
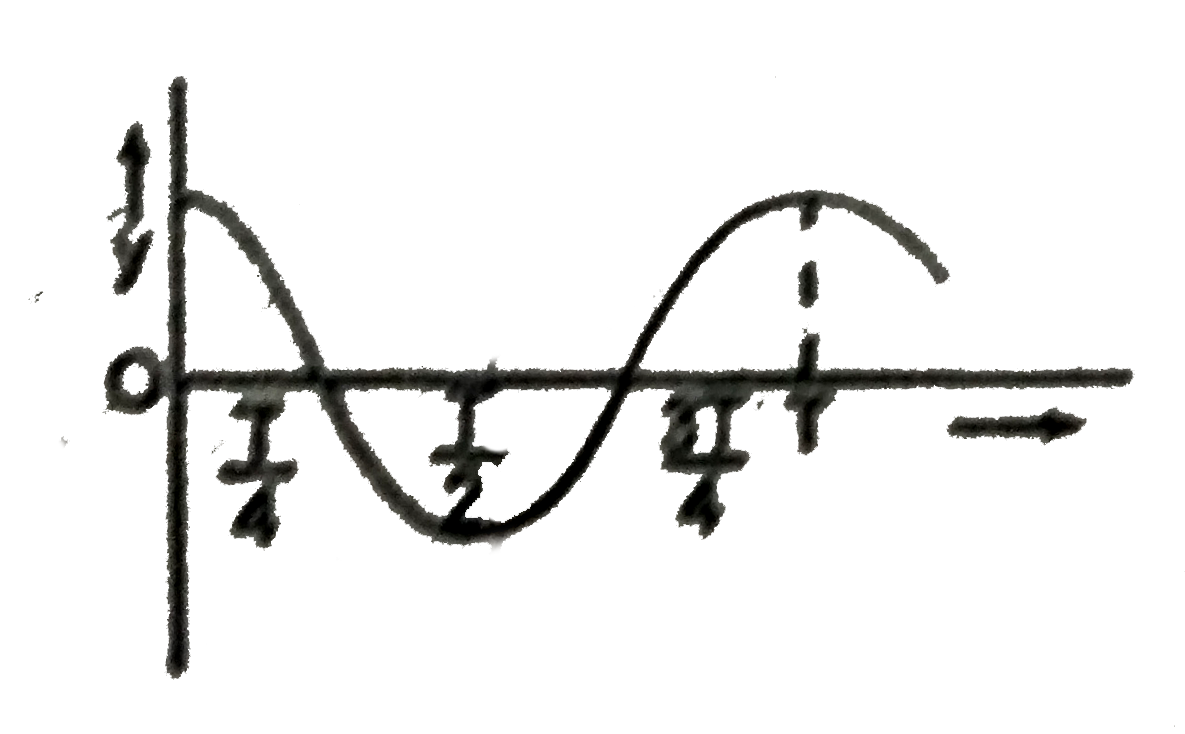 Athe velocity is maximum at t=T/2Bthe acceleration is zero at t=TCthe force is maximum at t=3T/4Dthe potential energy the total oscillation energy at t=T/2
The velocity-time graph of a body moving in a straight line is shown below:

Which one of the following represents its acceleration time graph?A B
B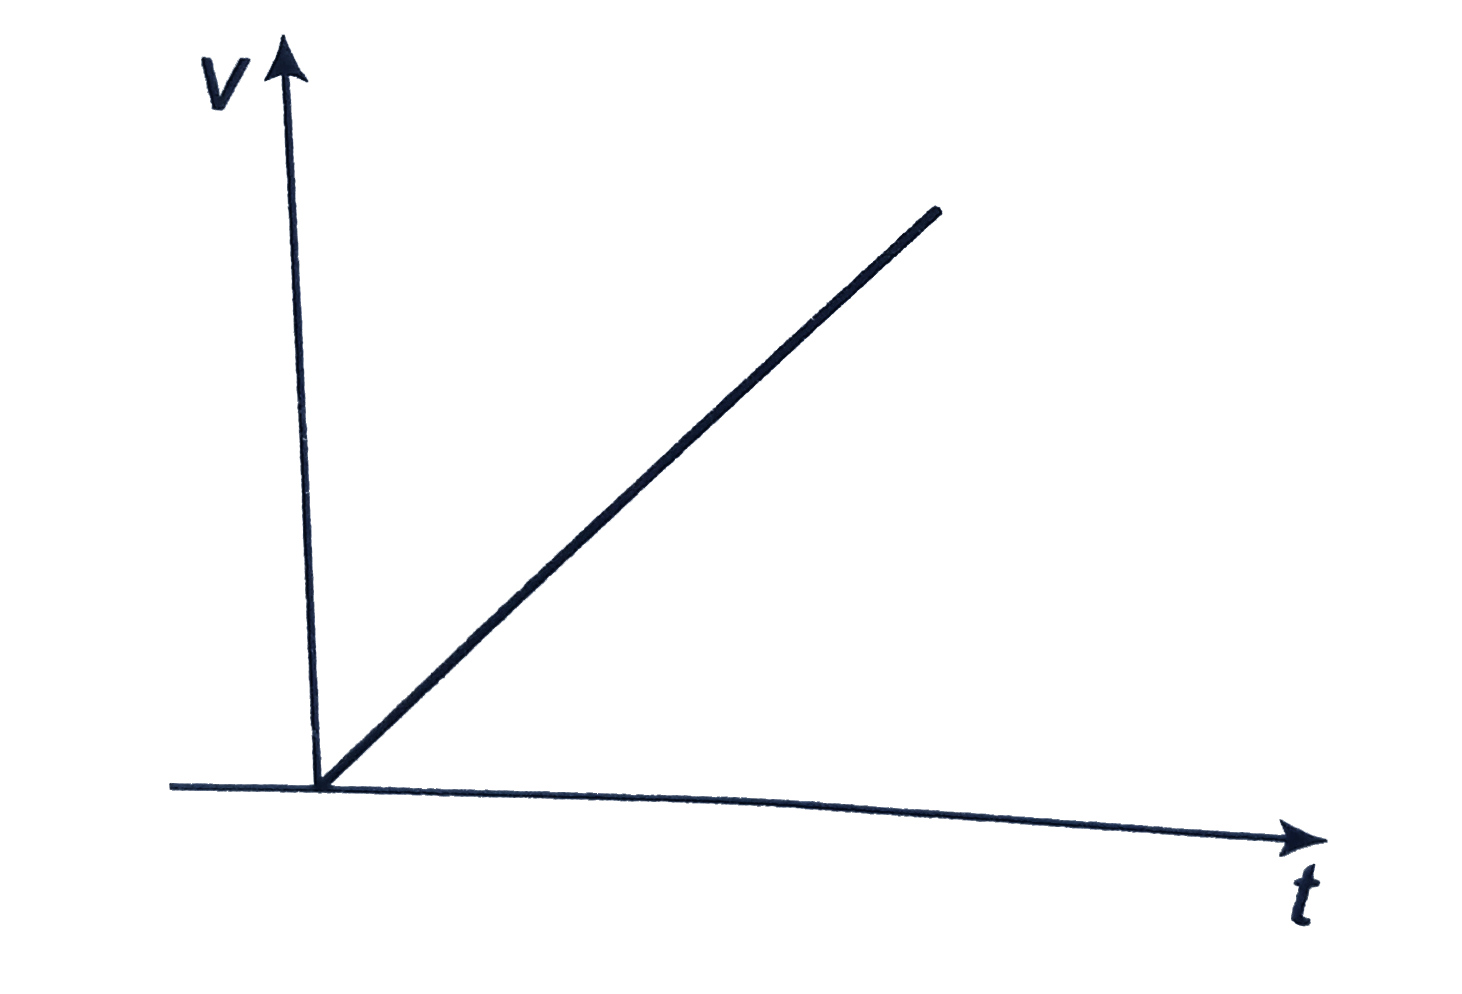 C
C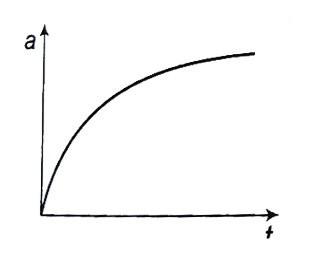 D
D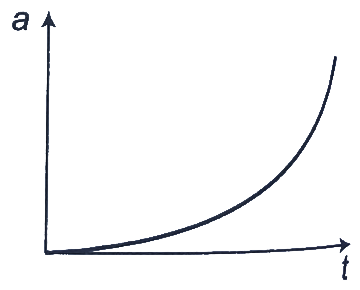
The v-x graph for a particle moving along a straight line is shown in the figure. At which of the points marked, the acceleration is negative?
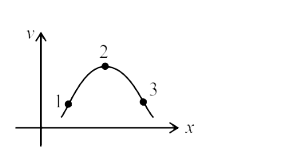 A1B3C1 and 2D3 and 2
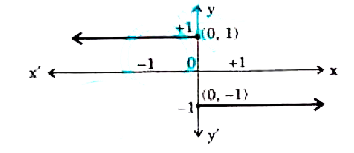
The equation of the graph shown here is
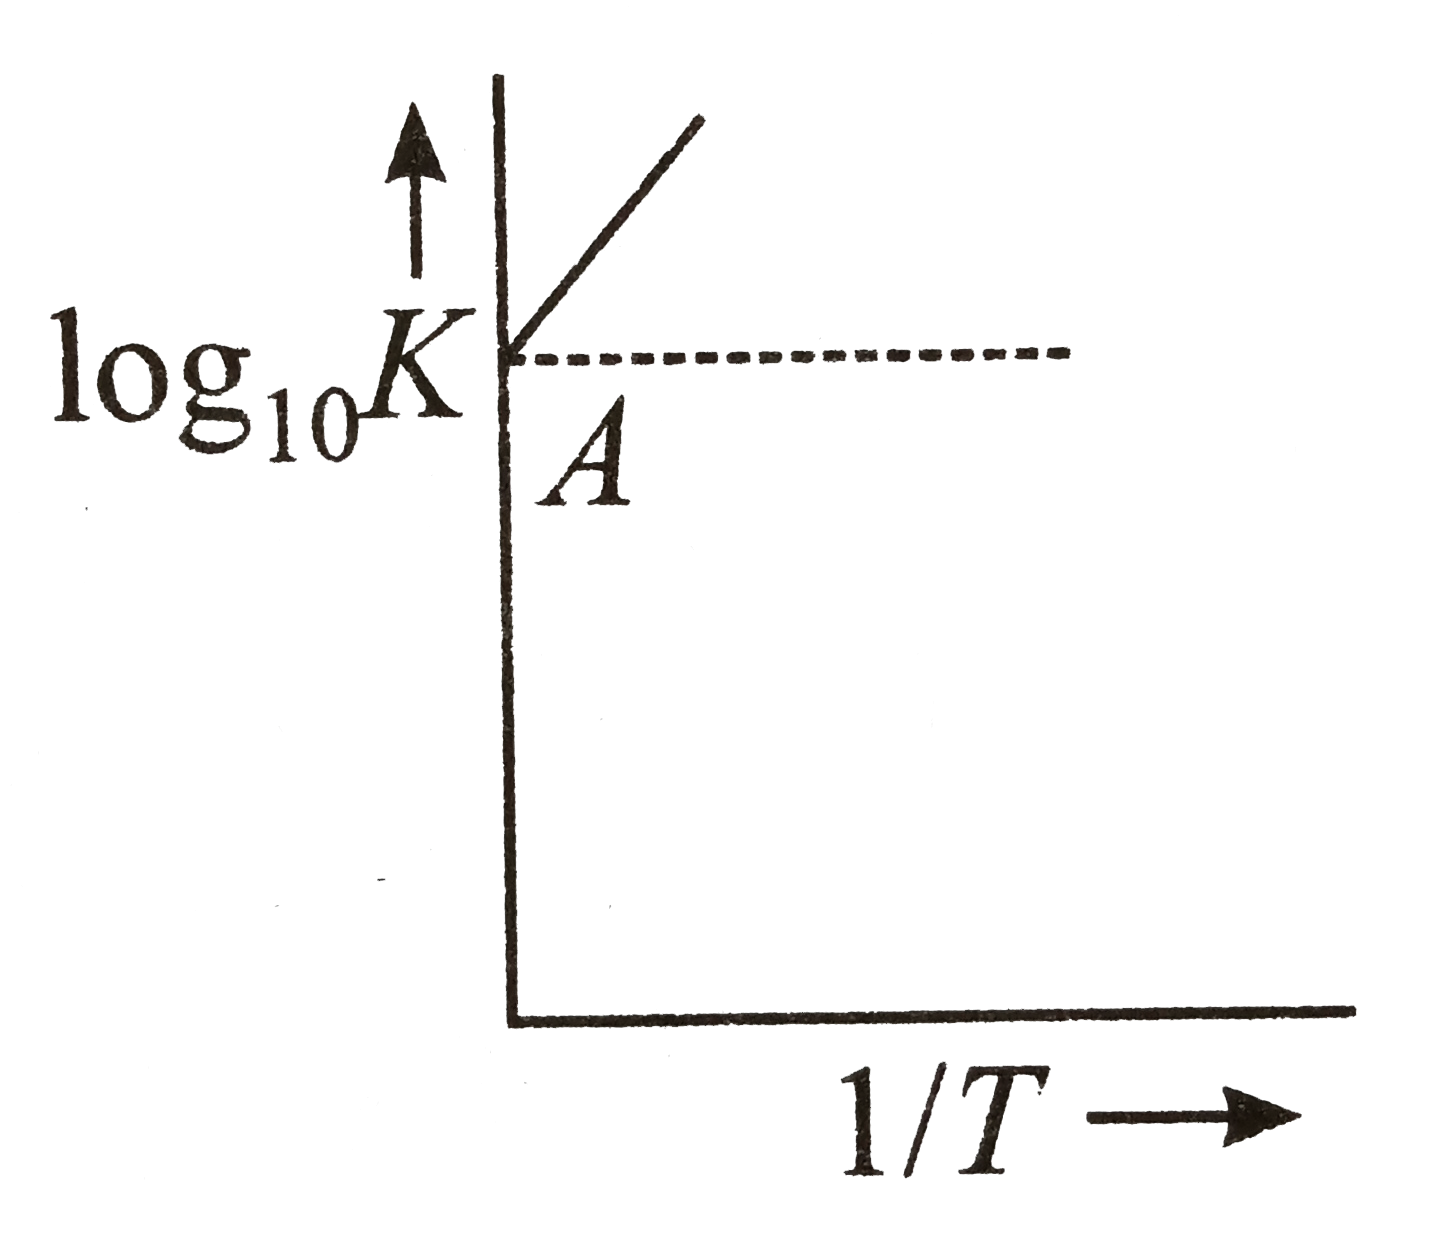
View SolutionVariation of log10K with 1T is shown by the following graph in which straight line is at 45∘ , hence ΔH∘ is:
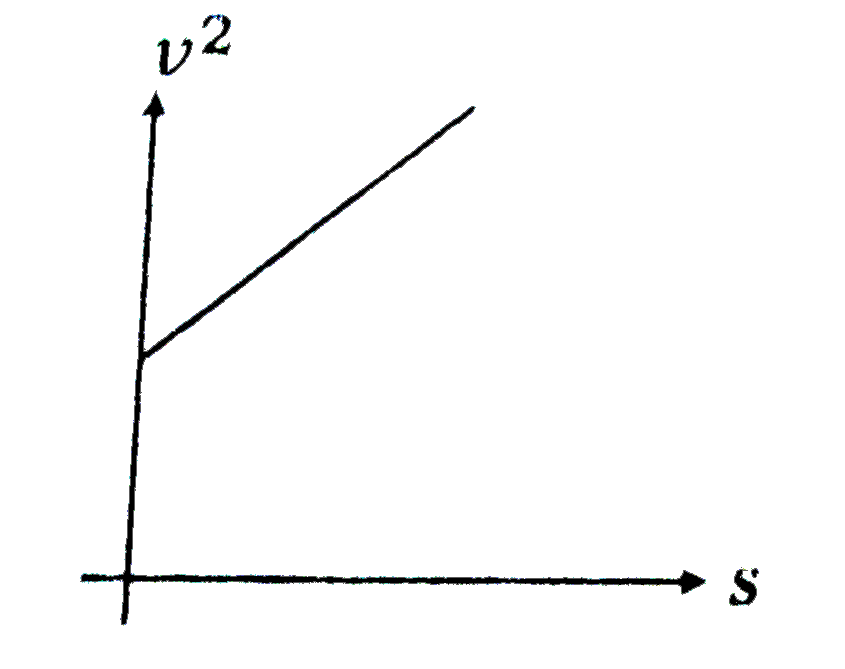
View Solutionv2 versus s-graph of a particle moving in a straight line is shown in the figure. From the graph some conculsions are drawn. State which statement is wrong ?
View SolutionThe x-t graph of a particle moving along a straight line is shown in figure

The v-t graph of the particle is correctly shown by
View SolutionThe x−t graph of particle moving along a straight line is shown in figure
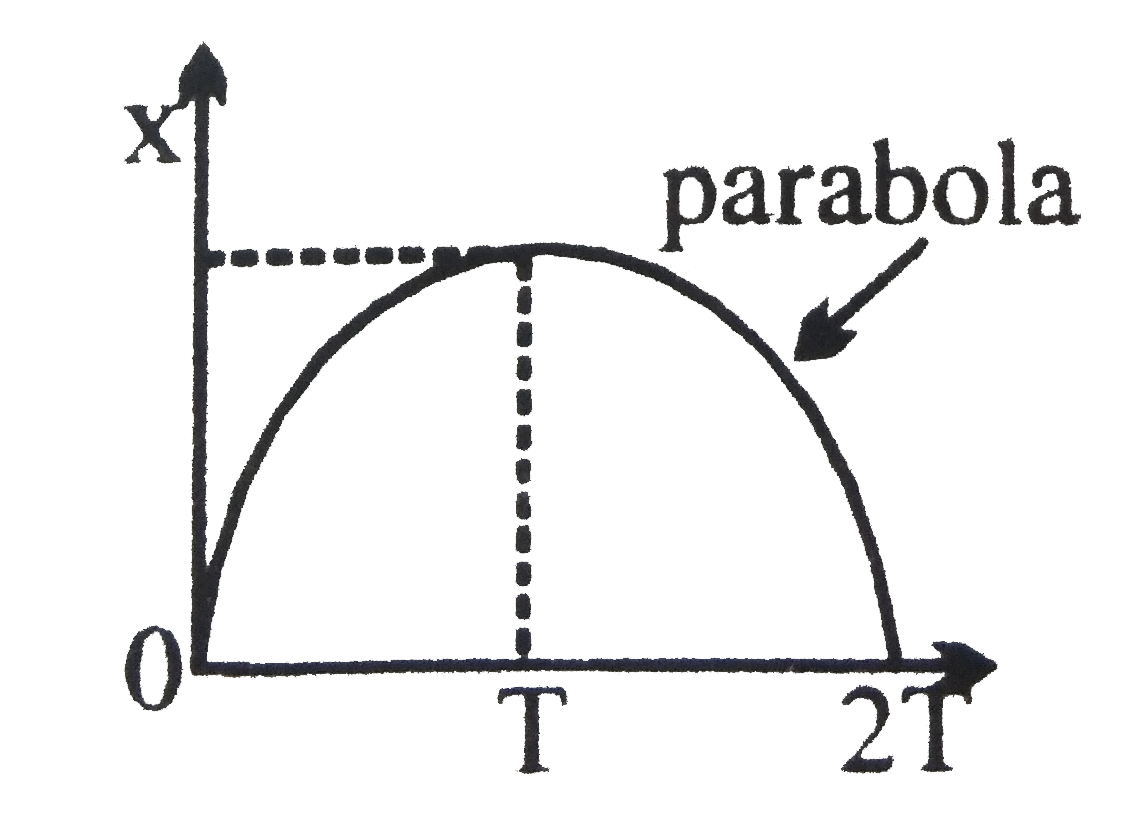
The v−t graph of the particles is correctly shown by
View Solution

