On the recently discovered 10th planet it has been found that the gases follow the relationship PeV/2=nCT where C is constant other notation are as usual( V in lit.,P in atm andTinKelvin) . A curve is plotted between P and V at 500 K & 2 moles of gas as shown in figure.
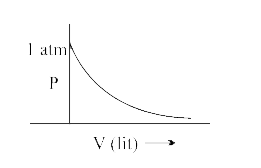
If a closed container of volume 200 lit. of O2 gas ( ideal gas ) at 1 atm& 200K is taken to planet.Find the pressure of oxygen gas at the planet at 821 K in same container
10e100
20e50
1 atm
2 atm
The correct Answer is:A
Topper's Solved these Questions
- GASEOUS STATE BOOK - MOTIONCHAPTER - GASEOUS STATE EXERCISE - EXERCISE-3
55 Videos
- GASEOUS STATE BOOK - MOTIONCHAPTER - GASEOUS STATE EXERCISE - EXERCISE-4( LEVEL-I)
15 Videos
- GASEOUS STATE BOOK - MOTIONCHAPTER - GASEOUS STATE EXERCISE - EXERCISE-2(LEVEL-I)
48 Videos
- ELECTROCHEMISTRYBOOK - MOTIONCHAPTER - ELECTROCHEMISTRYEXERCISE - EXERCISE-4,II
44 Videos
- GOCBOOK - MOTIONCHAPTER - GOCEXERCISE - Exercise - 4 Level - II
14 Videos
Similar Questions
Knowledge Check
On the recently discovered 10th planet it has been found that the gases follow the relationship PeV/2=nCT where C is constant other notation are as usual( V in lit.,P in atm andTinKelvin) . A curve is plotted between P and V at 500 K & 2 moles of gas as shown in figure.
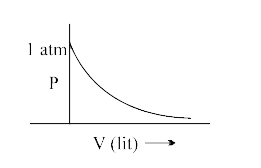
The value of constant C isA0.01B0.001C0.005D0.002On the recently discovered 10th planet it has been found that the gases follow the relationship PeV/2=nCT where C is constant other notation are as usual( V in lit.,P in atm andTinKelvin) . A curve is plotted between P and V at 500 K & 2 moles of gas as shown in figure.
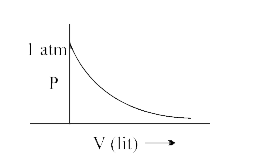
Find the slope of the curve plotted between P Vs T for closed container of volume 2 lit. having same moles of gasAe2000B2000 eC500 eD21000eFor V versus T curves at constant pressure P1andP2 for and ideal gas shown in figure-
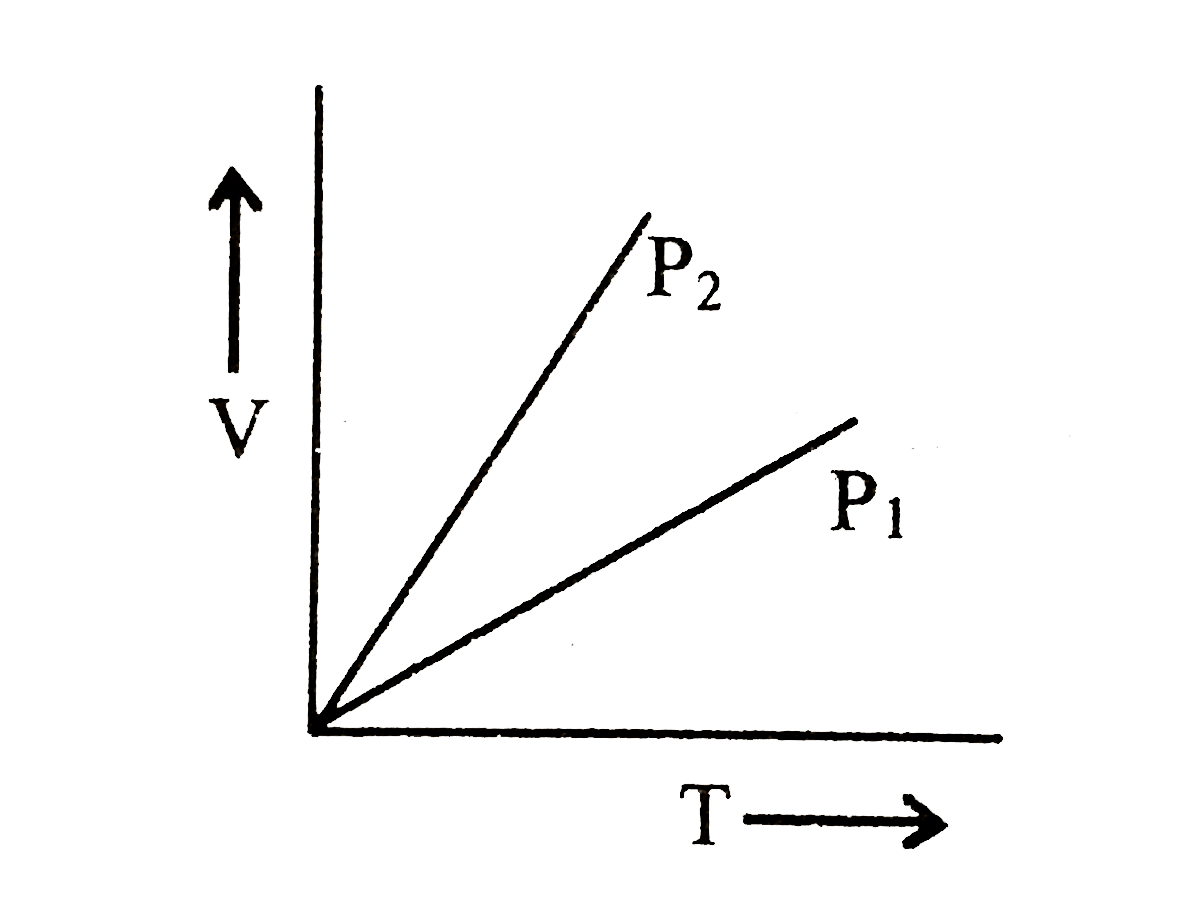 AP1>P2BP1<P2CP1=P2DP1P2
The slope of 'P' v/s T plot at constant volume for a fixed amount of an ideal gas aus 0.01atm/K. Then what will be the value of pressure of gas (In atm) at 300K temperature ?
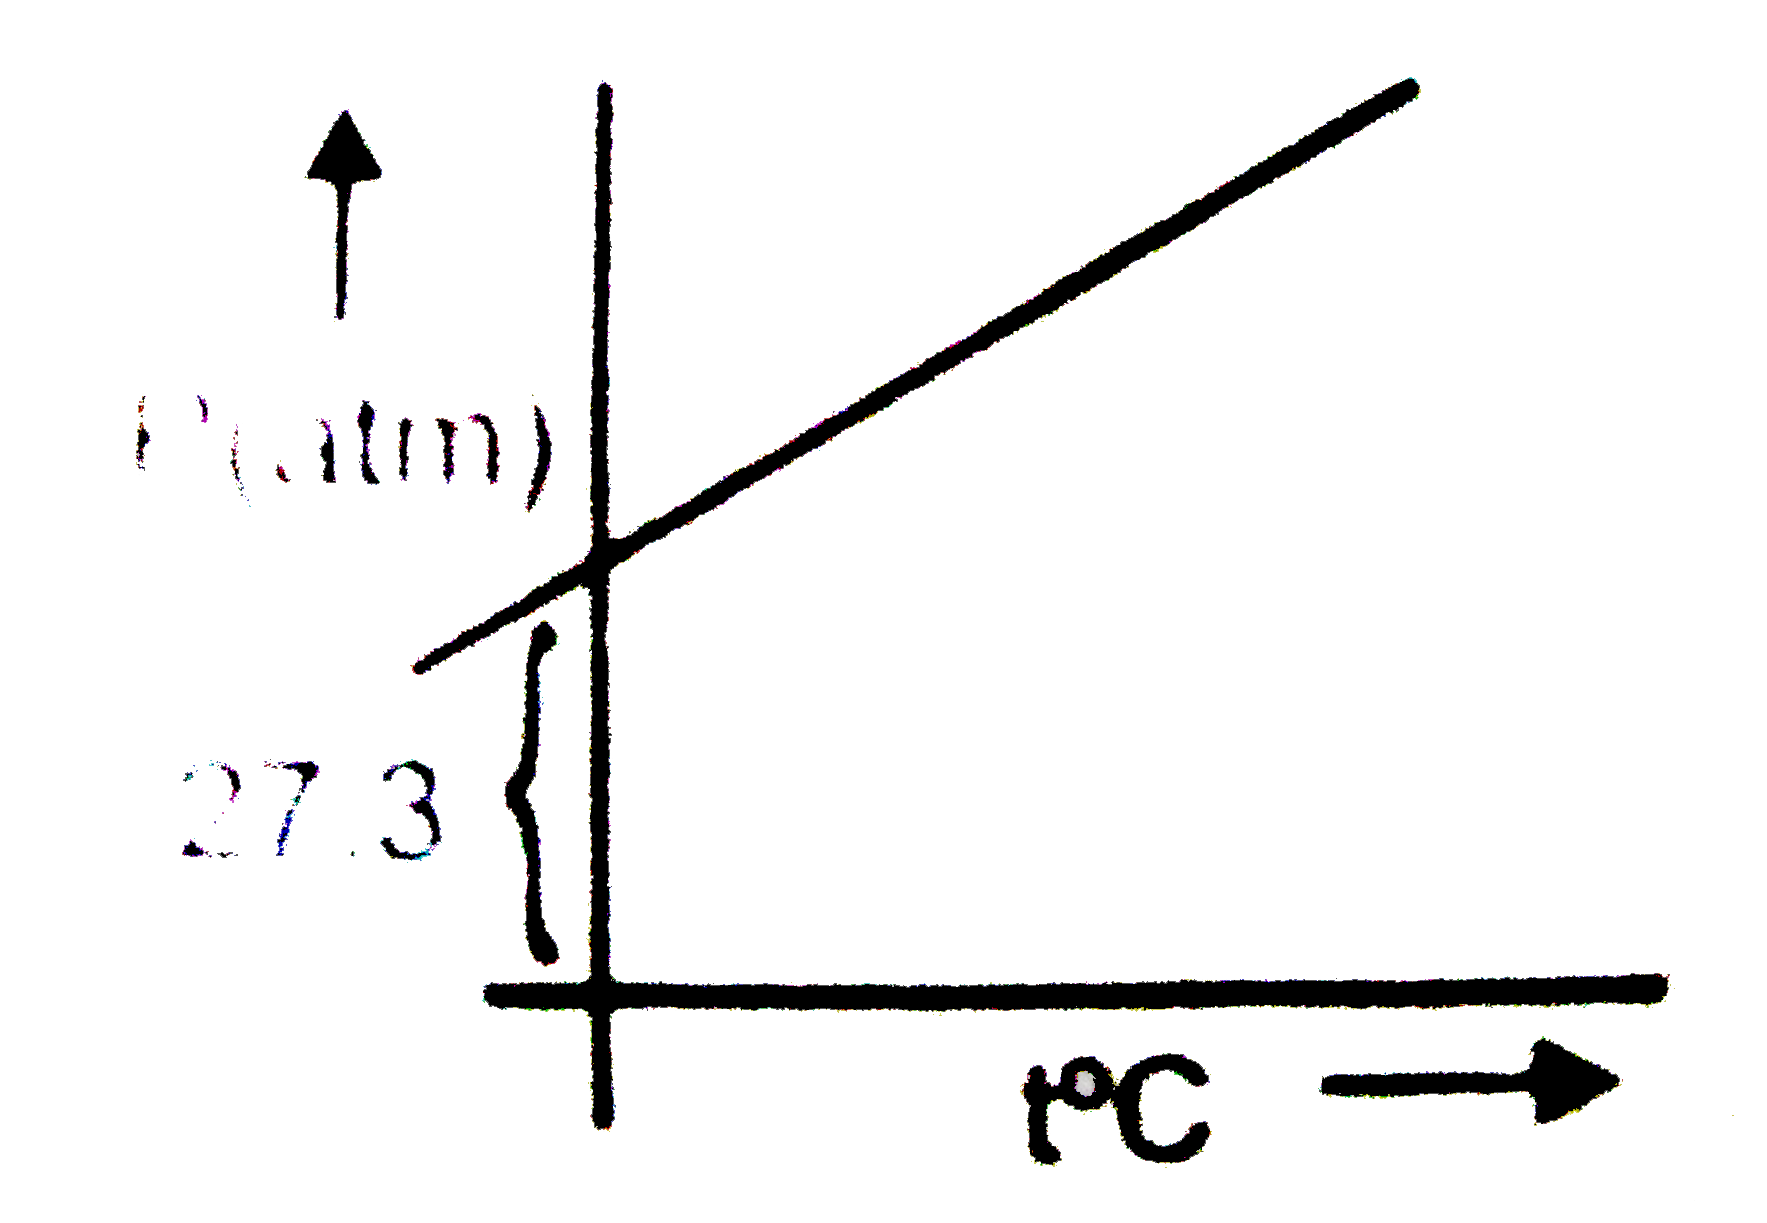
View SolutionA graph is plotted between p (atm) vs t∘C for 10 mol of an ideal gas as follows:
Then slope of curve and volume of container (L) respectively, are:
View SolutionV vs T curves at constant pressure P1 and P2 for an ideal gas are shown in the figure. Which of the following is correct?

View SolutionA graph is plotted between p (atm) vs t∘C for 10 mol of an ideal gas as follows:
Then slope of curve and volume of container (L) respectively, are:

View SolutionThe intercept on y-axis and slope of curve plotted between P/T vs. T
( For an ideal gas having 10 moles in a closed rigid container of volume 8.21 L. (P= Pressure in atm and T = Temp. in K, log102=0.30)) are respectively :
View Solution
