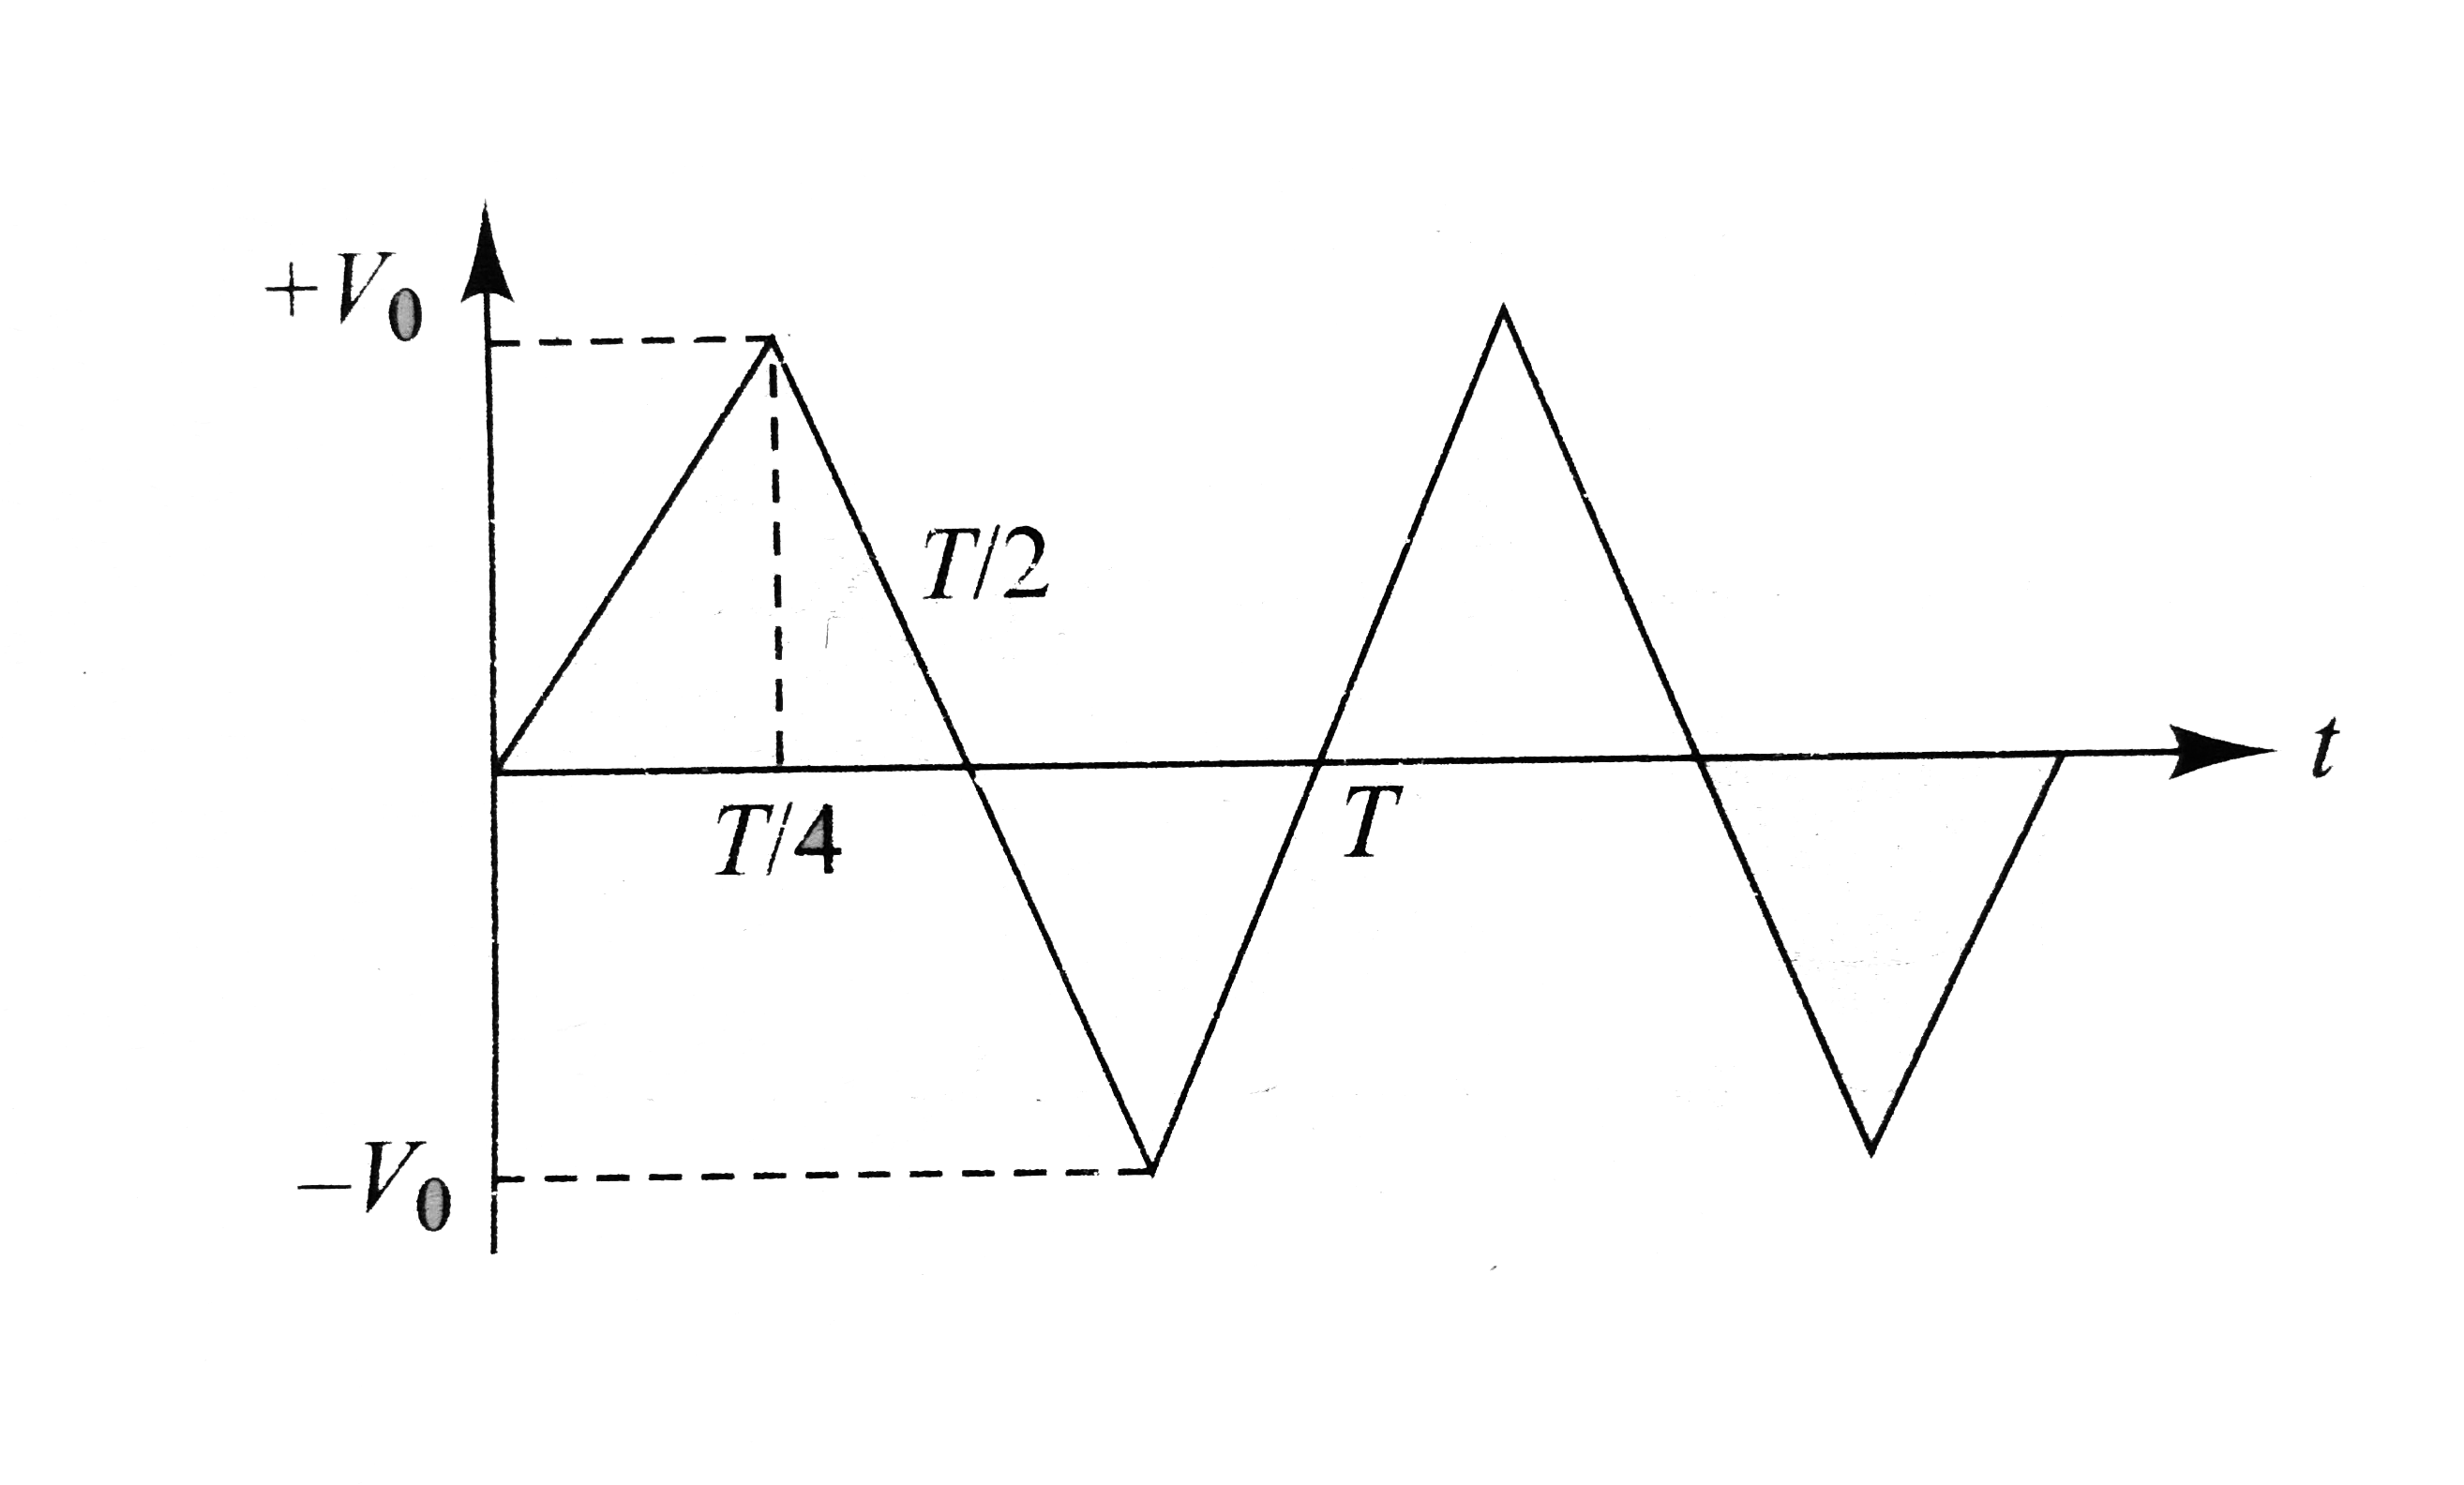
The voltage time (V-t) graoh for triangular wave having peak value (V0) is as shown in fig.
V03
V02
V0√2
V0√3
The correct Answer is:D
Step by step video, text & image solution for The voltage time (V-t) graoh for triangular wave having peak value (V_0) is as shown in fig. by Physics experts to help you in doubts & scoring excellent marks in Class 12 exams.
Topper's Solved these Questions
Similar Questions
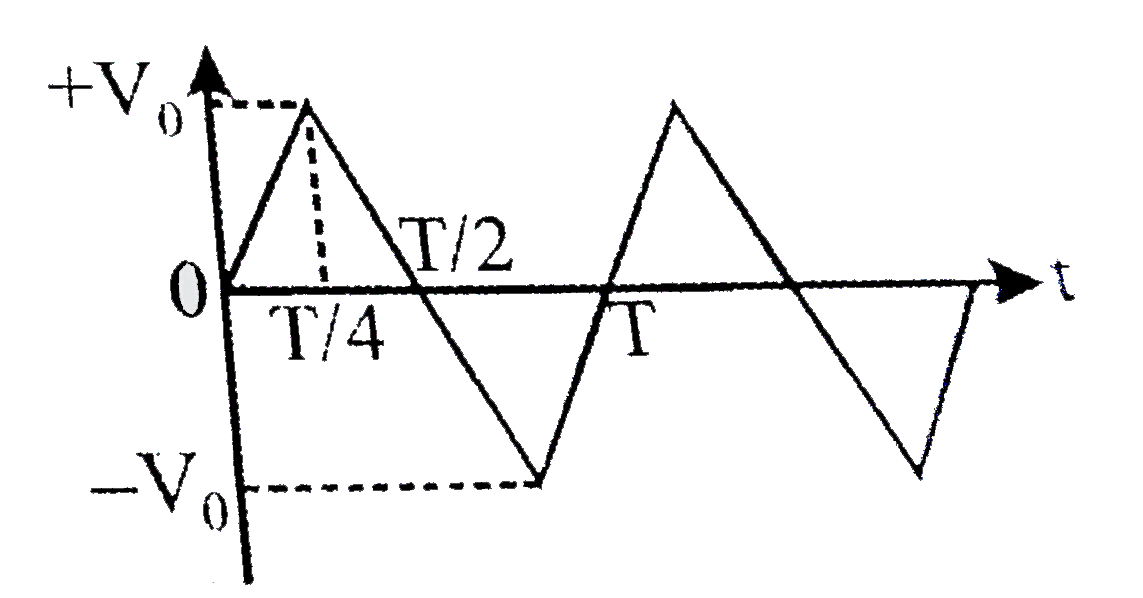
The voltage time (V-t) graph for triangular wave having peak value V0 is as shown in figure.The rms value of V in time interval from t=0 to T/4 is
 View Solution
The voitage time (V−t) graph for triangular wave having peak value V0 is as shown in the figare. The rins value of V in time interval from t=0 to T4 is Y0√n. Find n.
'(##CEN_KSR_PHY_JEE_C24_E01_006_Q03##)'View Solution
Knowledge Check
- Question 1 - Select One
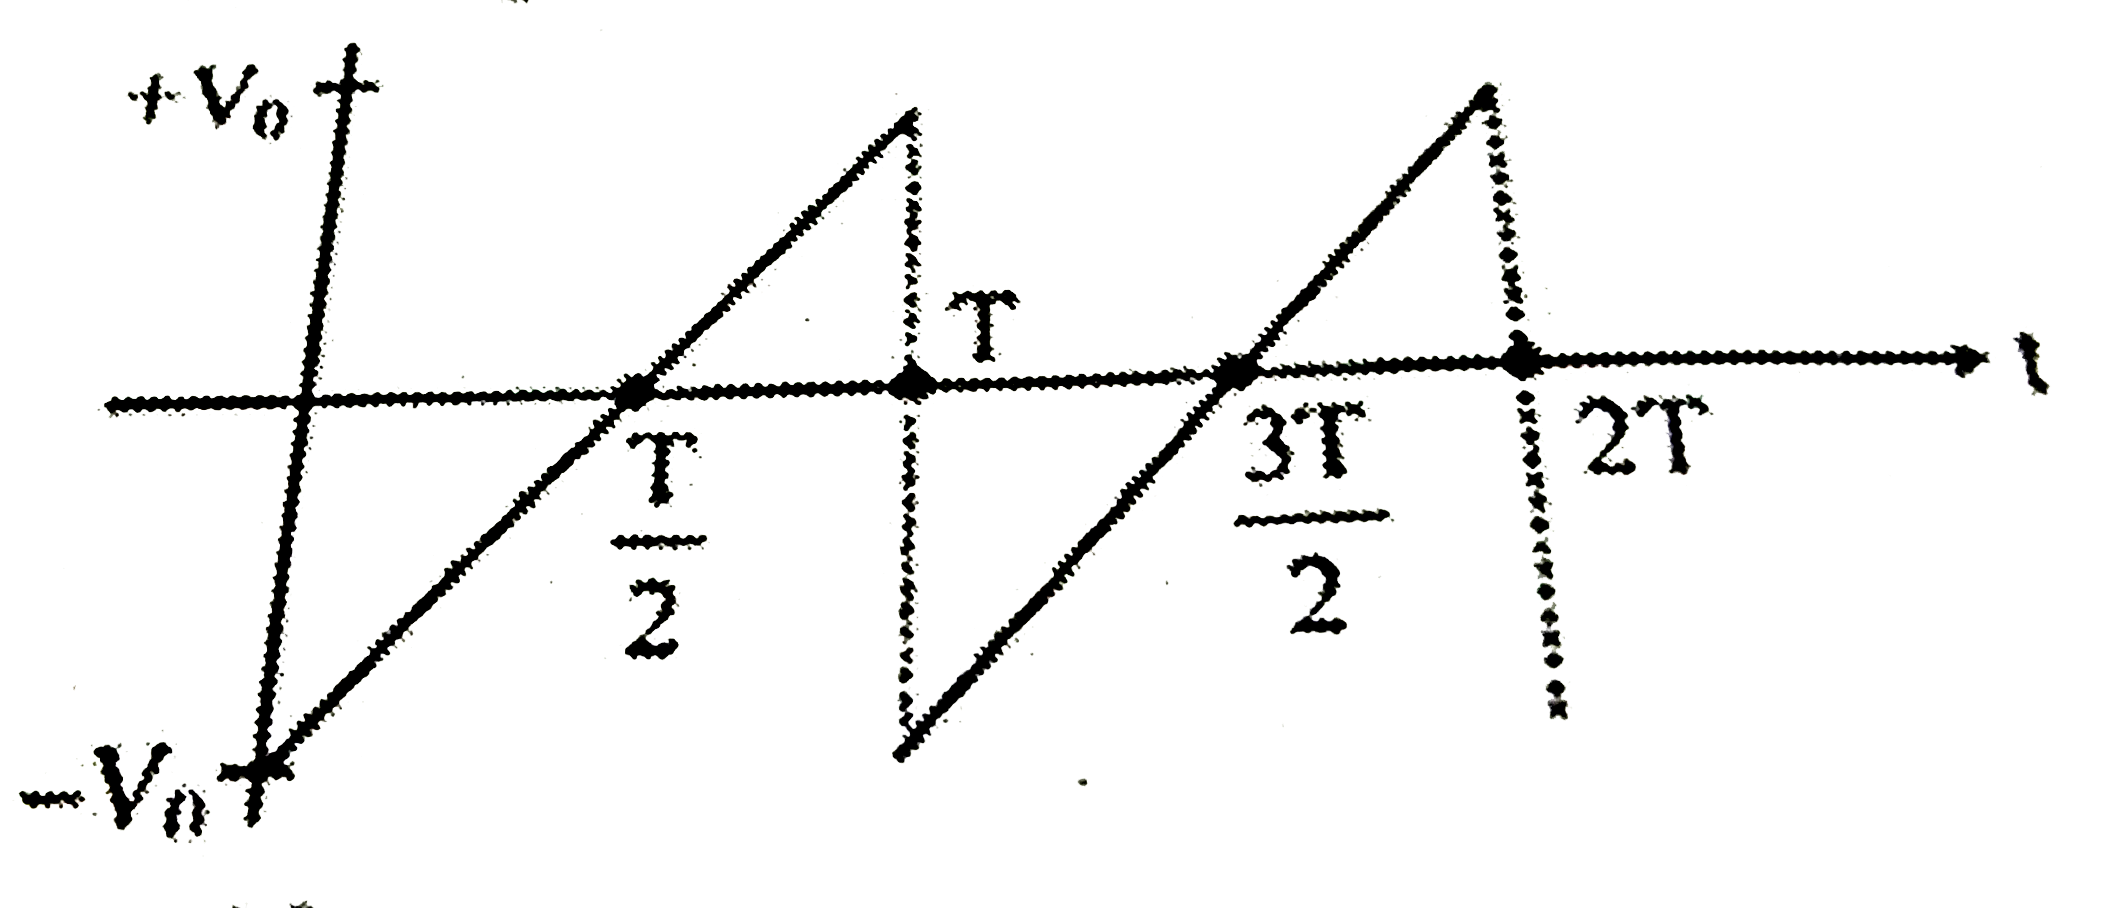
Rms value of the saw-tooth voltage of peak value V0 as shown in-
 AV02BV0√2CV03DV0√3
 - Question 2 - Select One
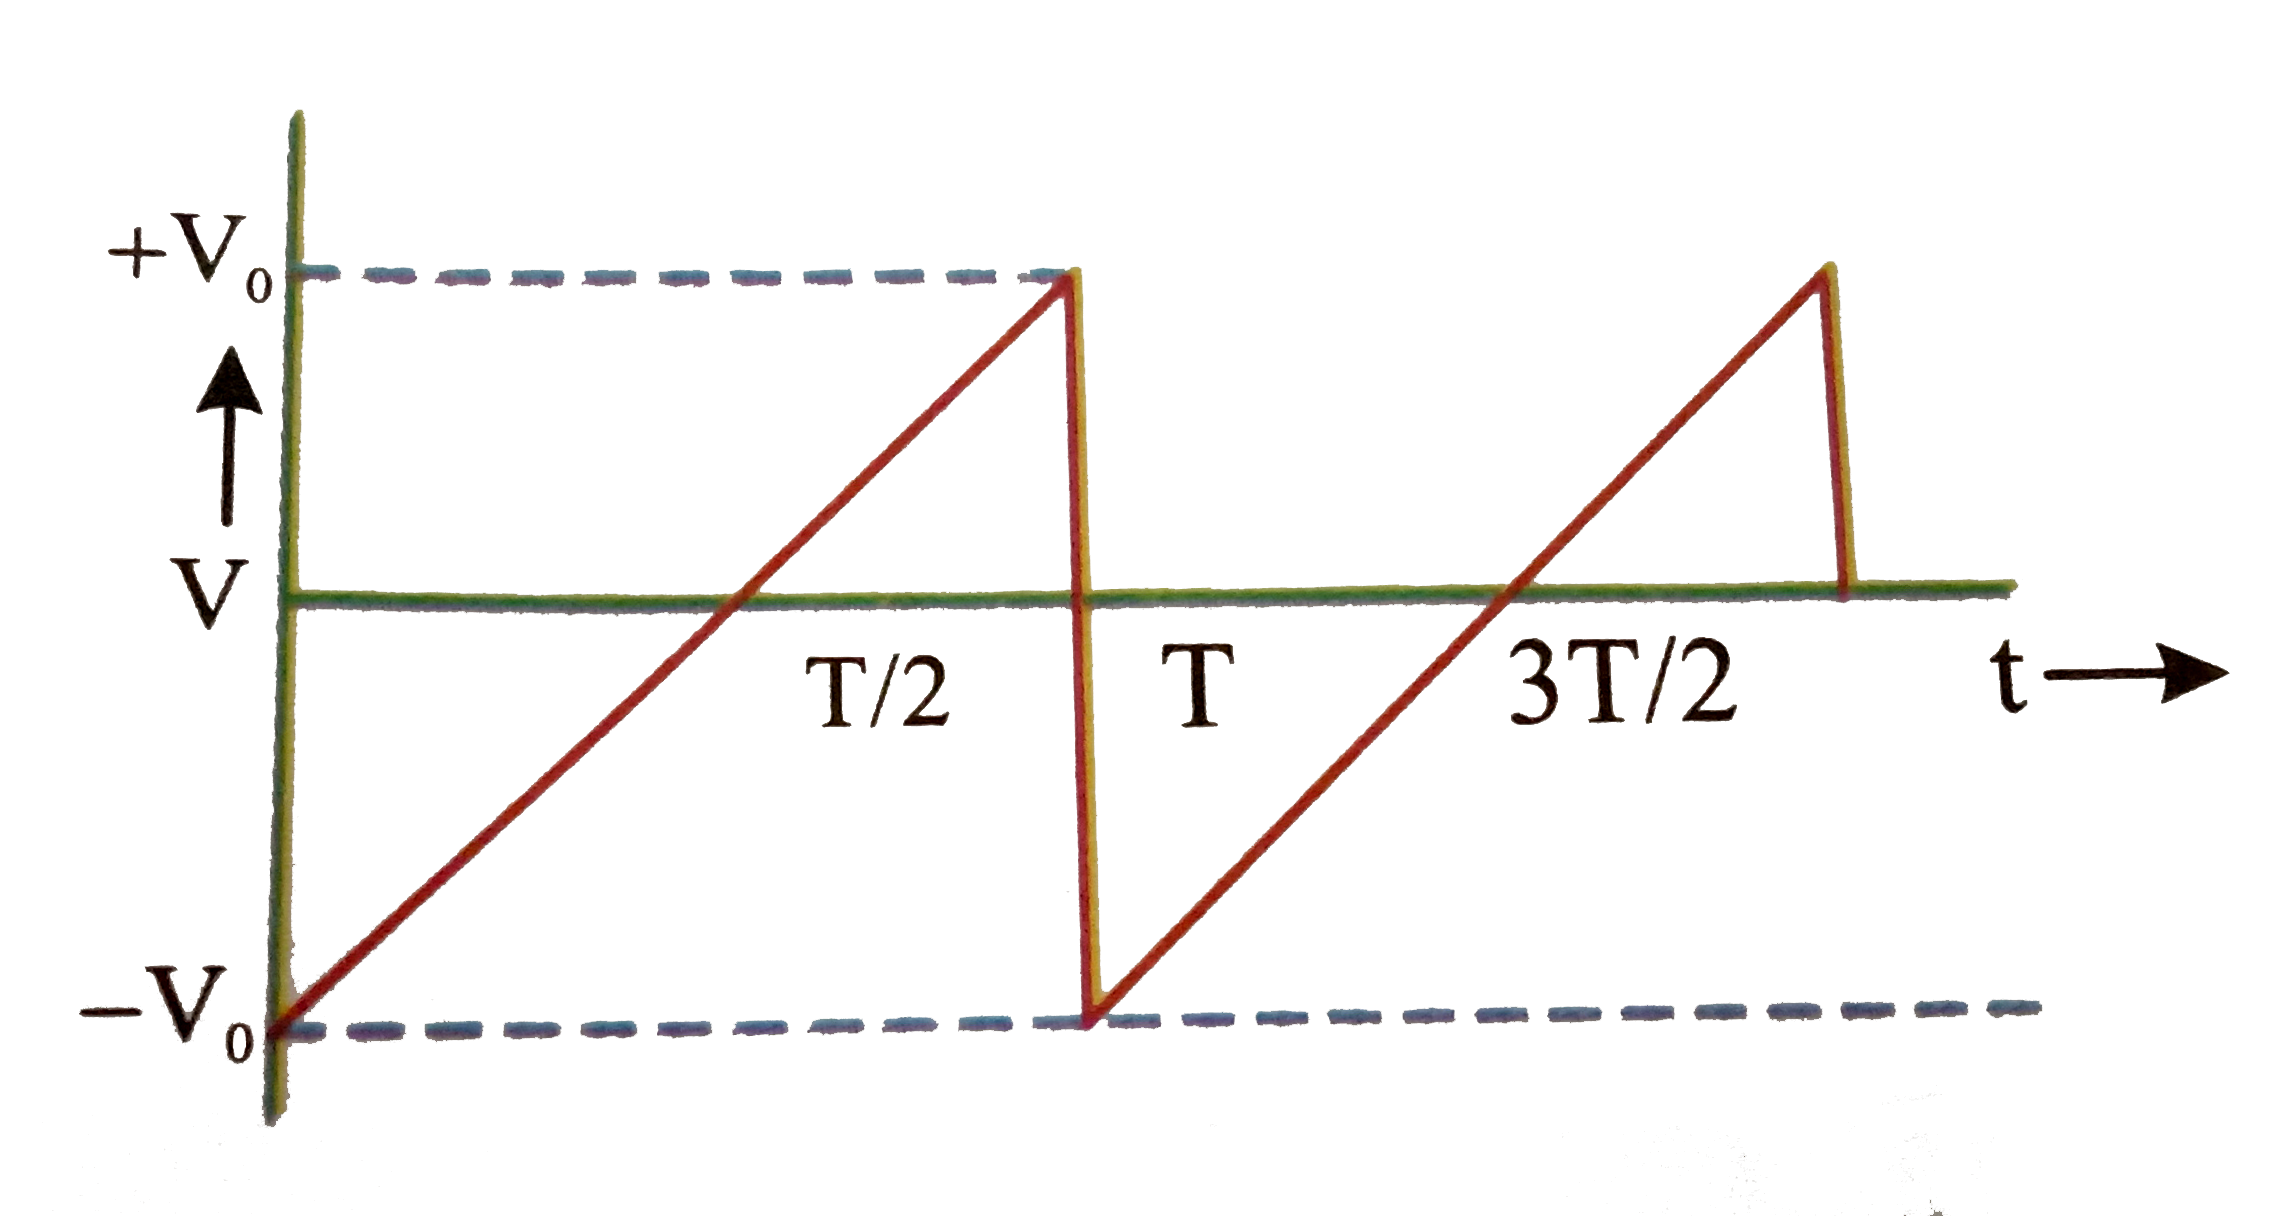
The average value for the saw-tooth voltage of peak value of V0 over half the cycle as shown in figure is
 AV0√3BV0√2C2V03DV03
 - Question 3 - Select One or More
A time varying voltage V= 2t (Volt) is applied across and ideal inductor of inductance L =2H as shown in Fig. Then (assume current to be zero at t =0)
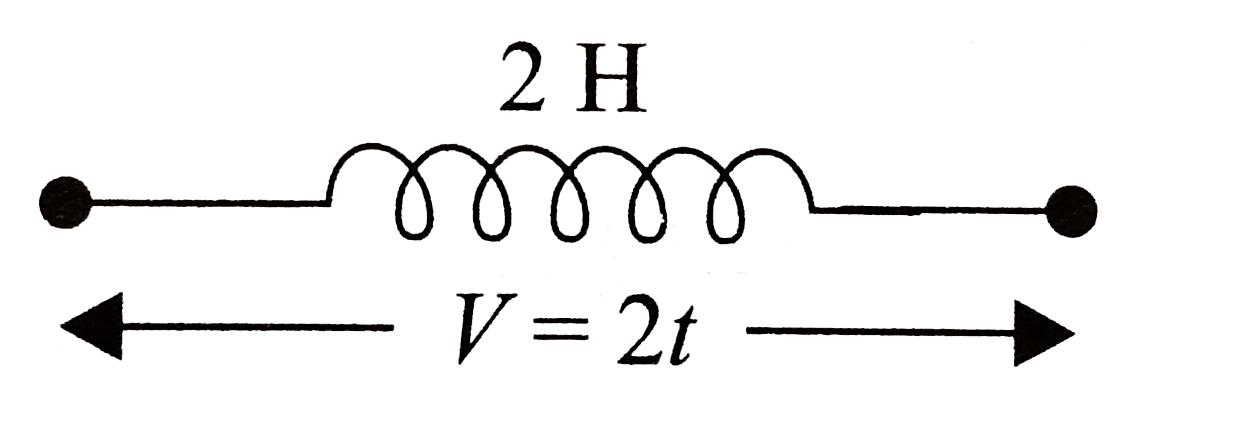 ACurrent versus time graph is a parabolaBenergy stored in magnetic field at t=2sis4J.CPotential energy at time t=1s in magnetic field is increasing at a rate of 1J/sDenergy stored in magnetic field is zero all the time.
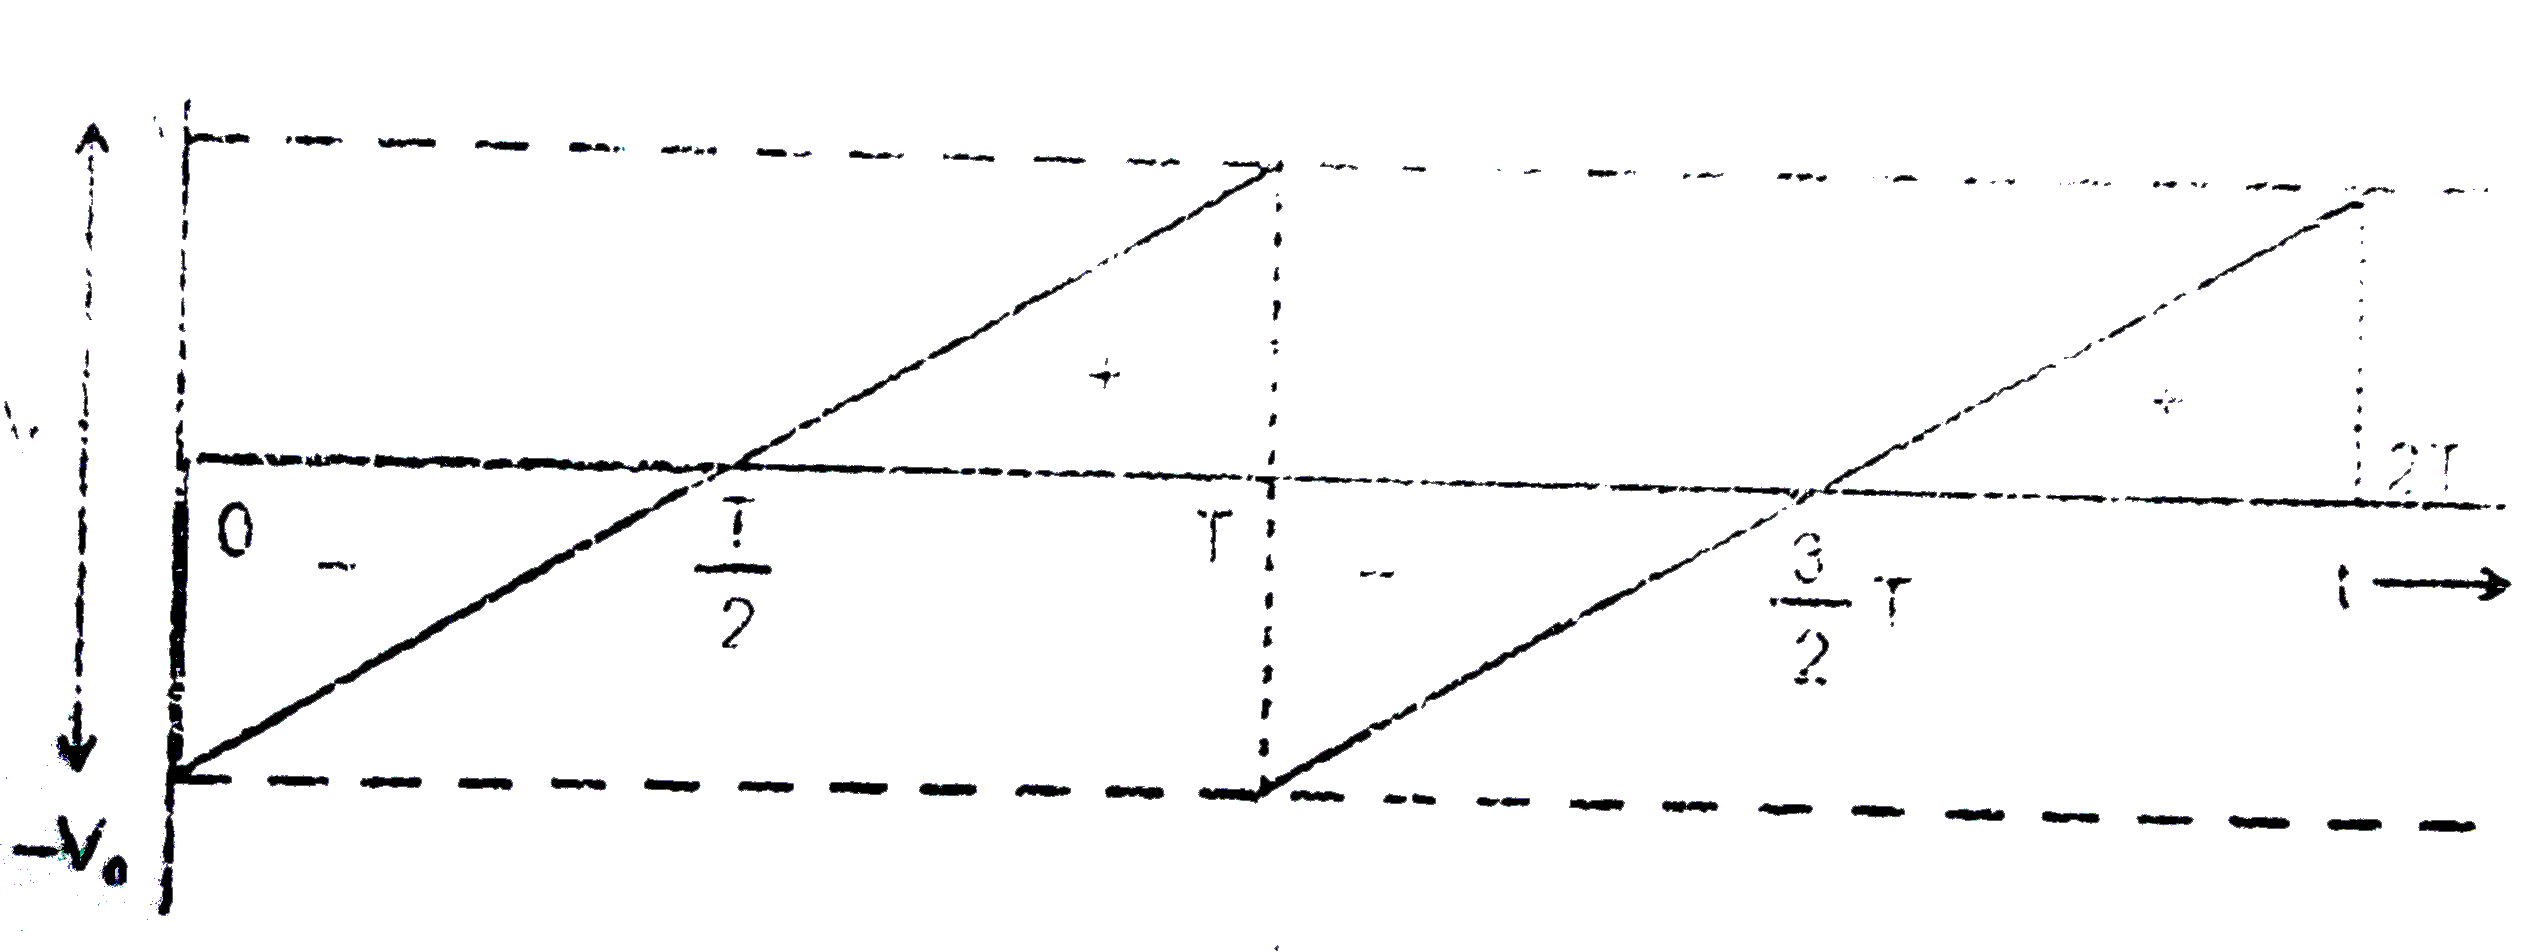
The rms value of the saw-tooth voltage of peak value V0 from t=0 to t=2T as shown in figure is V0√x.Find the value of x.
 View Solution
In the circuit shown in Fig.
if we assume that when the input voltage at the base resistance is 5V,VBE is zero and VCE is also zero. What is I,I and beta?
When the input is zero, then I is zero. What would be the output wave form if the input wave form is as shown in Fig.View SolutionThe peak voltage in a 220VAC source is
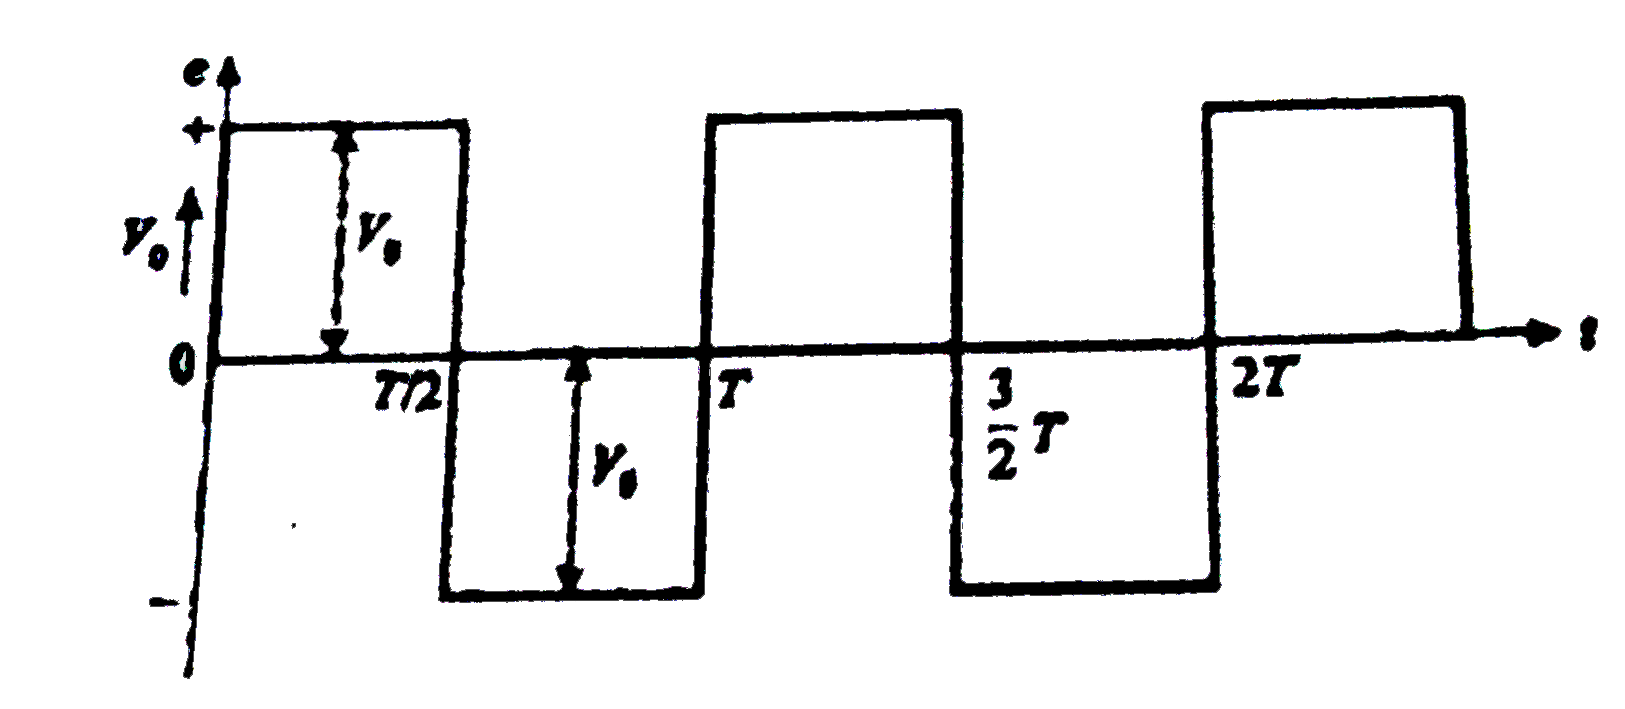
View SolutionThe average and RMS value of voltage for square wave shown in figure-5.254 having peak value V0 are:
 View Solution
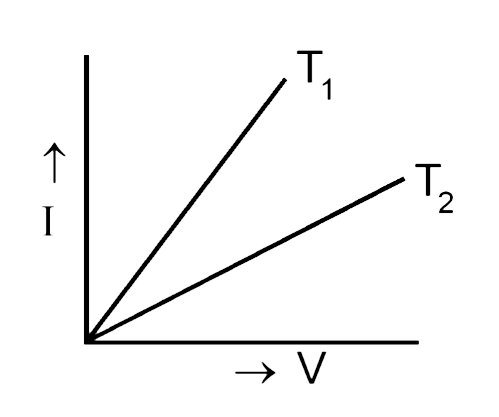
The current (I) and voltage (V) graphs for a given metallic wire at two different temperature (T1) and (T2) are shown in fig. It is concluded that
 View Solution
