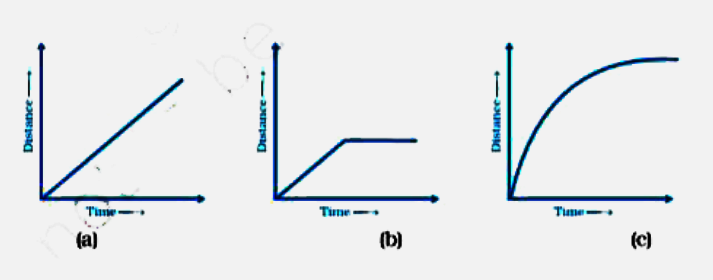
In the graph represent direction of distance (d) vs time (t) ?
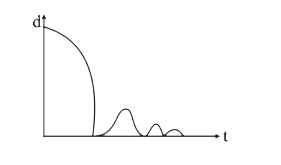
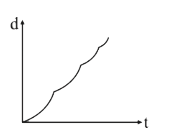
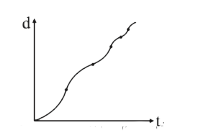
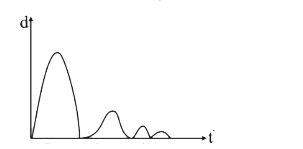
The correct Answer is:C
To solve the problem of determining the correct representation of distance (d) versus time (t) in a graph, we can follow these steps:
1. Understanding Distance vs. Time Graphs:
- A distance vs. time graph shows how the distance traveled by an object changes over time.
- The key point to remember is that distance can only increase or remain constant; it cannot decrease.
2. Analyzing the Options:
- We need to evaluate each option provided in the question to see if they correctly represent the relationship between distance and time.
3. Evaluating Option A:
- In this option, the graph shows a decrease in distance at some point as time increases.
- Since distance cannot decrease, this option is incorrect.
4. Evaluating Option B:
- This option shows an increase in distance initially, but then it flattens out, suggesting that the object reaches a maximum height and stops moving for a moment.
- Although the distance does not decrease, the flat part indicates that the object is not moving, which can be misleading in terms of distance covered.
- This option is also incorrect because it implies a moment of no distance change.
5. Evaluating Option C:
- This option shows a continuous increase in distance as time progresses.
- Since distance is always increasing or remaining constant, this option correctly represents the relationship between distance and time.
- Therefore, Option C is the correct choice.
6. Final Conclusion:
- Based on the analysis, the correct representation of distance vs. time is given by Option C, where the distance always increases as time progresses.
- A distance vs. time graph shows how the distance traveled by an object changes over time.
- The key point to remember is that distance can only increase or remain constant; it cannot decrease.
- We need to evaluate each option provided in the question to see if they correctly represent the relationship between distance and time.
- In this option, the graph shows a decrease in distance at some point as time increases.
- Since distance cannot decrease, this option is incorrect.
- This option shows an increase in distance initially, but then it flattens out, suggesting that the object reaches a maximum height and stops moving for a moment.
- Although the distance does not decrease, the flat part indicates that the object is not moving, which can be misleading in terms of distance covered.
- This option is also incorrect because it implies a moment of no distance change.
- This option shows a continuous increase in distance as time progresses.
- Since distance is always increasing or remaining constant, this option correctly represents the relationship between distance and time.
- Therefore, Option C is the correct choice.
- Based on the analysis, the correct representation of distance vs. time is given by Option C, where the distance always increases as time progresses.
Similar Questions
Given below is the distance vs time graph d=5t , where d is distance and t is time. Read the graph carefully and answer the questions given below:
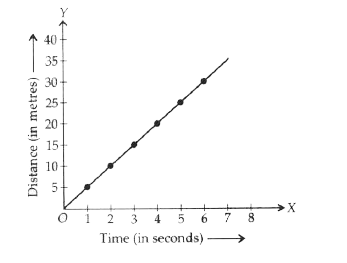
Find the distance covered when time is 3 sec.
(ii) Find the distance covered in 5 seconds.
(iii) Find the time in which the body covered 30 m.View SolutionExplain the situations represented by the following distance-time graphs.
 View Solution
Knowledge Check
- Question 1 - Select One
Which of the following graphs represents the displacement (s) -time (t) graph for uniform motion ?
A B
B C
C D
D
- Question 2 - Select One
Which of the following x-t graphs represents the distance-time variation of a body released from the top of a buiding?
A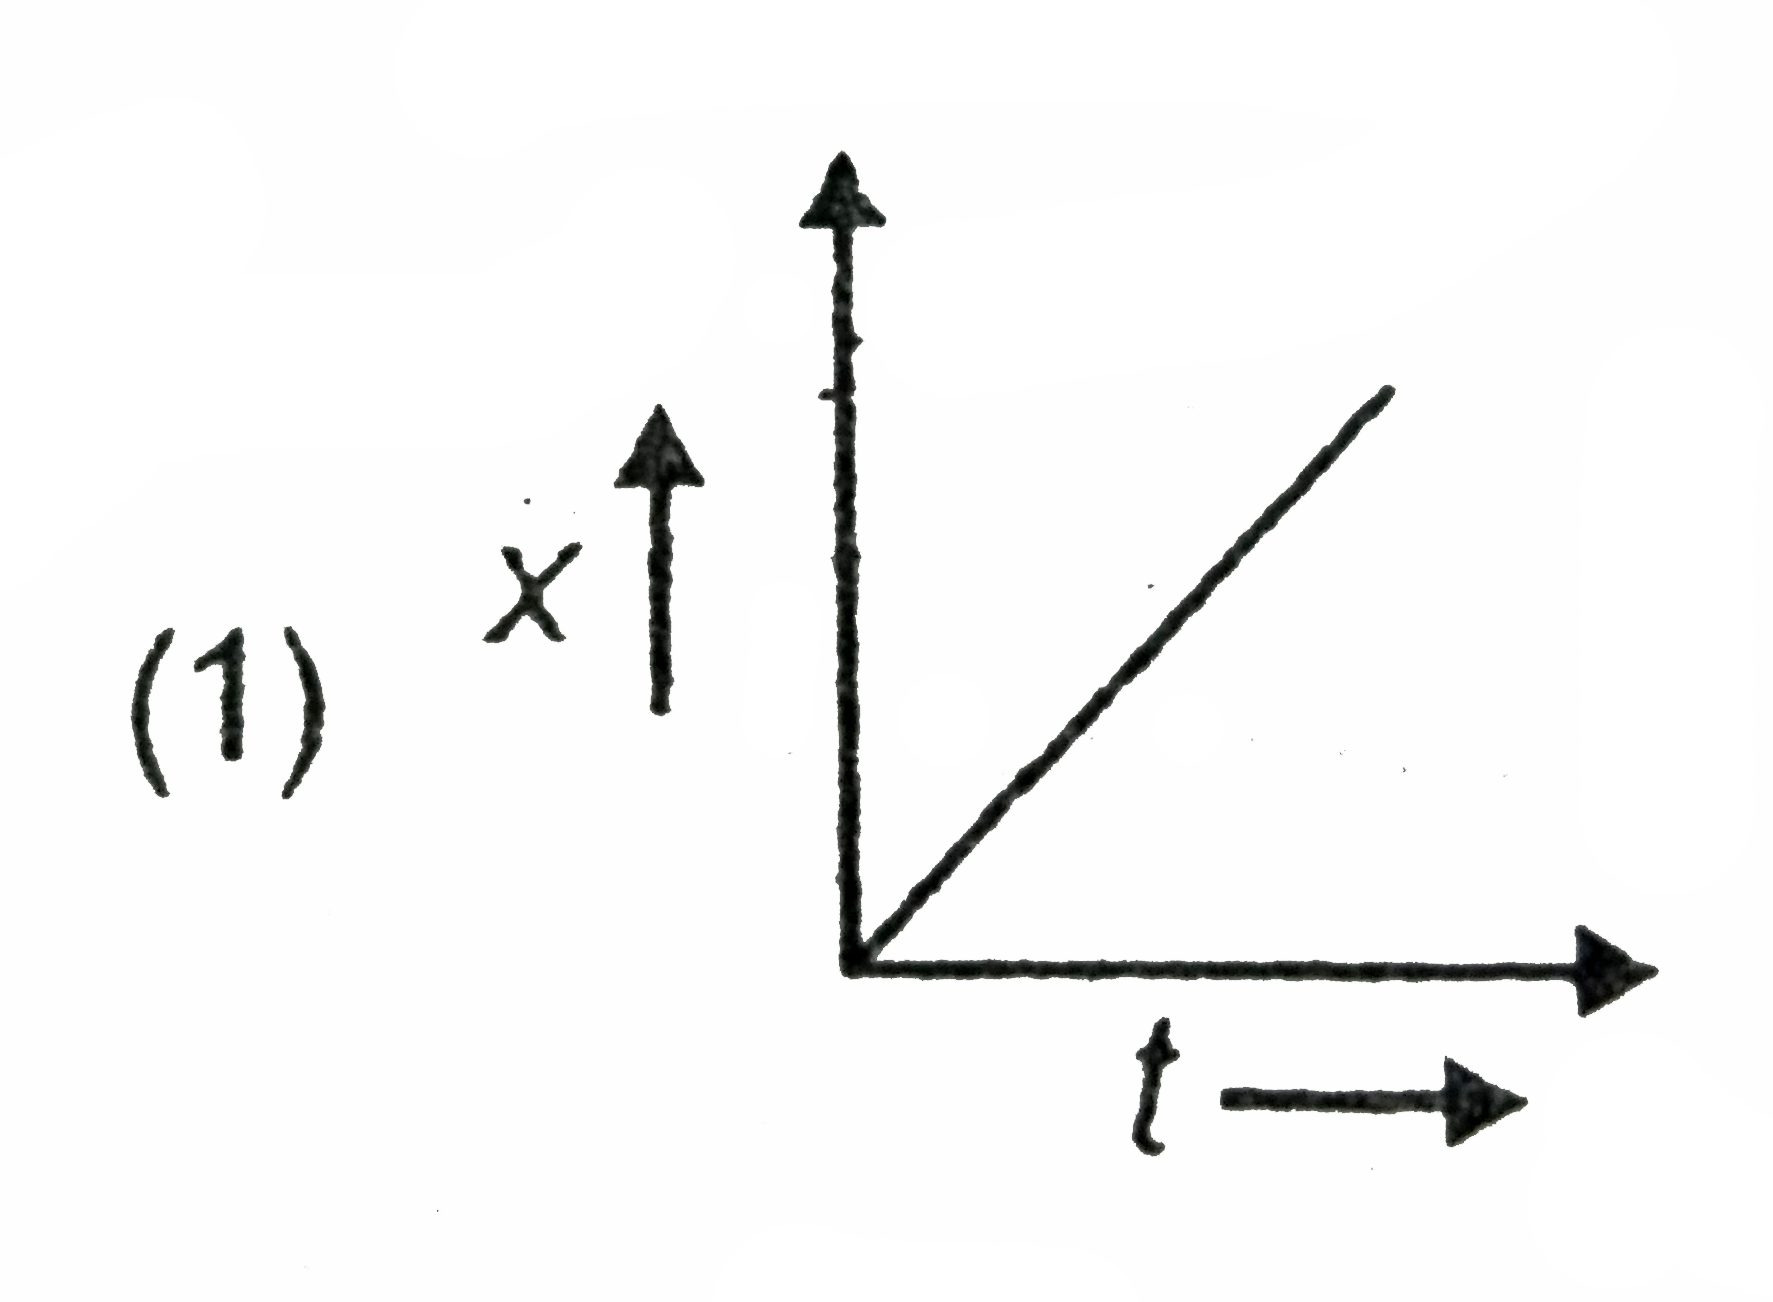 B
B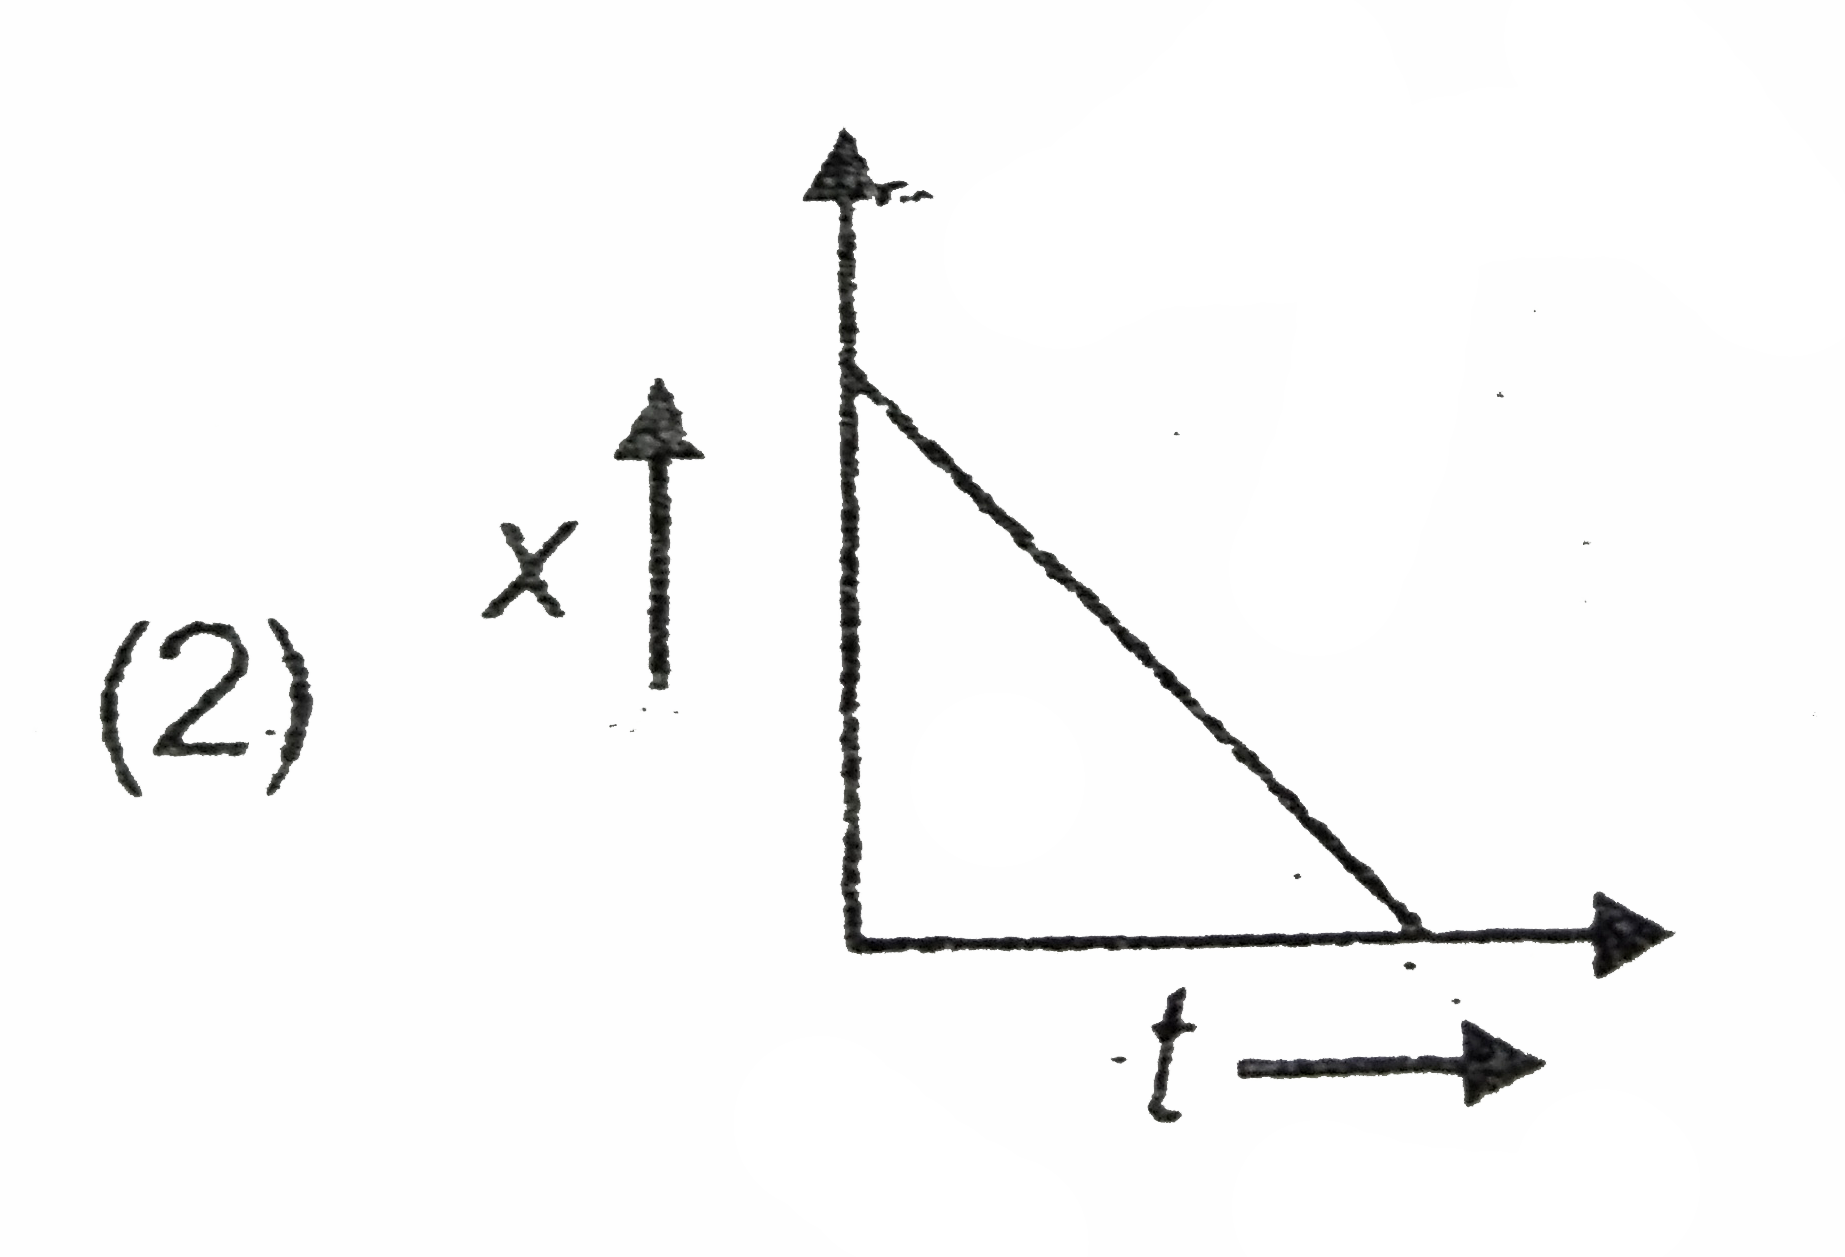 C
C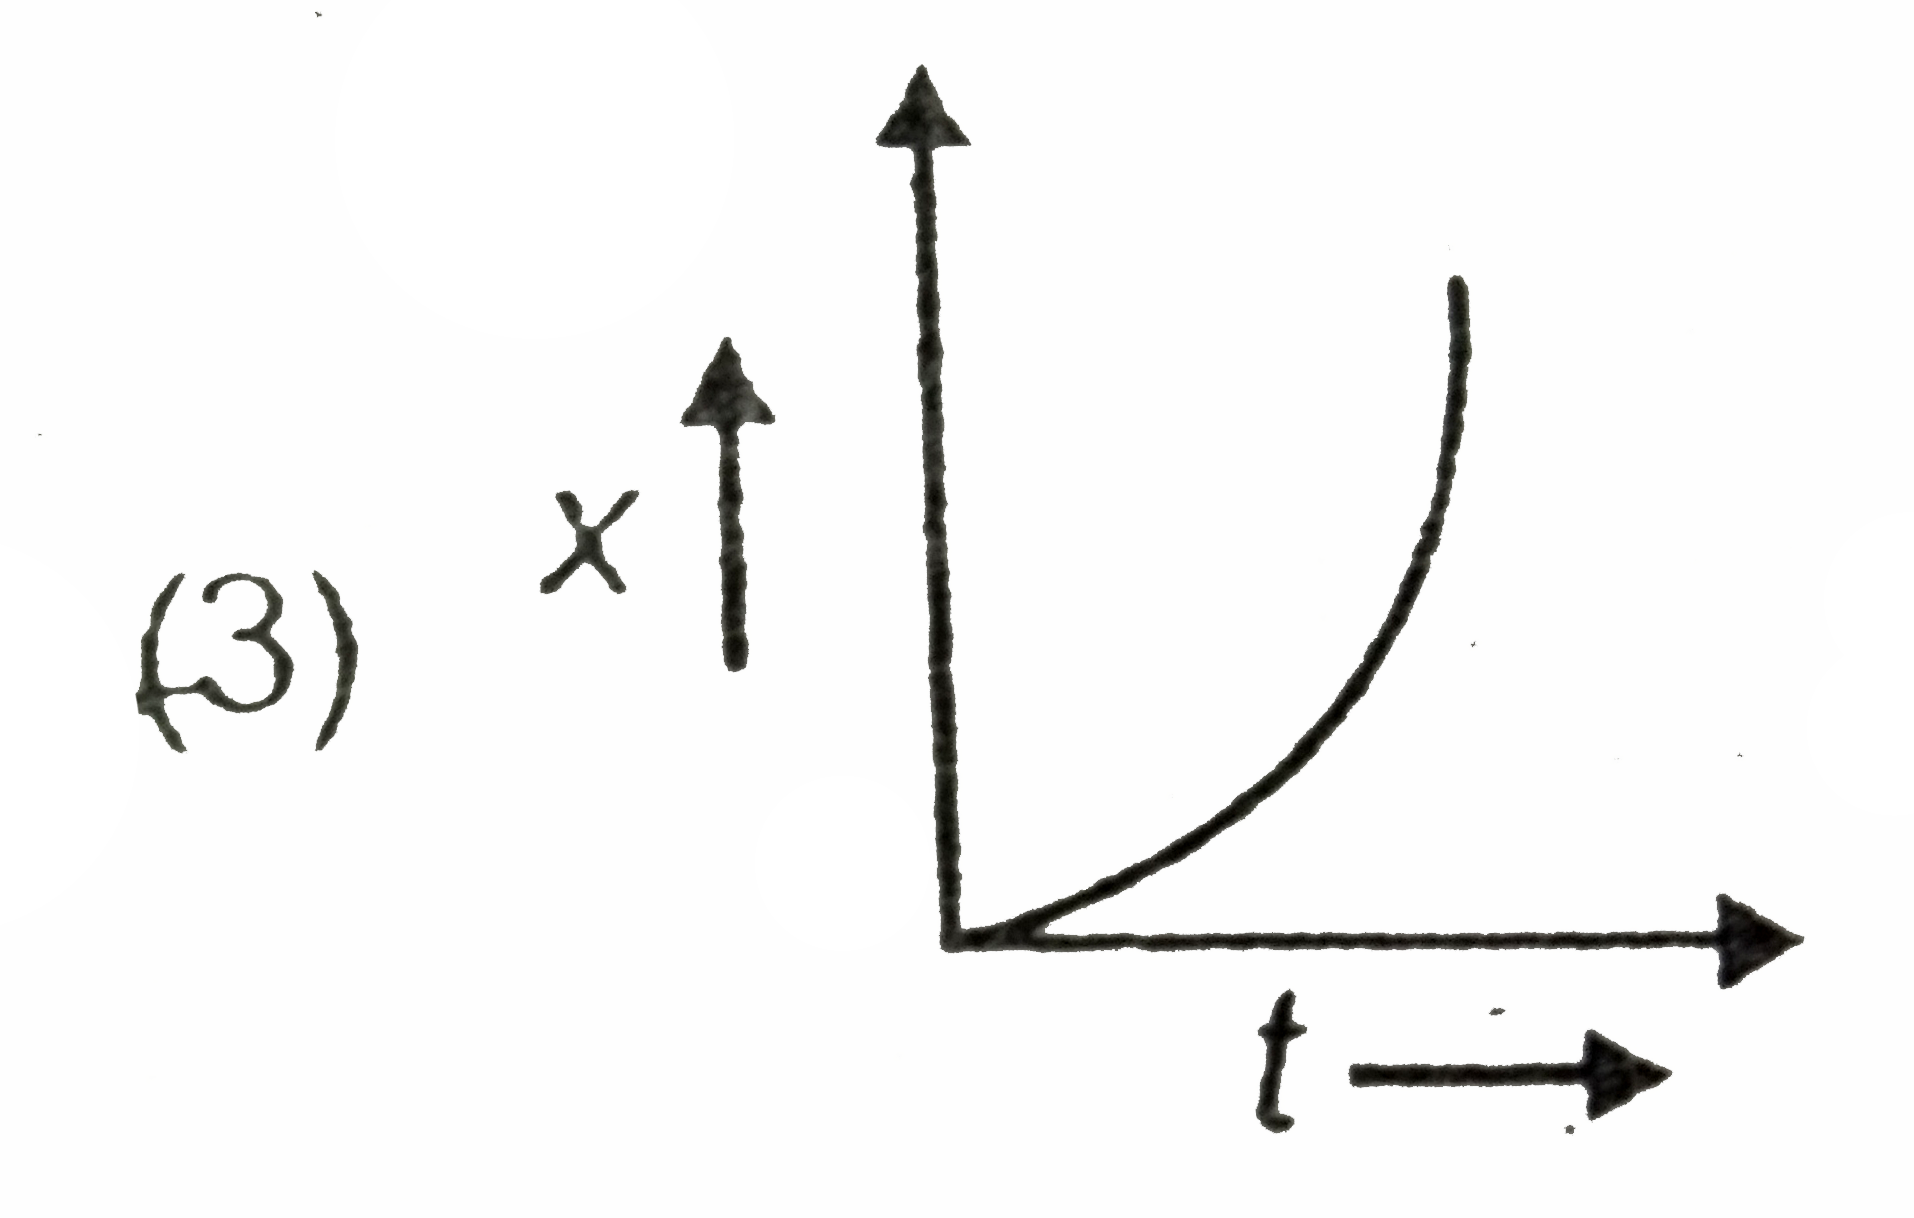 D
D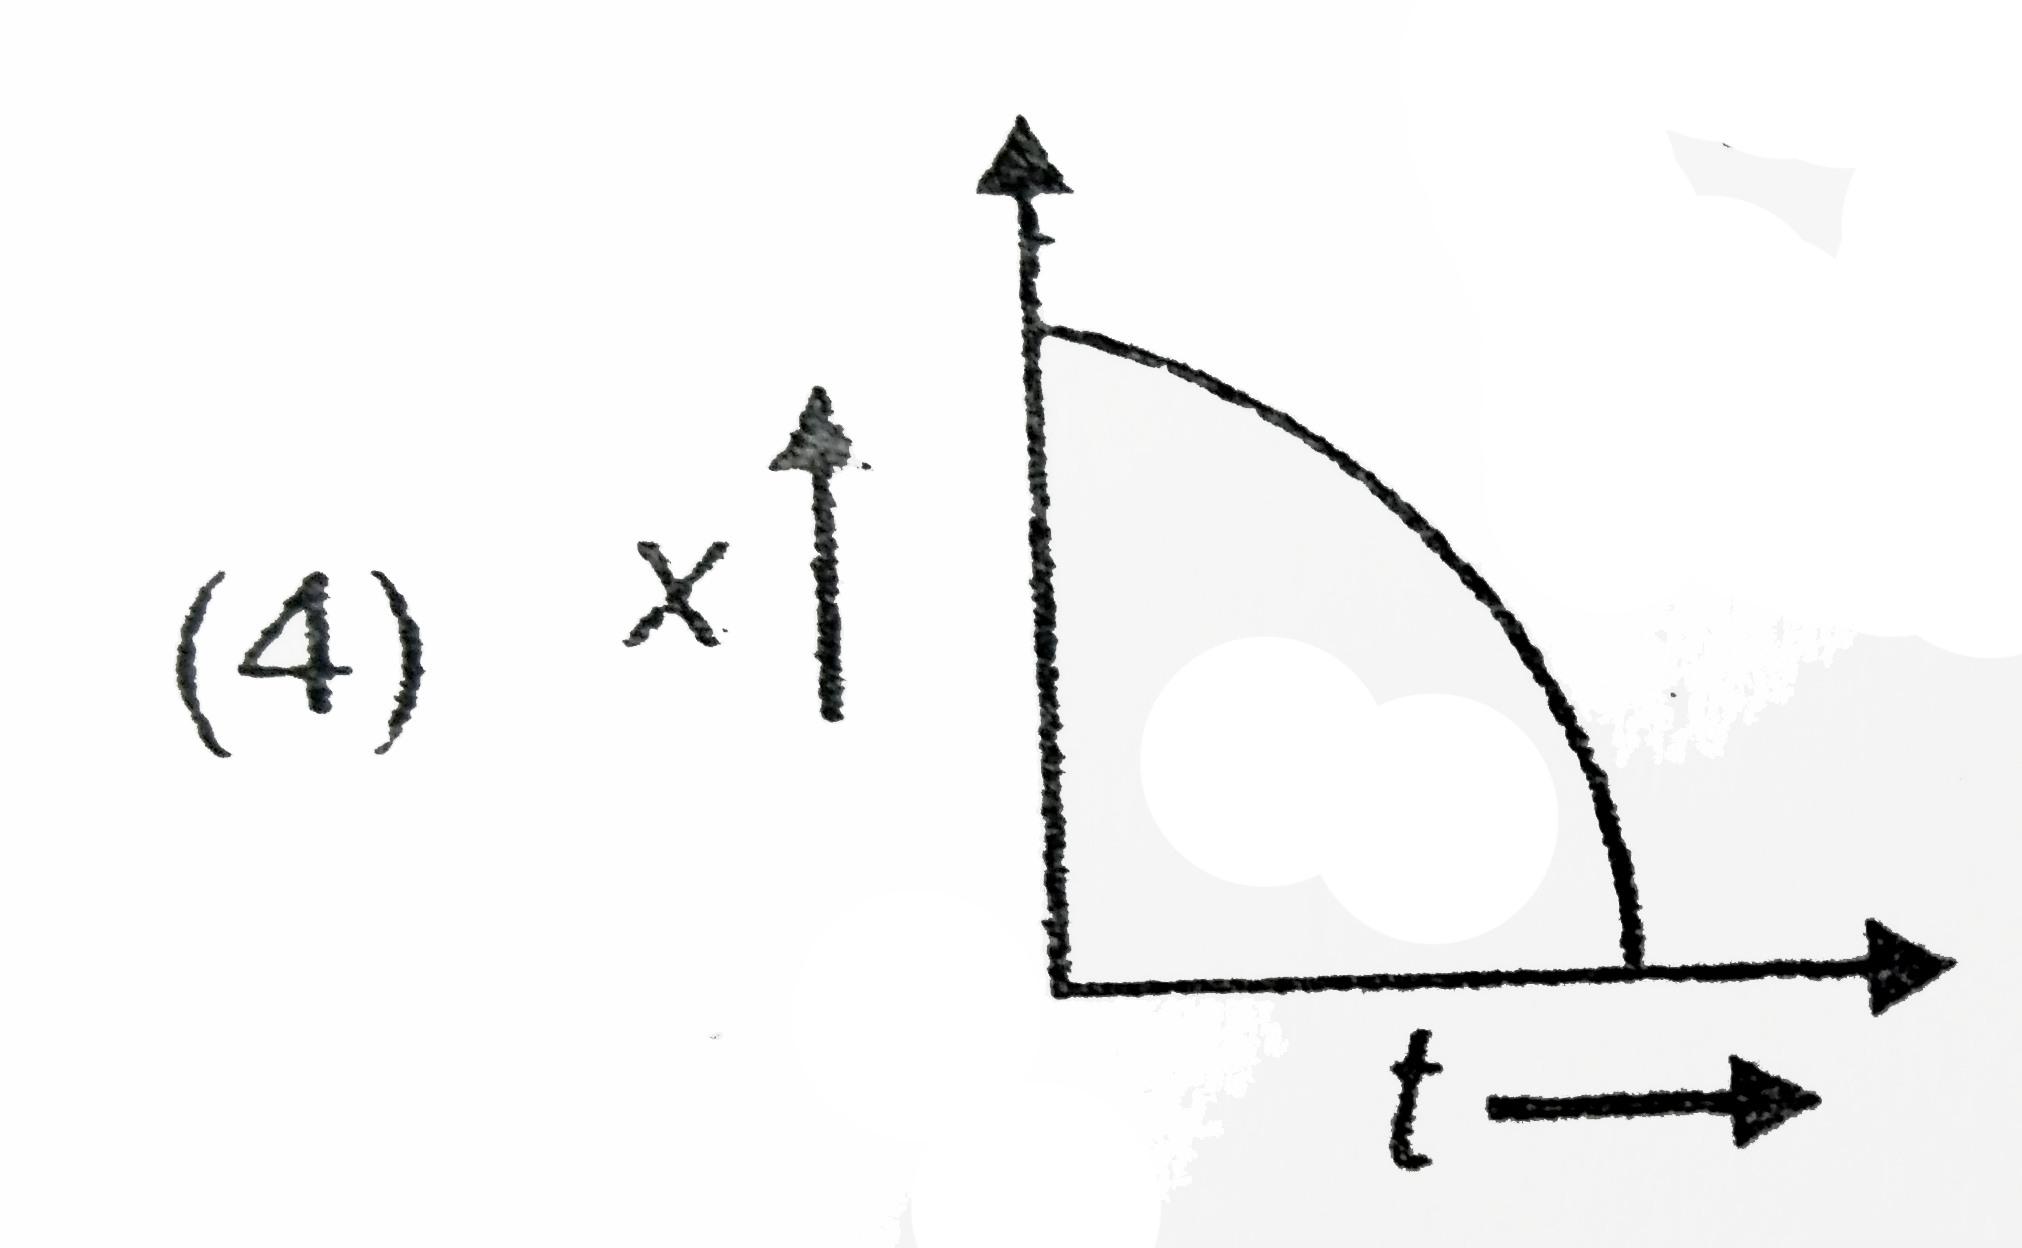
- Question 3 - Select One
The velocity (v) - time (t) graph for a particle moving along x - axis is shown in the figure. The corresponding position (x) - time (t) is best represented by
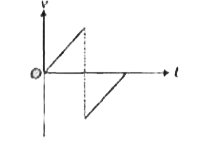 A
A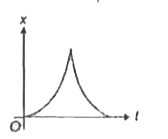 B
B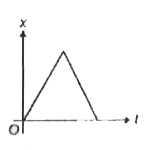 C
C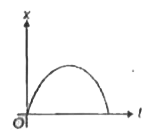 D
D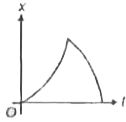
Explain the situations represented by the following distance-time graphs :
 View Solution
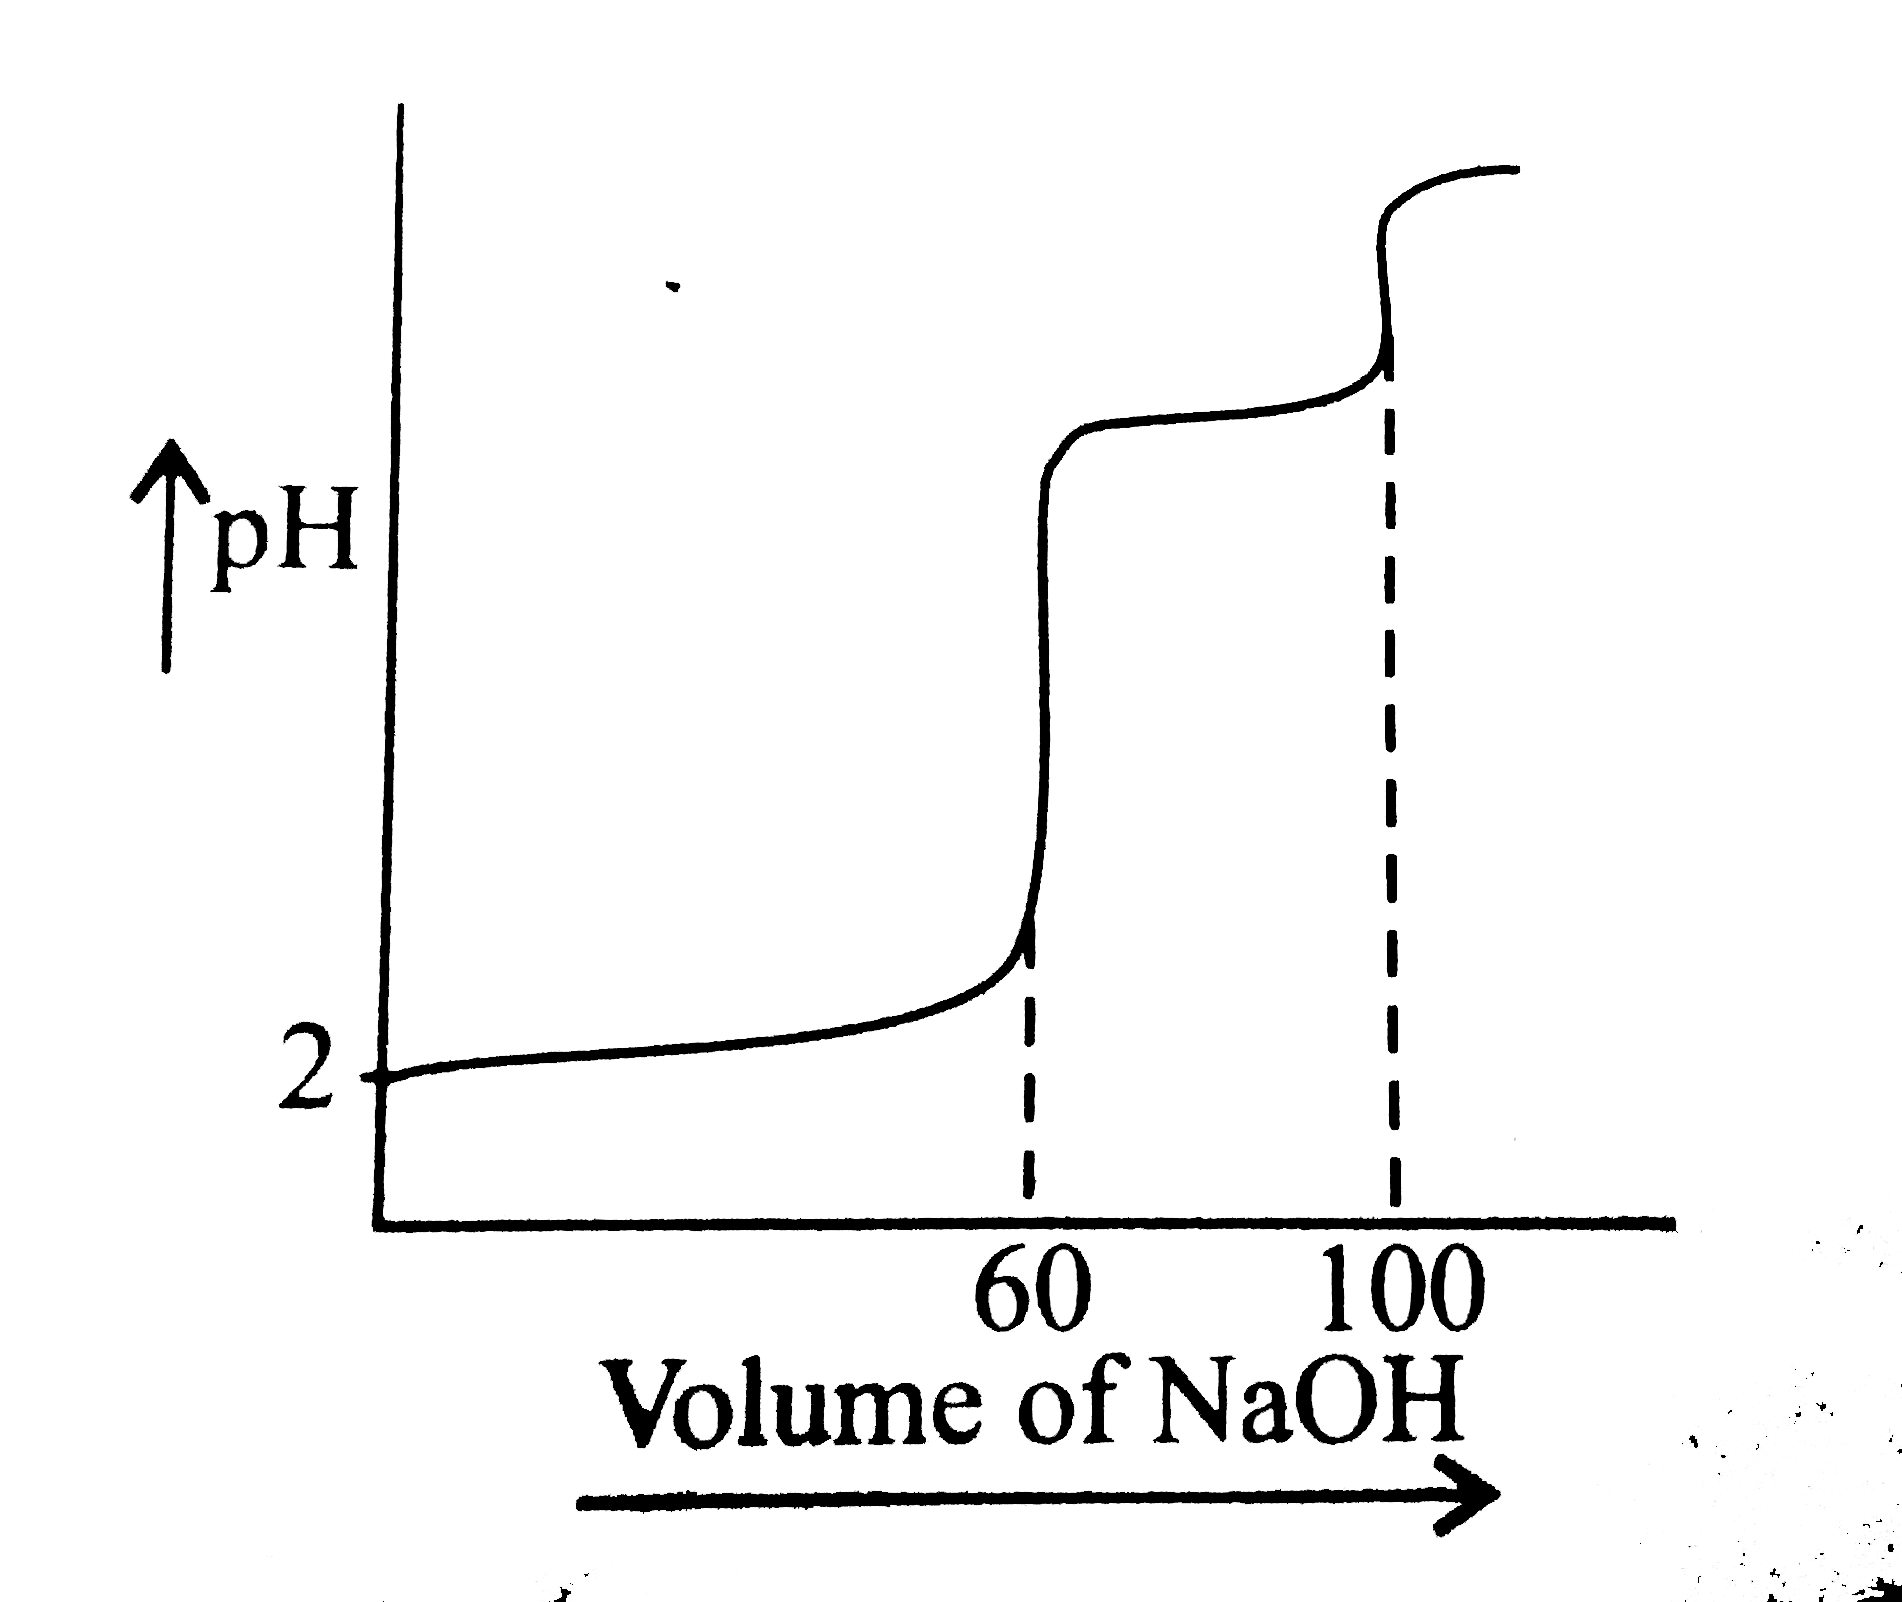
The following graph represents the titration of pH vs volume
 View Solution
Which of the following graphs represents the variation of activity (A) of a radioactive substance with time (t).
View SolutionA rigid ball rolls without slipping on a surface shown below.

Which one of the following is the most likely representation of the distance traveled by the ball vs time graph?View SolutionWhich of the following represents distance(s)-time(t) graph for a retarded motion?
View Solution

