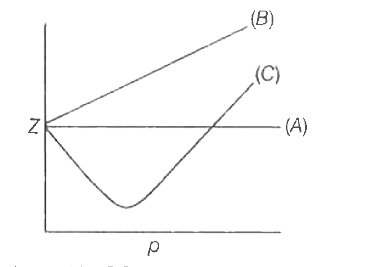
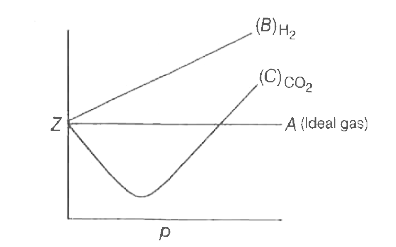
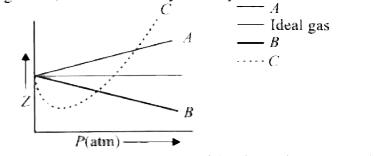
The variation of compressibility factor (Z) with pressure (p in bar) for some gases are shown in the figure below. Identify the gases (A) ,(B) and (C ) respectively
 Solution in Telugu
real gas , N2,CO2
ideal gas, H2CO2
ideal gas , CO2,H2
real gas, H2CO2
The correct Answer is:B
The extent of daviation showm by real gases from ideal behaviour in terms of compressibility factor (Z) which is defined as the ratio of pV and nRT.
Mathematically, Z=pVnRT
Easily liquefiable gases such as CO2 exhibit larger devitation as compared to gases such as H2,O2,N2 etc., that liquefy with difficulty.
Topper's Solved these Questions
Similar Questions
From the following energy levels of hydrogen atom, the values of E∞ and E3 in J are, respectively
_______ E∞= ........
_______ E3= ........
_______ E2=−0.545×10⁻¹⁸J
_______ E1=−2.18×10⁻¹⁸J03:03View SolutionIn the Millikan's oil drop method, which of the following force does not act on the oil drop?
01:59View SolutionThe given graph represents the variations of compressibility factor Z=PV//nRT vs P for three real gases A , B , and C . Identify the incorrect statements.
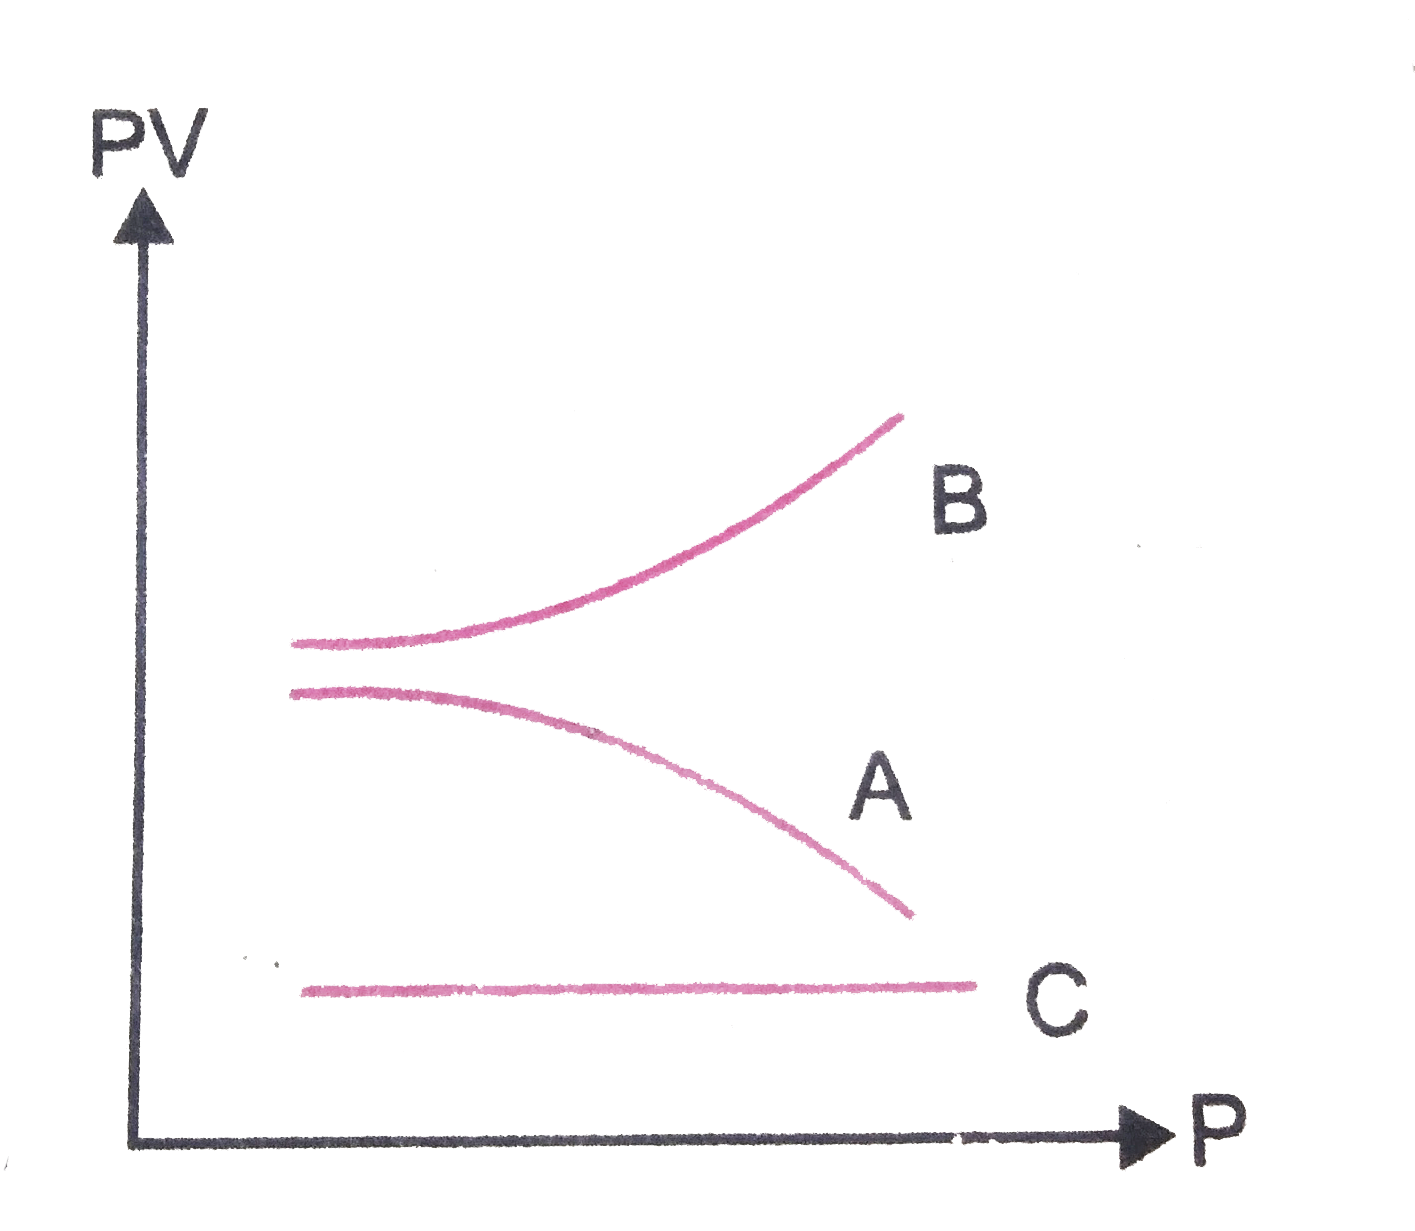
View SolutionThe graphs in Fig shown the variation of the product PV with respect to the pressure (P) of given masses of three gases, A, B and C. The temperature is kept constant. State with proper arguments which of these gases is ideal.
 08:10View Solution
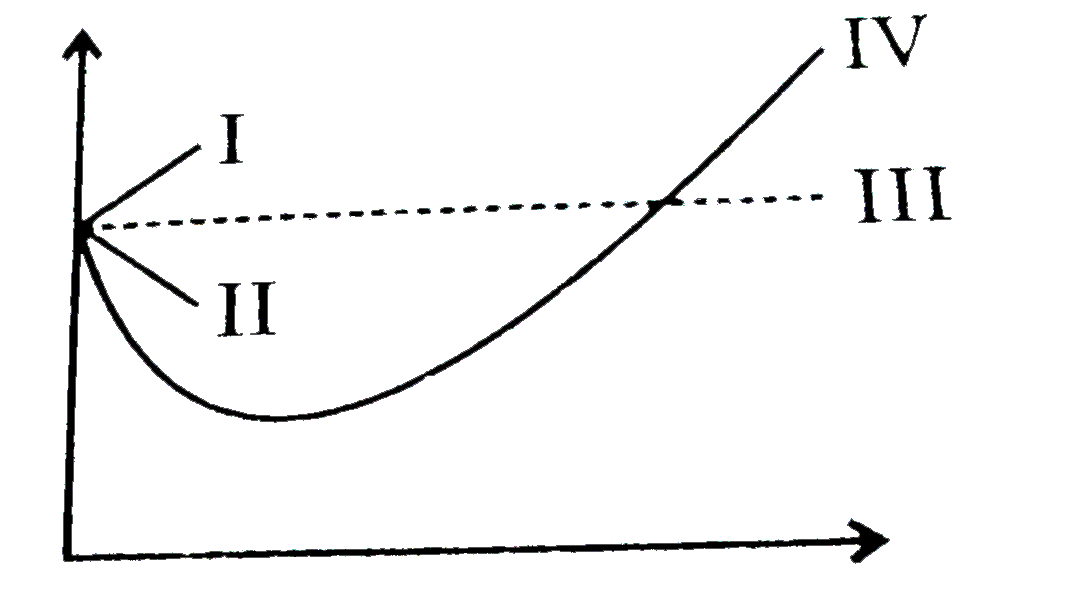
Figure displays the plot of the compression factor Z versus P for a few gases which of the following statements is/are correct for a van der Waals' gas?
 05:05View Solution
Consider the graph between compressibility factor Z and pressure P, The correct increaing order of ease of liquefaction of the gases shown in the above graph is
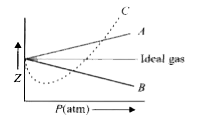
03:02View SolutionThe given graph represents the variations of compressibility factor Z= pv//nRT vs P for three real gases Which of the following statements is wrong?
View SolutionCompressibility factor (Z=PVnRT) is plotted against pressure
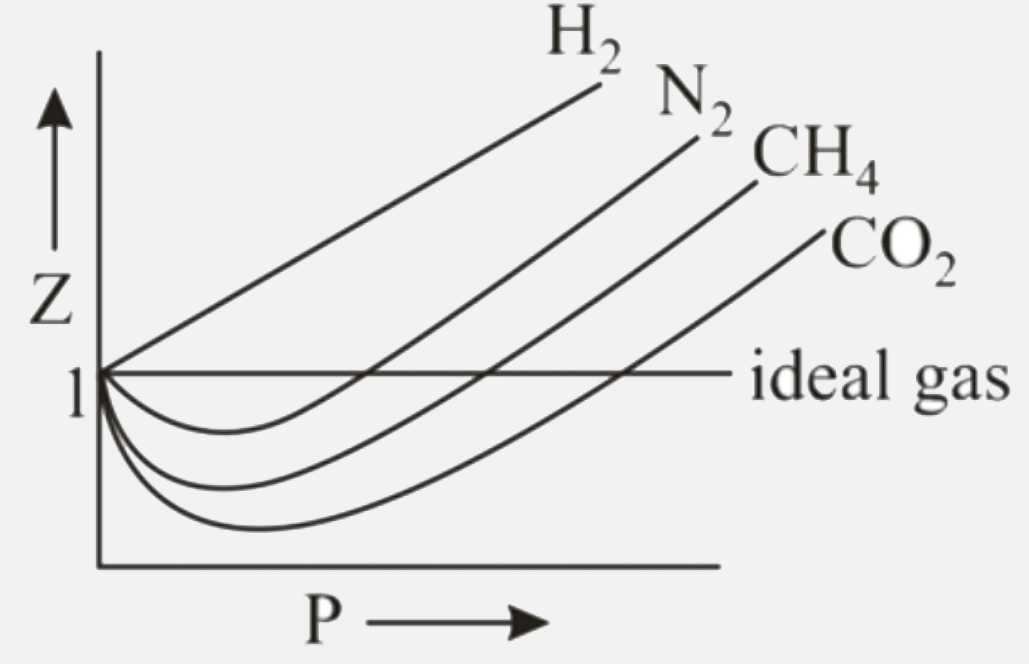
Which is the correct order of liquefiability of the gases shown in the above graph ?02:18View SolutionThe given graph represents the variation of Z (compressibility factor =PVnRT) versus P, for three real gases A,B and C. Identify the only incorrect statement.
 48:08View Solution
(True/False) The compressibility factor (z) for ideal gases is 1,.
11:09View SolutionVariation OF compressibility factor with temperature || Liquefaction OF gases & andrew's isotherms,critical temperature,pressure & volume
08:13View SolutionThe given graph represents the variations of compressibility factor Z=PV//nRT vs P for three real gases A , B , and C . Identify the incorrect statements.
View SolutionThe given graph represents the variations of compressibility factor Z= pv//nRT vs P for three real gases Which of the following statements is wrong?
View SolutionThe given graph represents the variation of Z (compressibility factor =PVnRT) versus P, for three real gases A, B and C. Identify the only incorrect statement.
 03:19View Solution
Consider the graph between compressibility factor Z and pressure P:
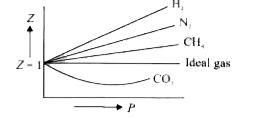
The correct increasing order of ease of liquefaction of the gases shown in the above graph is02:34View Solution

