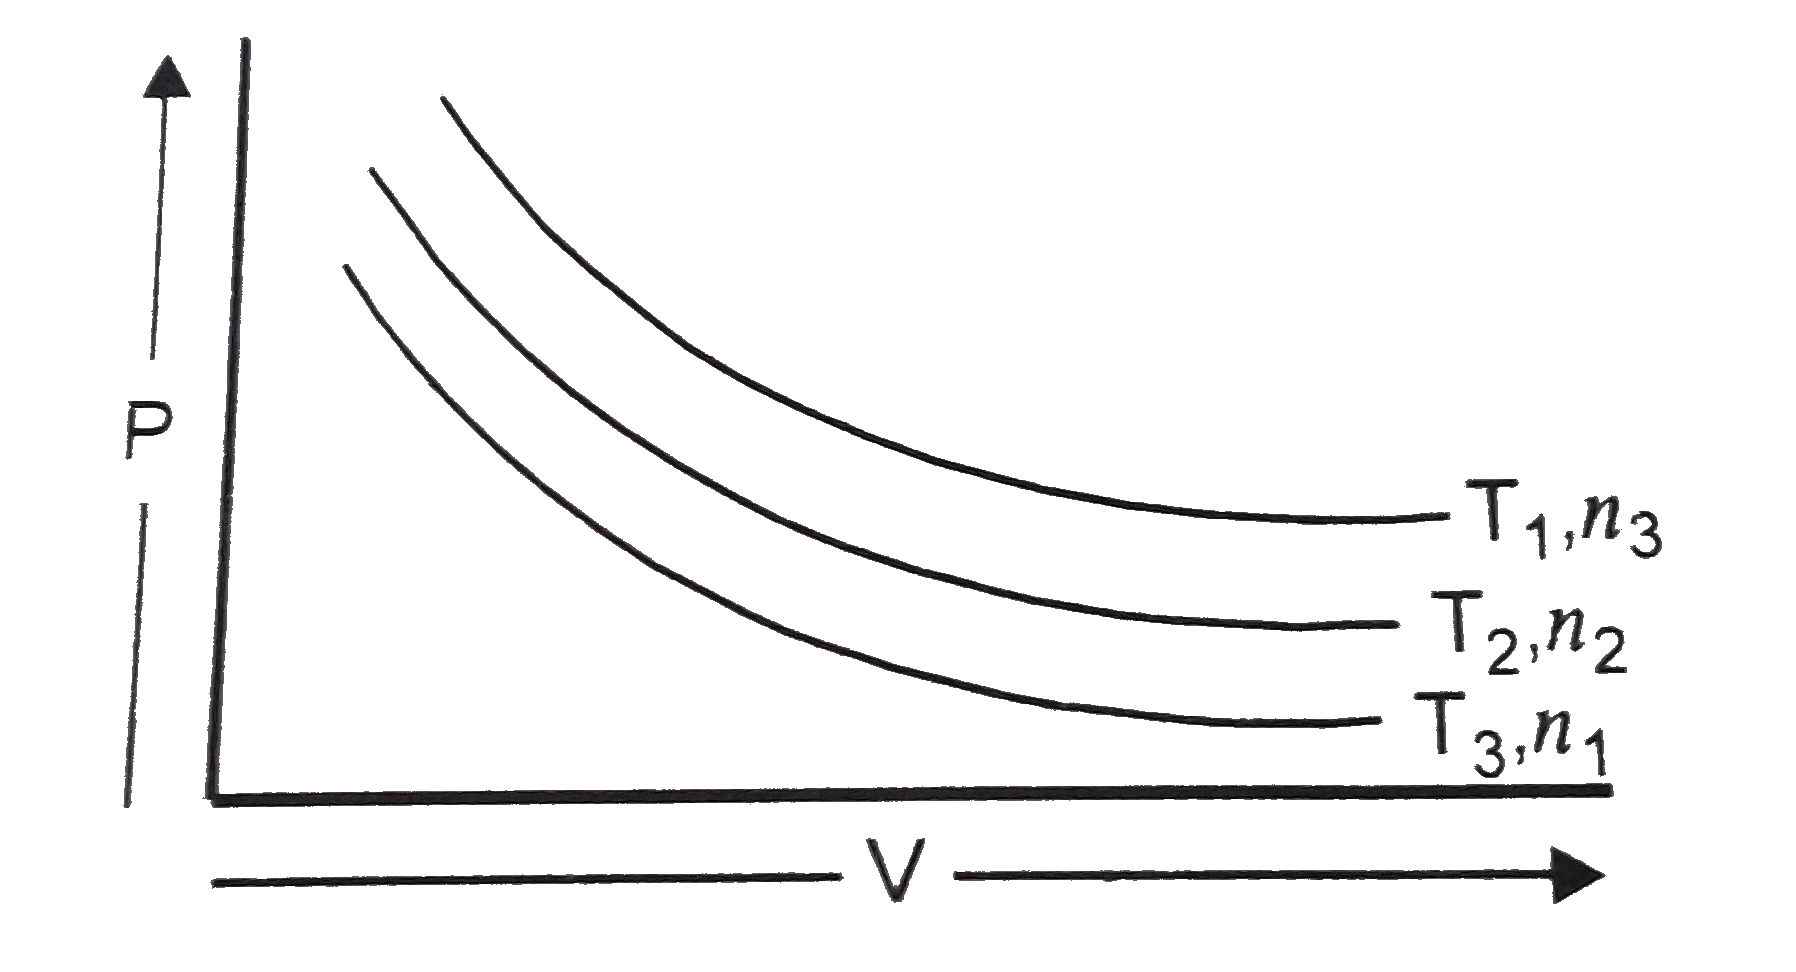
The graph of P vs V is given at temperature and number of moles :

The correct relationship is/are
A
T1>T2>T3
B
T1<T2<T3
C
n1>n2>n3
D
n3>n2>n1
Text Solution
The correct Answer is:A, D
Both relationships are correct.
|
Topper's Solved these Questions
- STATES OF MATTER : GASES AND LIQUIDSBOOK - DINESH PUBLICATIONCHAPTER - STATES OF MATTER : GASES AND LIQUIDSEXERCISE - Assertion and Reason
11 Videos
- STATES OF MATTER : GASES AND LIQUIDSBOOK - DINESH PUBLICATIONCHAPTER - STATES OF MATTER : GASES AND LIQUIDSEXERCISE - Statement Type Question
5 Videos
- STATES OF MATTER : GASES AND LIQUIDSBOOK - DINESH PUBLICATIONCHAPTER - STATES OF MATTER : GASES AND LIQUIDSEXERCISE - Comphension 4
2 Videos
- STATES OF MATTER (SOLID STATE CHEMISTRY)BOOK - DINESH PUBLICATIONCHAPTER - STATES OF MATTER (SOLID STATE CHEMISTRY)EXERCISE - ULTIMATE PREPARATORY PACKAGE
21 Videos
- STRUCTURE OF ATOMBOOK - DINESH PUBLICATIONCHAPTER - STRUCTURE OF ATOMEXERCISE - Reason Type Questions
1 Videos
Similar Questions
Knowledge Check
The graph of PV vs P for a gas is
AparabolicBhyperbolicCa straight line parallel to X-axisDa straight line passing through originGraph between p and V at constant temperature is
AstraightBcurved increasingCstraight line with slopeDparabolic curve decreasingGraph between p and V at constant temperature is
AstraightBcurved increasingCstraight line with slopeDnone of these
The graph between PV vs P at constant temperature is linear parallel to the pressure axis.
View SolutionAt low pressure, the graph of PVvs1V for a given amount at a constant temperature for a real gas is:
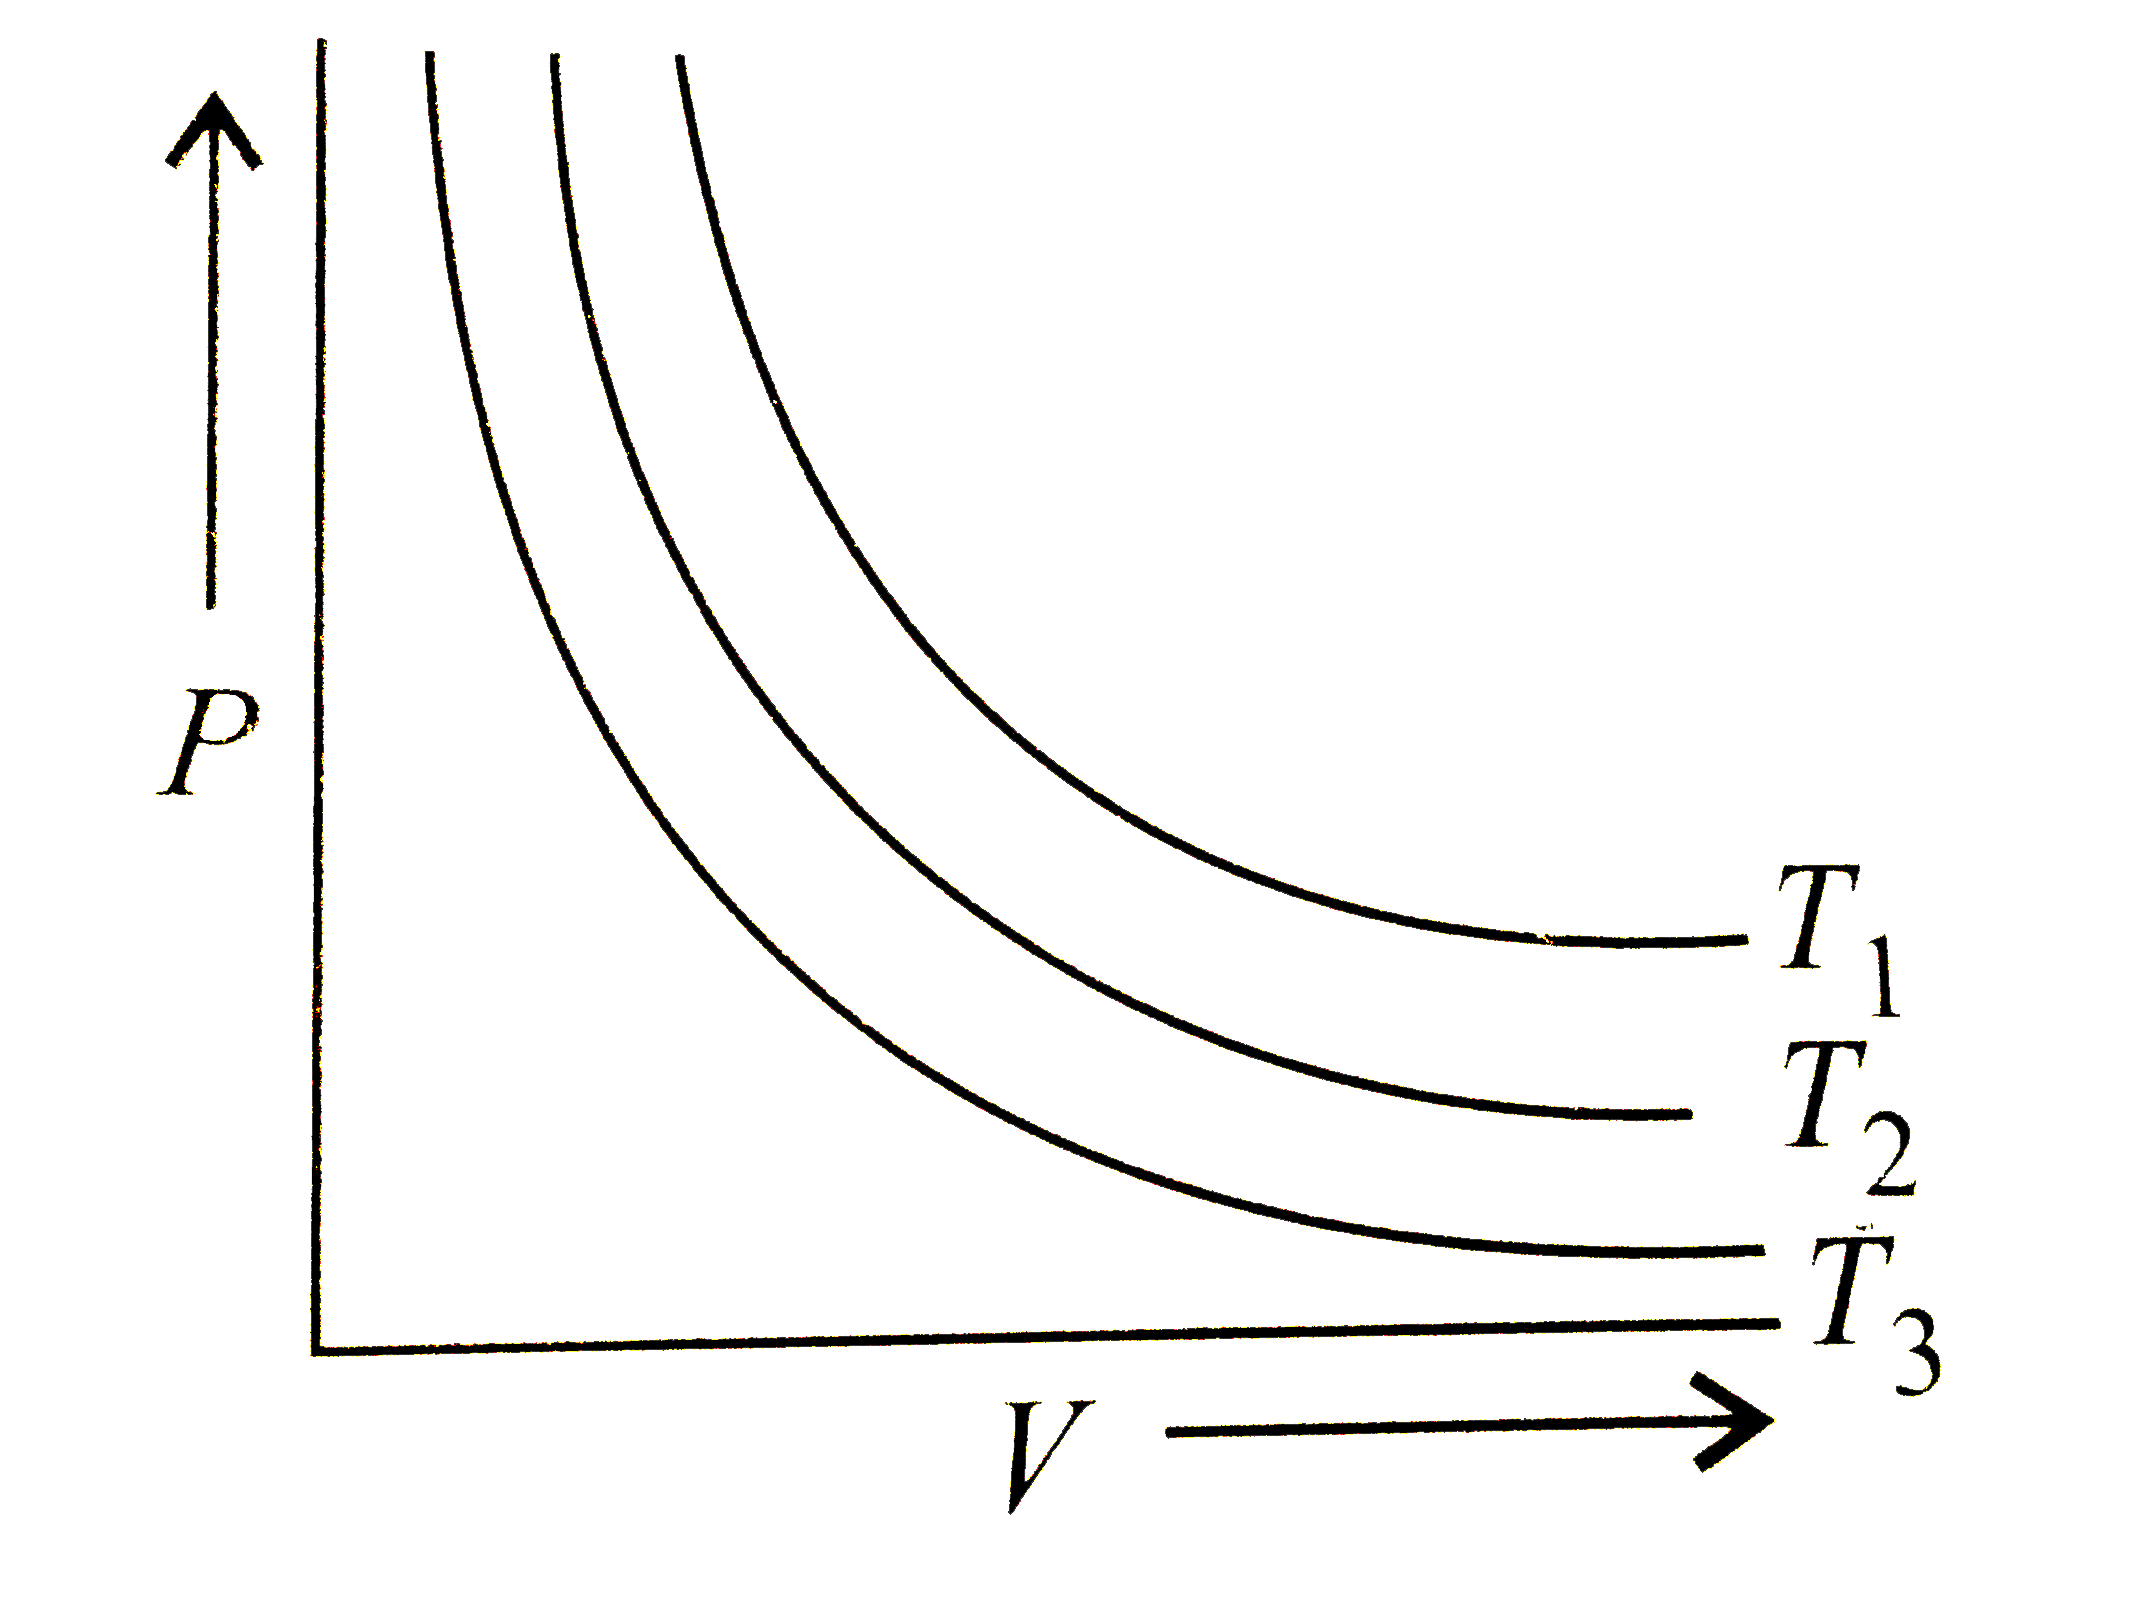
View SolutionGraph between P & V below critical temperature is
View Solution
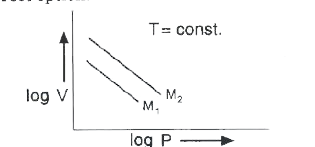
For same mass of two different ideal gases of molecular weights M1 and M2 plots oflog V vs lot P at a given constant temperature are shown. Identify the correct option
View SolutionFor same mass of two different ideal gases of molecular weights M1andM2 plots of log V vs log P at a given constant temperature are shown. Identify the correct option.

View Solution

