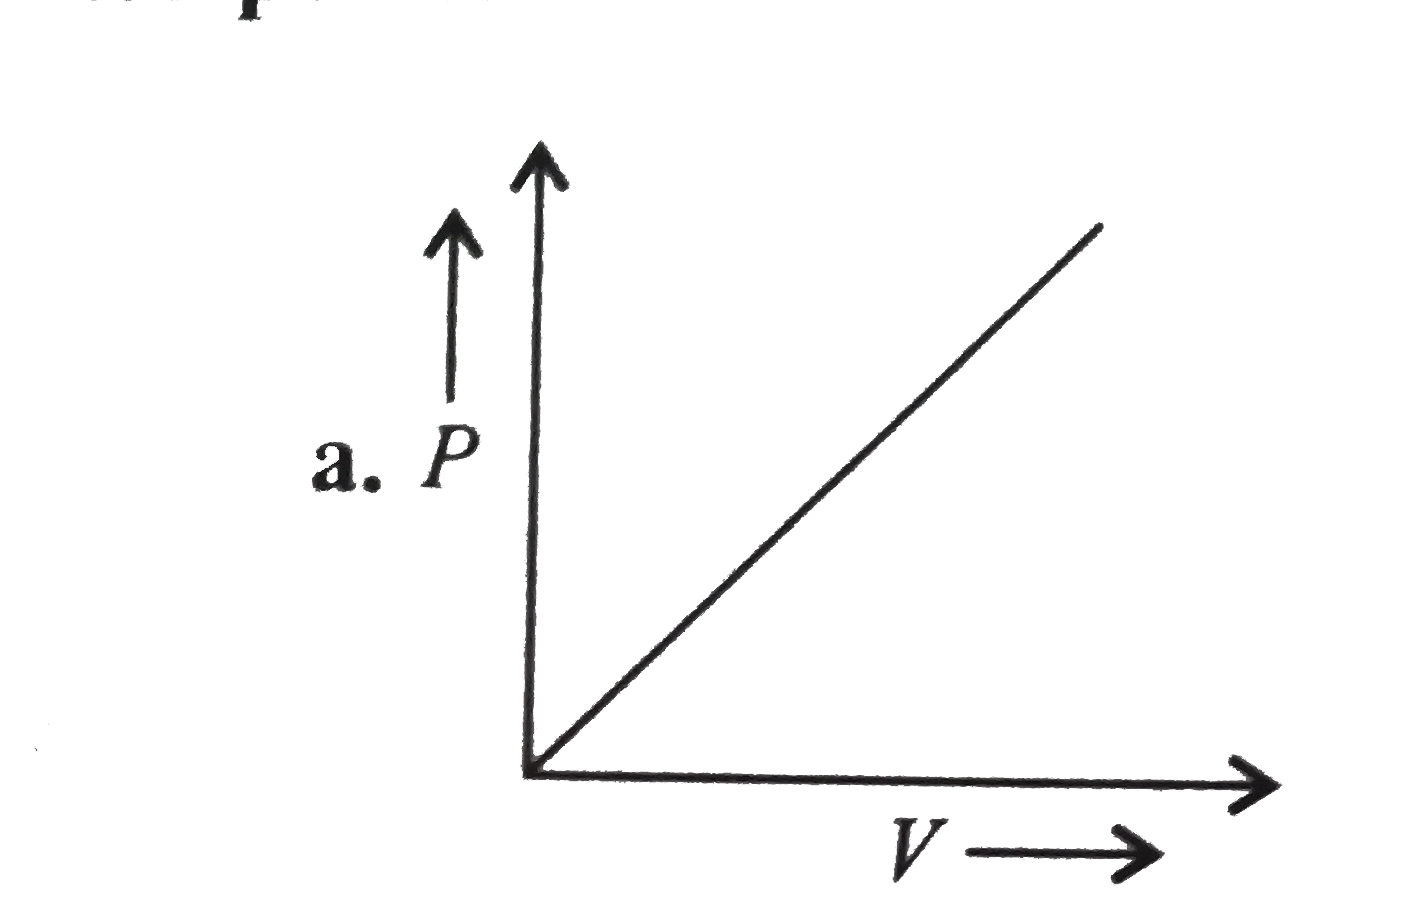
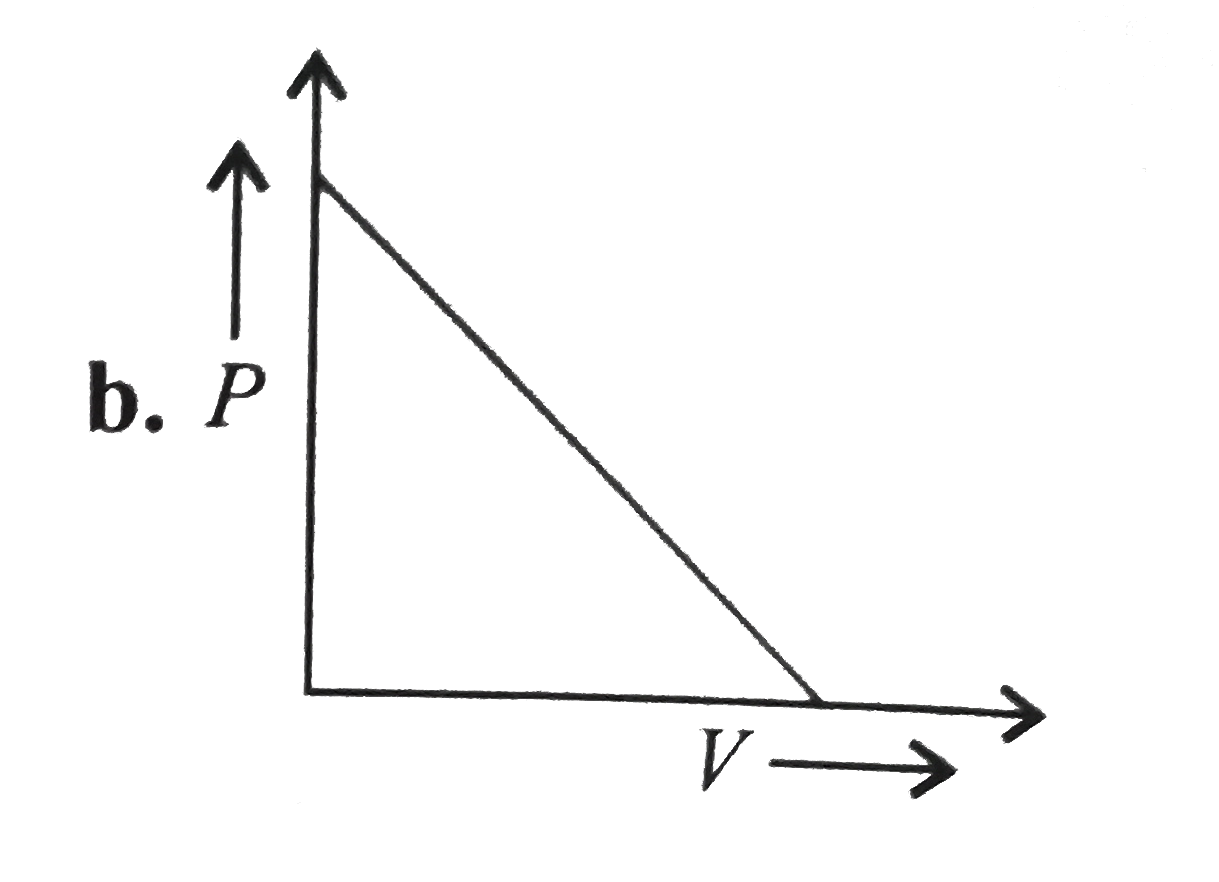
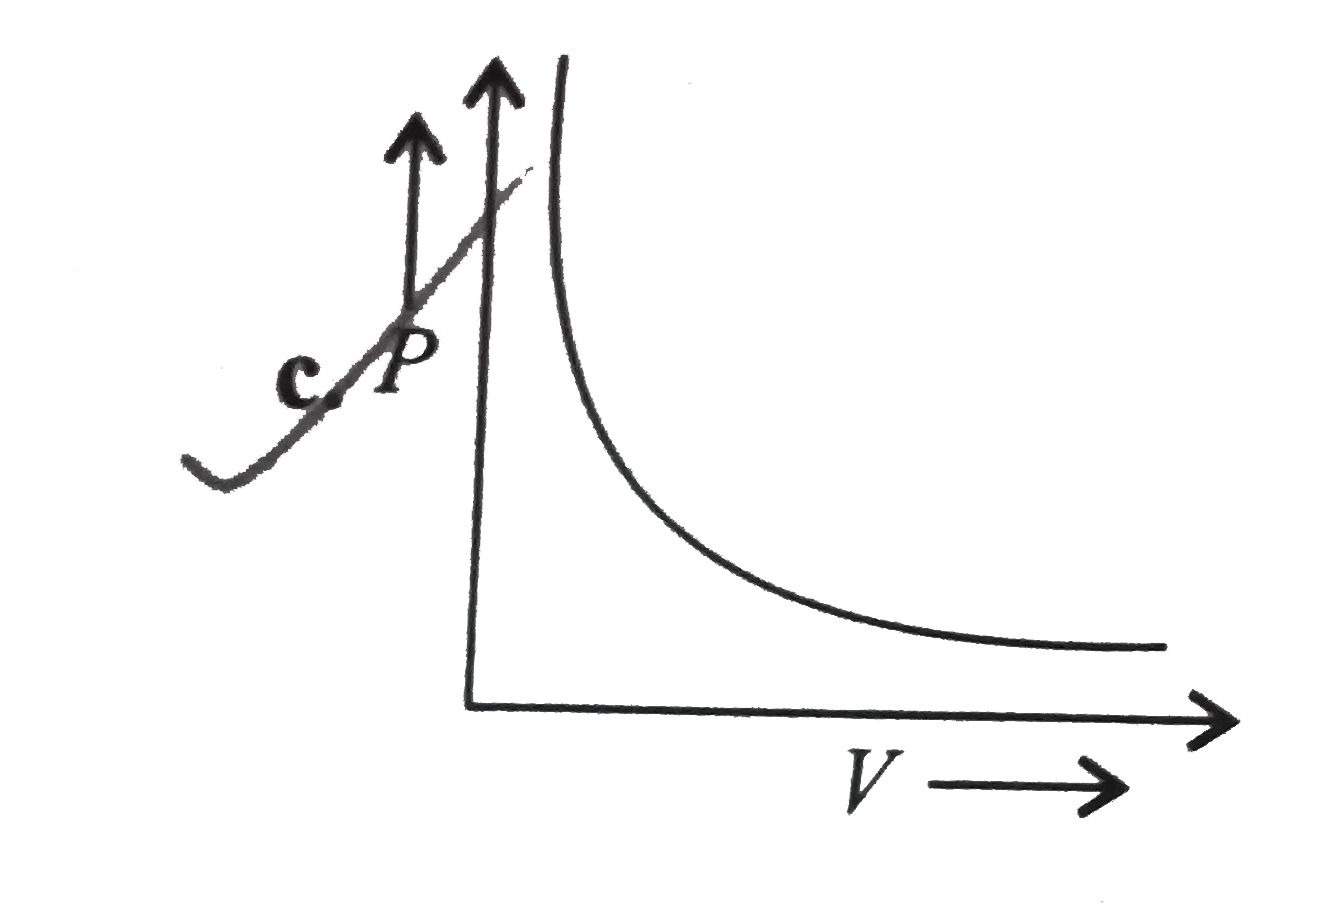
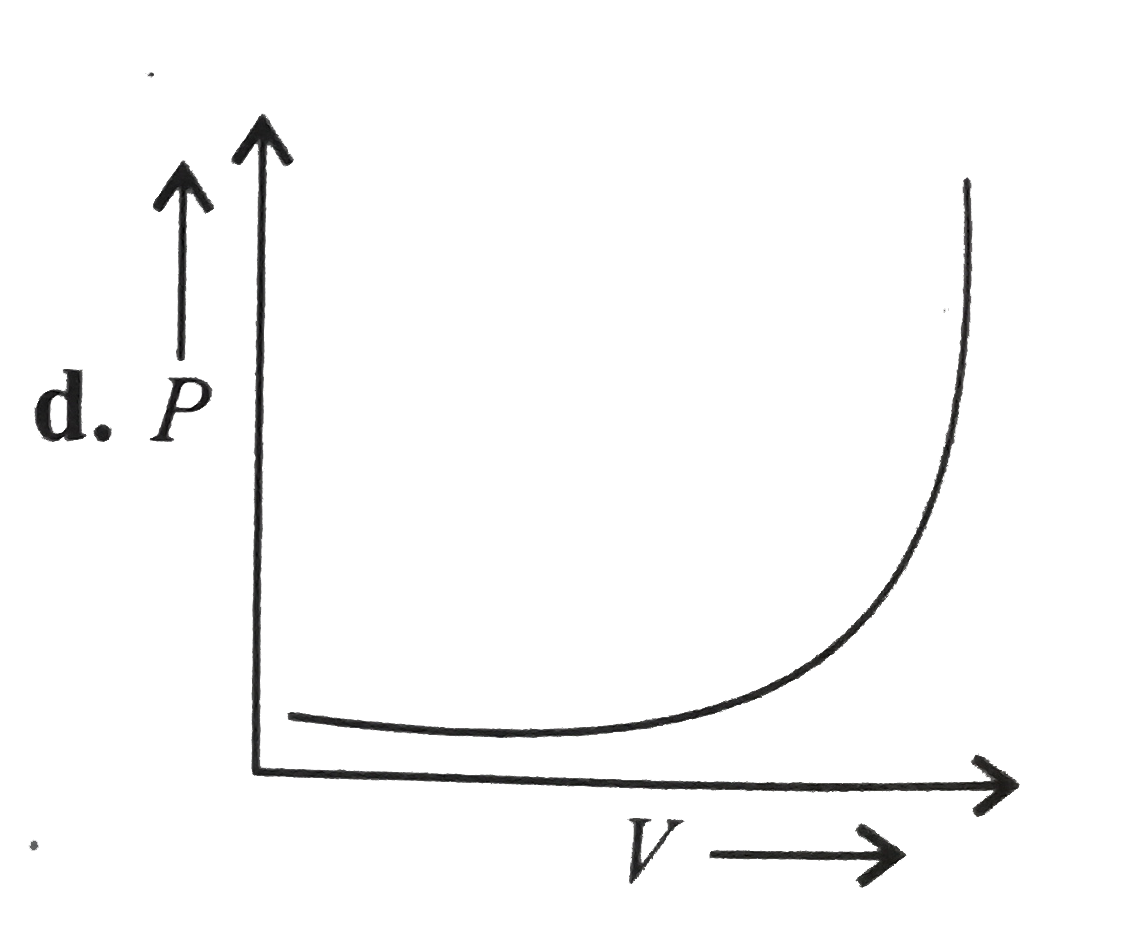
Graph between P & V below critical temperature is
A

B

C

D

Text Solution
The correct Answer is:D
|
Topper's Solved these Questions
Similar Questions
Knowledge Check
Graph between p and V at constant temperature is
AstraightBcurved increasingCstraight line with slopeDparabolic curve decreasingGraph between p and V at constant temperature is
AstraightBcurved increasingCstraight line with slopeDnone of theseThe graph betwene P and V at constant temperature should look like
A B
B C
C D
D
What is the type of graph between log P and log V at constant temperature?
View SolutionWhat is the type of graph between log P and log V at constant temperature?
View SolutionThe slope of the graph between log P and log V at constant temperature for a given mass of gas is
View SolutionThe slope of the graph between log P and log V at constant temperature for a given mass of gas is
View SolutionWhat is the correct relation between critical temperature Tc, Boyle's temperature TB and inversion temperature Ti.
View Solution
