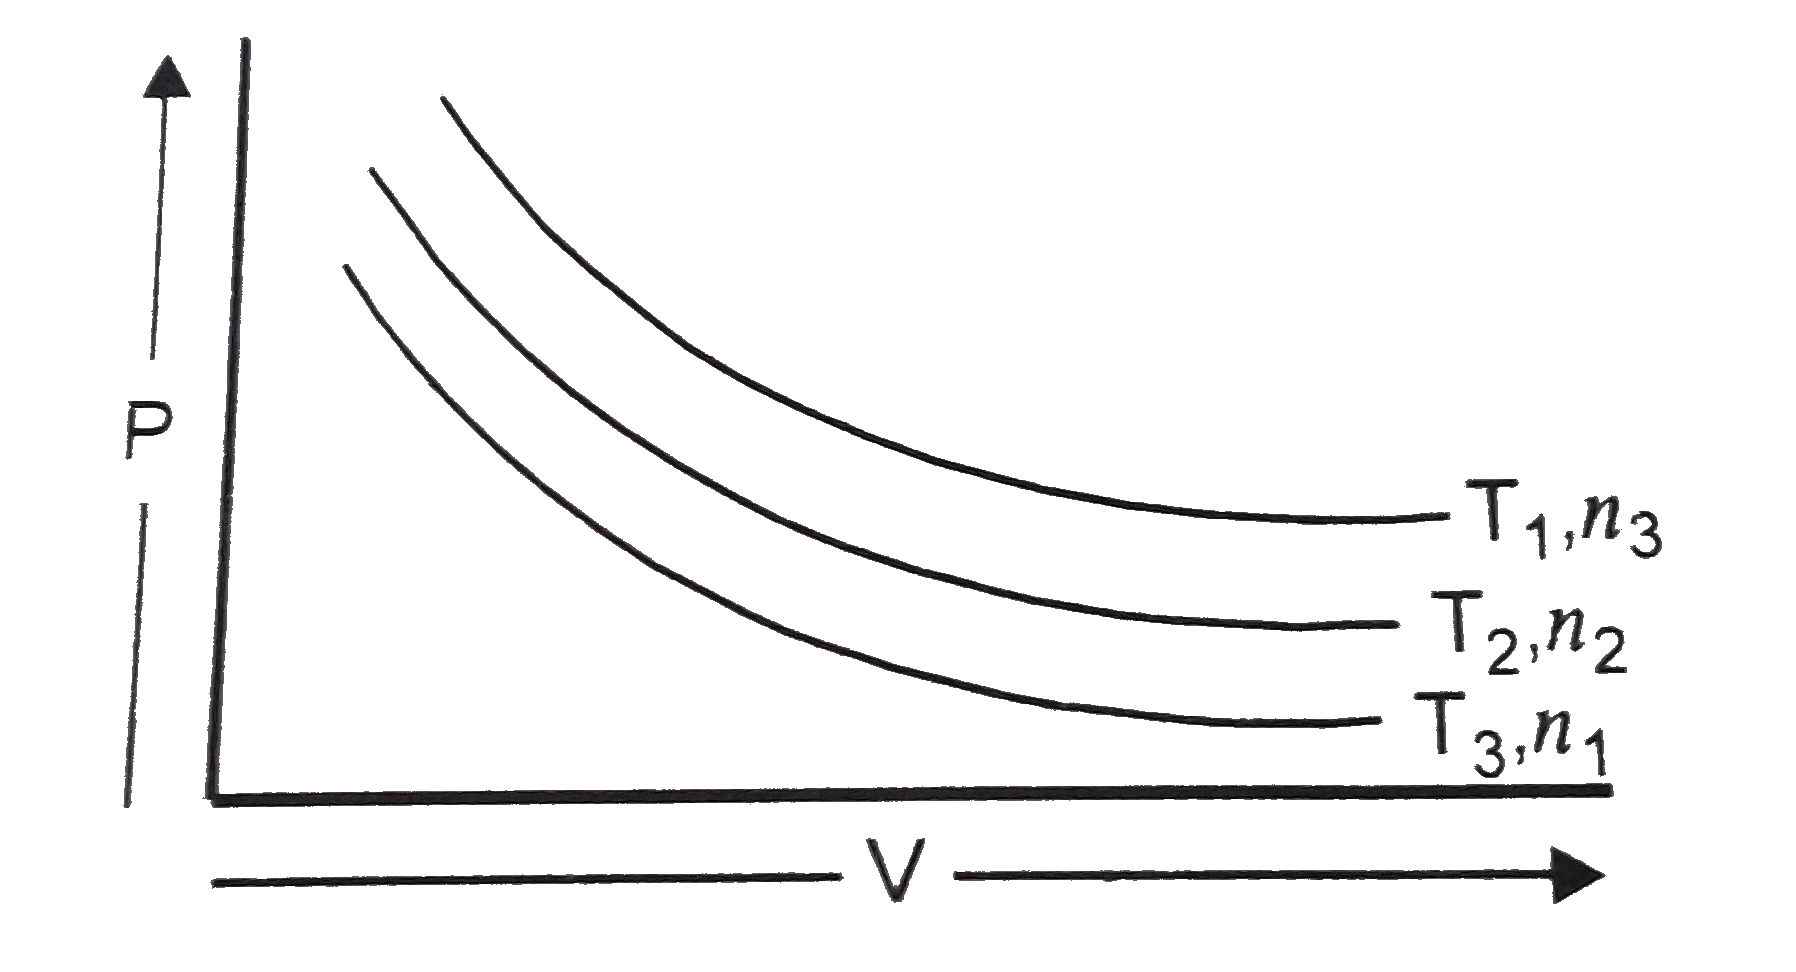
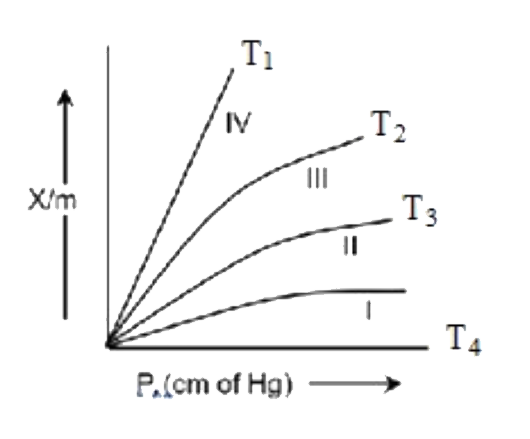
The graph of P vs V is given at different temperature
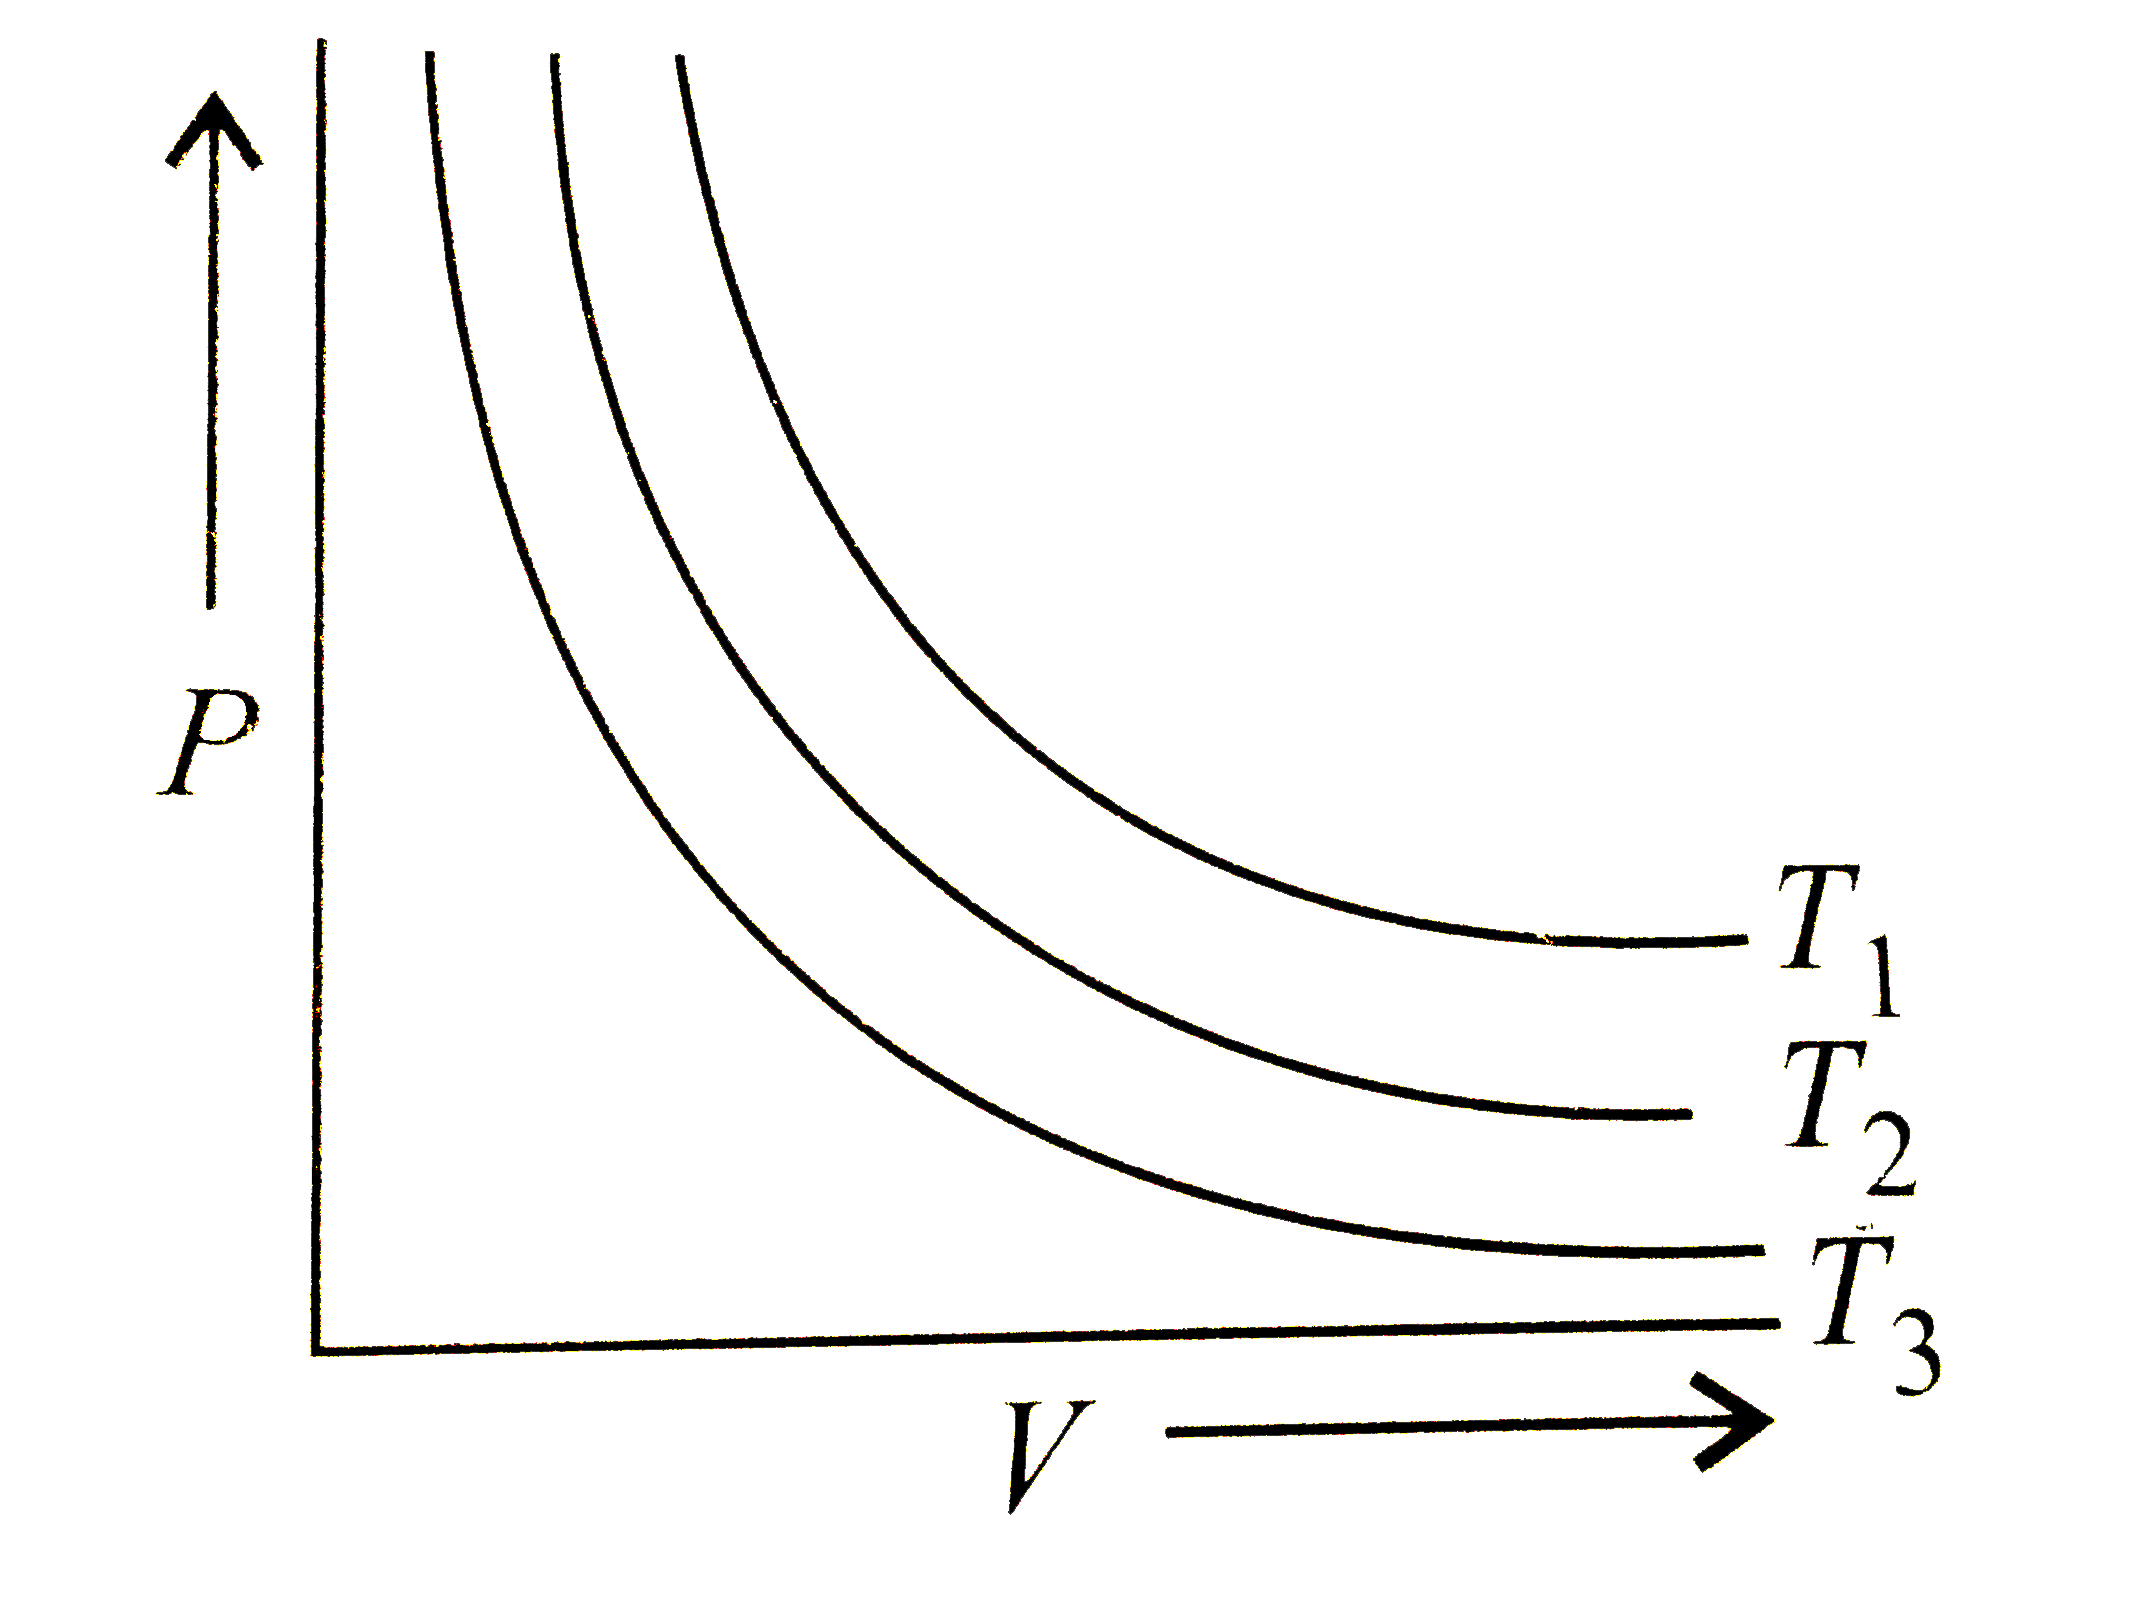
The correct relationship is
T1>T2>T3
T1<T2<T3
T1=T2=T3
T2>T1>T3
The correct Answer is:A
Step by step video & image solution for The graph of P vs V is given at different temperature The correct relationship is by Chemistry experts to help you in doubts & scoring excellent marks in Class 11 exams.
Updated on:21/07/2023Topper's Solved these Questions
- PRACTICE PAPER 3BOOK - NCERT FINGERTPS ENGLISHCHAPTER - PRACTICE PAPER 3EXERCISE - Practice Paper 3
46 Videos
- PRACTICE PAPER 2BOOK - NCERT FINGERTPS ENGLISHCHAPTER - PRACTICE PAPER 2EXERCISE - Practice Paper 2
44 Videos
- REDOX REACTIONSBOOK - NCERT FINGERTPS ENGLISHCHAPTER - REDOX REACTIONSEXERCISE - Assertion And Reason
15 Videos
Similar Questions
Knowledge Check
The graph of PV vs P for a gas is
AparabolicBhyperbolicCa straight line parallel to X-axisDa straight line passing through originVolume : Temperature relationship is given by
ABoyleBGay LussacCDaltonDCharlesThe given figure represent the V.S. of bulbs of Allium cepa identify the different parts and select the correct options
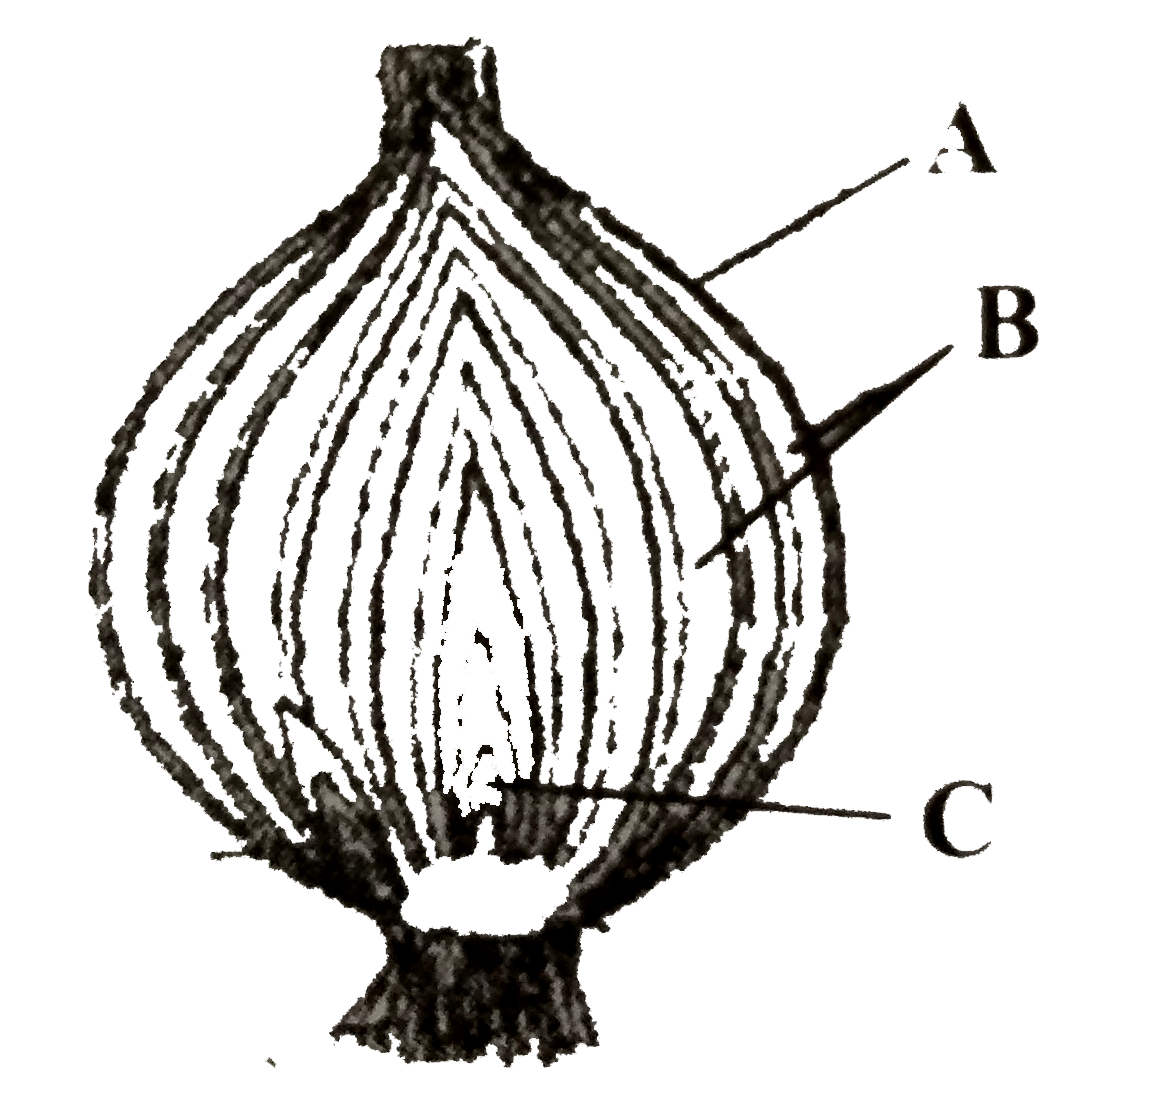 A A B CFleshy scalesTunicTerminal budB A B CTunicTerminal budFleshy scalesC A B CTunicFleshy scalesTerminal budD A B CTerminal budFleshy scalesTunic
The plot of PV vs P at particular temperature is called isovbar.
View SolutionThe graph betwene P and V at constant temperature should look like
View SolutionThe current (I) and voltage (V) graphs for a given metallic wire at two different temperature (T1) and (T2) are shown in fig. It is concluded that
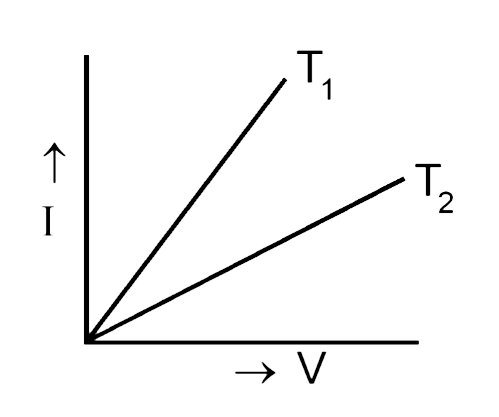
View SolutionThe graph between PV vs P at constant temperature is linear parallel to the pressure axis.
View SolutionA graph plotted between Pdvsd (where p is osmotic pressure of solution of a solute of mol. Wt. m and d is its density temperature T. Pick out the correct statements about the plots :
View Solution

