The plot of logk vs 1/T helps to calculate
Energy of activation
Rate constant of the reaction
Order of the reaction
Energy of activation as well as the frequency factor
The correct Answer is:D
According to Arrhenius equation
log k=logA−Ea2.303R.1T
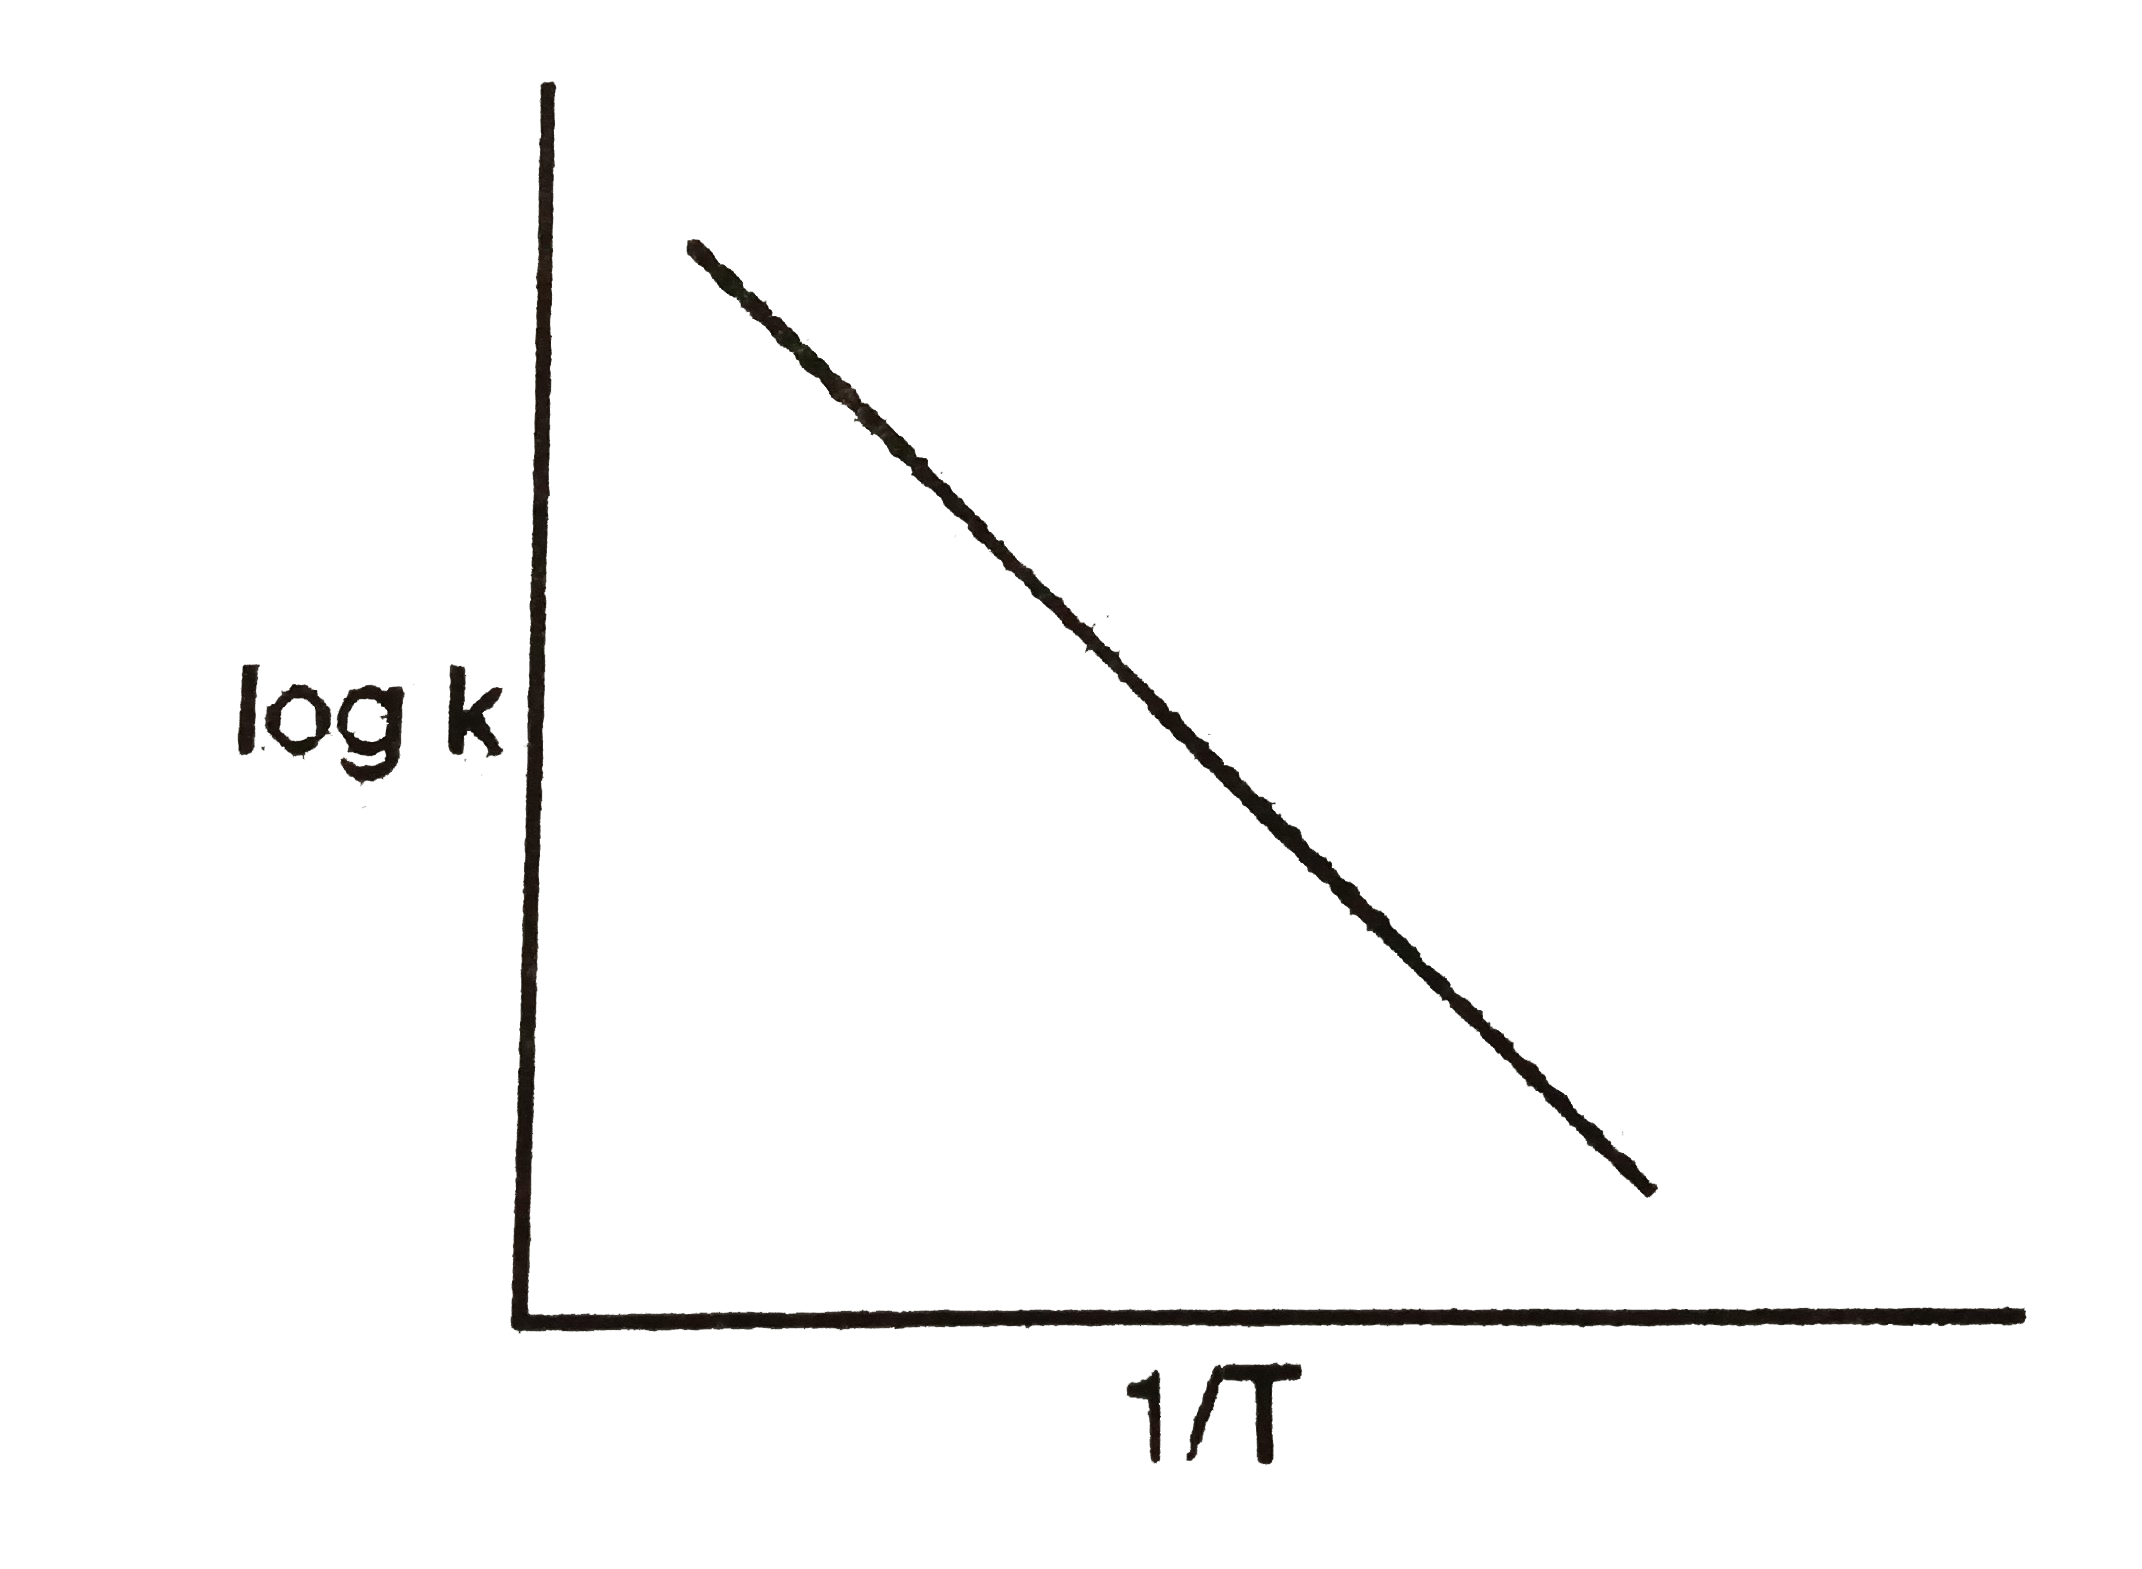
Plot of log k vs. 1T is a st. line
Slope =−Ea2.303R
Intercept = logA.
Topper's Solved these Questions
- BOOK - DINESH PUBLICATIONCHAPTER - RATES OF REACTIONS AND CHEMICAL KINETICSEXERCISE - Revision Question168videos
RATES OF REACTIONS AND CHEMICAL KINETICS
- BOOK - DINESH PUBLICATIONCHAPTER - RATES OF REACTIONS AND CHEMICAL KINETICSEXERCISE - Selected Straight49videos
RATES OF REACTIONS AND CHEMICAL KINETICS
- BOOK - DINESH PUBLICATIONCHAPTER - PHYSICAL AND CHEMICAL EQUILIBRIAEXERCISE - ULTIMATE PREPARATORY PACKAGE13videos
PHYSICAL AND CHEMICAL EQUILIBRIA
- BOOK - DINESH PUBLICATIONCHAPTER - REDOX REACTIONSEXERCISE - Reasoning Type Questions4videos
REDOX REACTIONS
Similar Questions
For the reaction aA+bB→cC+dD, the plot of log k vs 1T is given below,
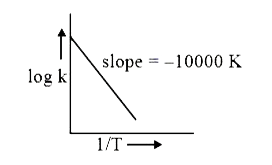
The temperature at which the rate constant of the reaction is 10−4s−1 is _____K.
(Rouded -off the nerest integer)
[Given : The rate constant of the reaction is 10−5s−1 at 500 K.]View SolutionDraw the plot log V vs log T.
View Solution
Knowledge Check
- Question 1 - Select One
The plot og logk vs 1/T helps to calculate
AThe energy of activationBThe rate constant of the reactionCThe order of the reactionDThe energy of activations as well as the frequency factor - Question 2 - Select One
The plots of log10Kvs.1/T leads toa straight line having intercept equal to:
AΔG∘BΔG∘2.303RCΔS∘2.303RDΔH∘2.303R - Question 3 - Select One
A graph plotted between logk versus 1/T for calculating activation energy is shown by
A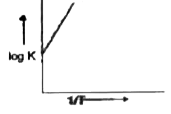 B
B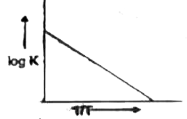 C
C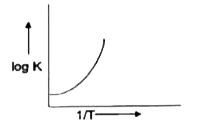 D
D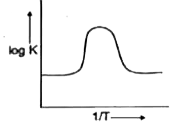
A graph plotted between logk versus 1/T for calculating activation energy is shown by
View SolutionWhen a plot of log k versus 1/T of chemical reaction is made, the energy of activation is given by the slope of straight line
View SolutionA graph plotted between logk versus 1/T for calculating activation energy is shown by
View SolutionFor a first order reaction, the plot of log k against 1/T is a straight line. The slope of the line is equal to
View SolutionWhich of the plots of ln K vs (1T) is/are correct?
View Solution

