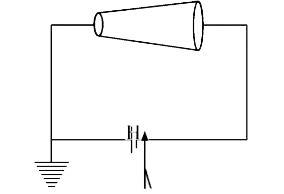
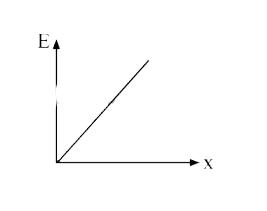
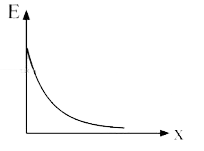
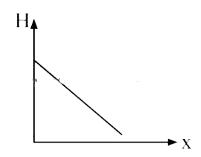
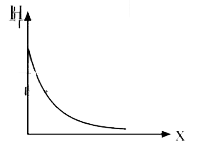
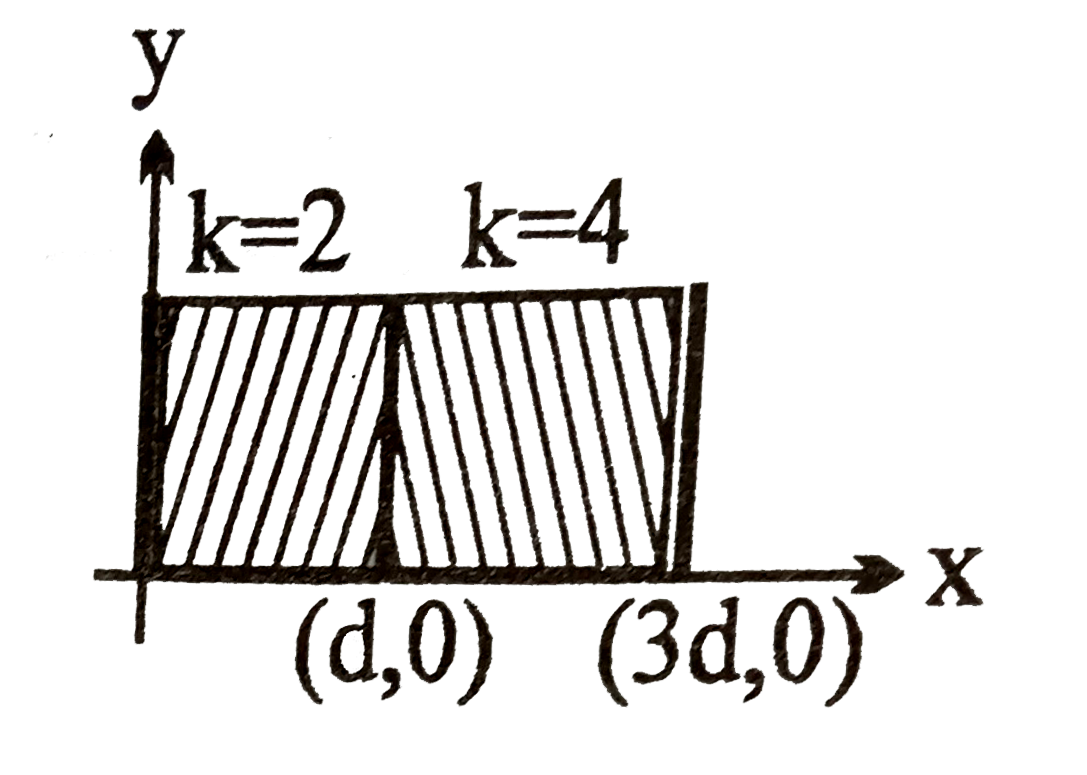
A conductor is made of an isotropic material and has shape of a truncated cone. A battery of constant emf is connected across it and its left end is earthed as shown. If at a certain section at a distance x form left end, electric field intensity and the rate of generation of heat per unit length are E and H respectively, which of the following graphs is (are) correct?
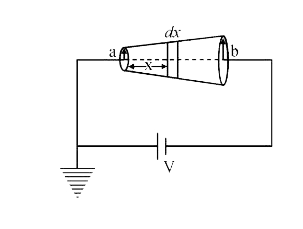
r=a+(b−al)x
Let p resistivity of the material
⇒ Resistance of the cone =∫l0pdx([a+b−al)x]2⎞⎟
⎟⎠=plπab
⇒i= current flowing in the wire =πabVpl
Rotating charge is equivalent to current dx⇒dR=pdx(π[a+b−cl)x]2⎞⎟
⎟⎠
⇒dv=⇒dV=ipdxA where A=π[a+b−al)x]2
⇒E=dVdx=piA⇒ B is correct and H=i2dR⇒dQdx=i2pA⇒ (D) is correct
Similar Questions
A conductor is made of an isotropic material and has shape of a truncated cone. A battery of constant emf is connected across it and its left end is earthed as shown in figure. If at a section distant x from left end electric field intensity potential and the rate of generation of heat per unit length are E V and H respectively which of the following graphs is/are correct?
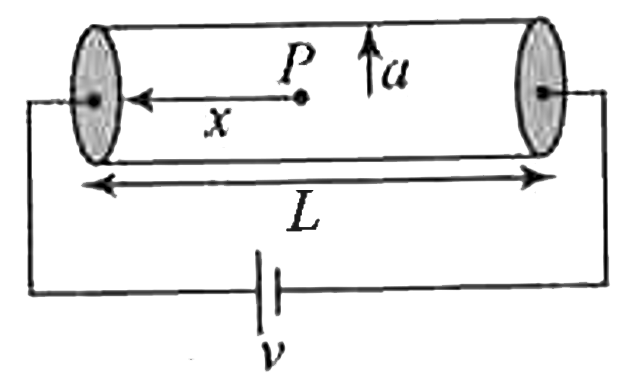
View SolutionA cylindrical solid of length L and radius a is connected across a source of emf V and negligible internal resistance shown in figure. The resistivity of the rod at point P at a distance x from left end is given by ρ=bx (where b is a positive constant). Find the electric field at point P.
View Solution
Knowledge Check
A conductor of resistivity ρ and resistance R, as shown in the figure, is connected across a battery of emf V. Its radius varies from a at left end to b at right end. The electric field at a point P at distance x from left end of it is
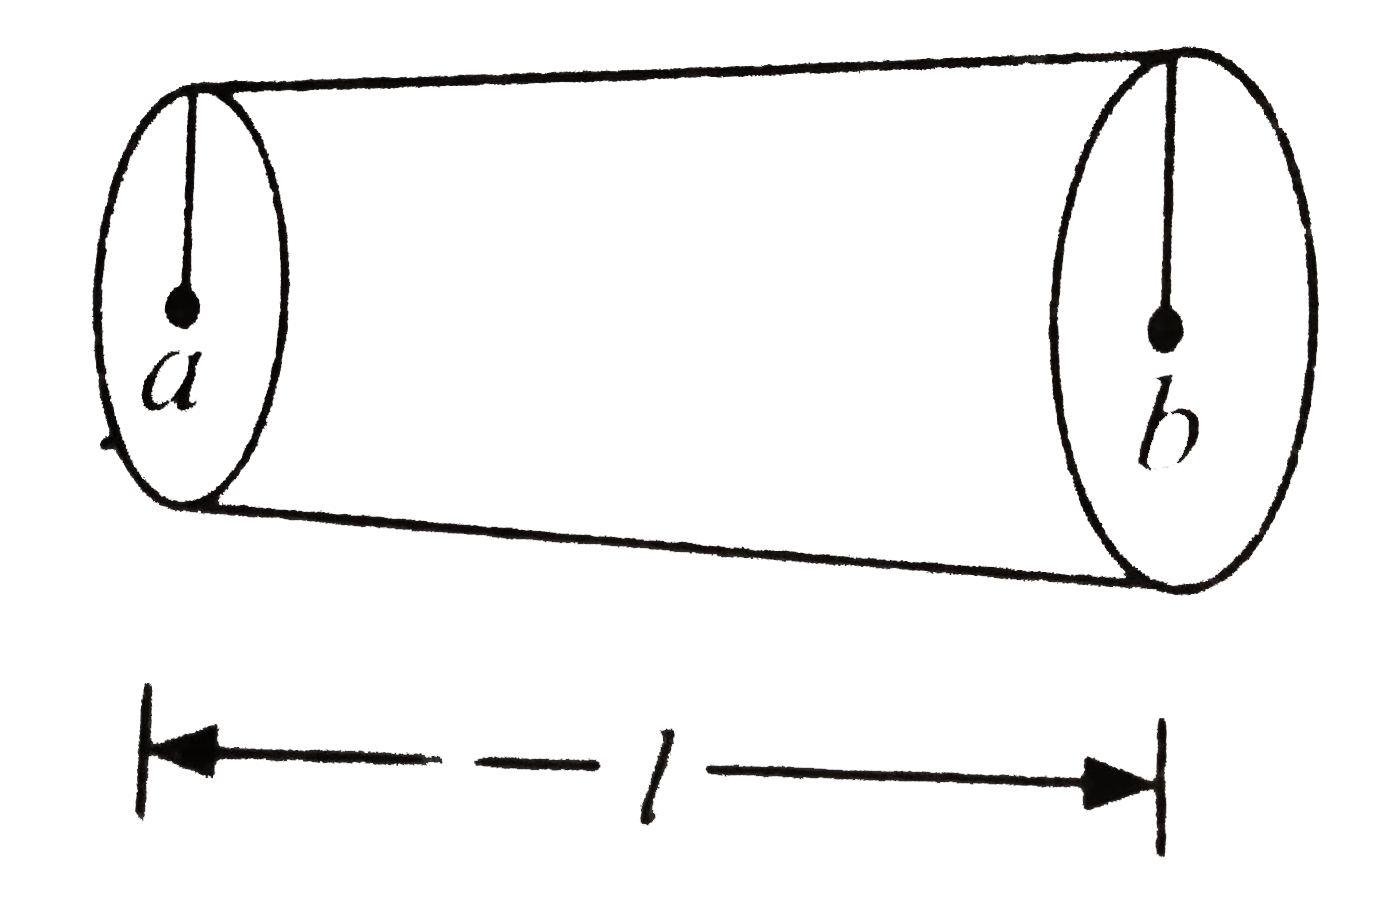 AVI2ρπR[Ia+(b−a)x]2B2VI2ρπR[Ia+(b+a)x]2CVI2ρ2πR(Ia+(b−a)x)2Dnone of these
A cylindrical conductor has uniform cross-section. Resistivity of its material increase linearly from left end to right end. If a constant current is flowing through it and at a section distance x from left end, magnitude of electric field intensity is E , which of the following graphs is correct
A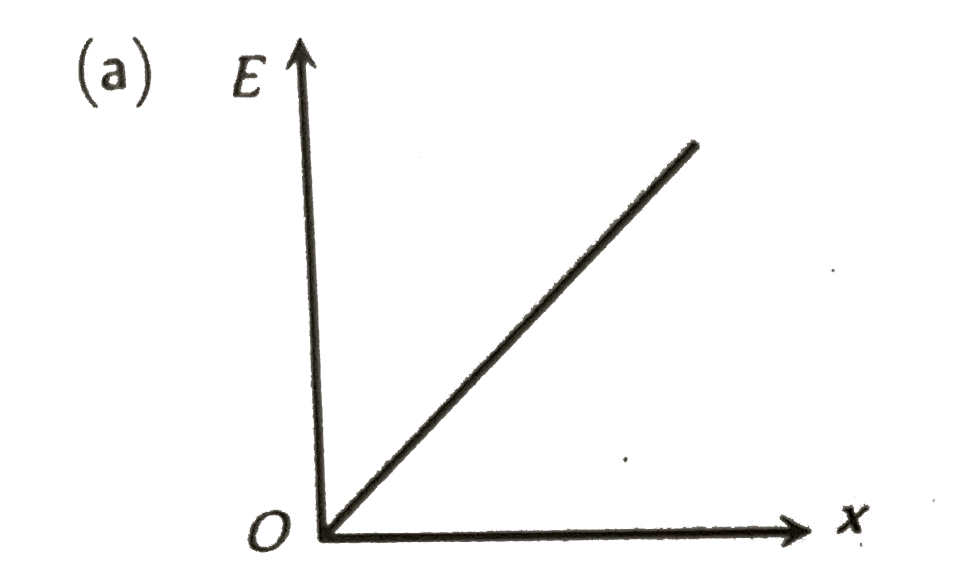 B
B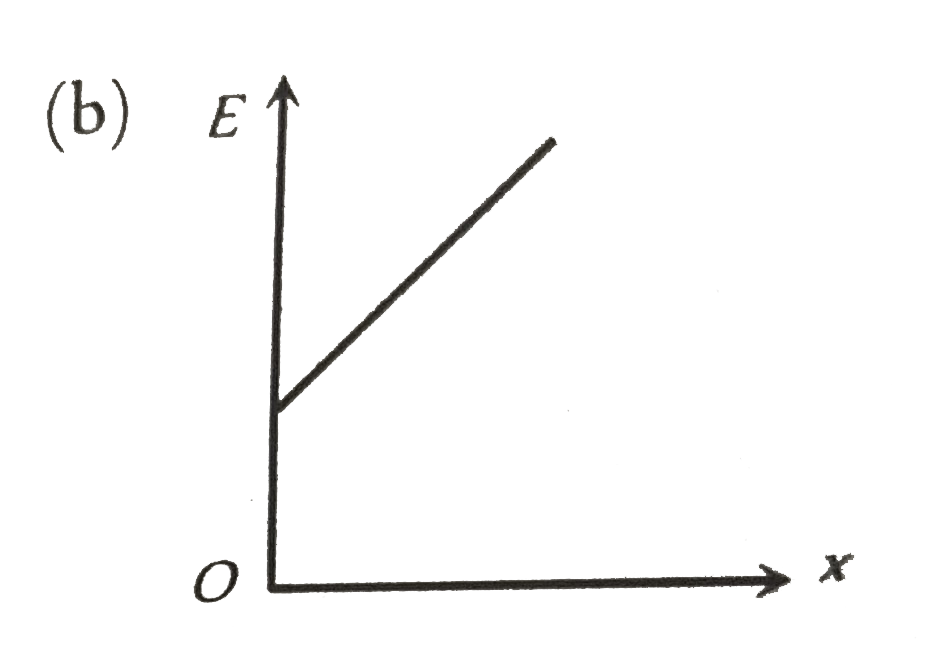 C
C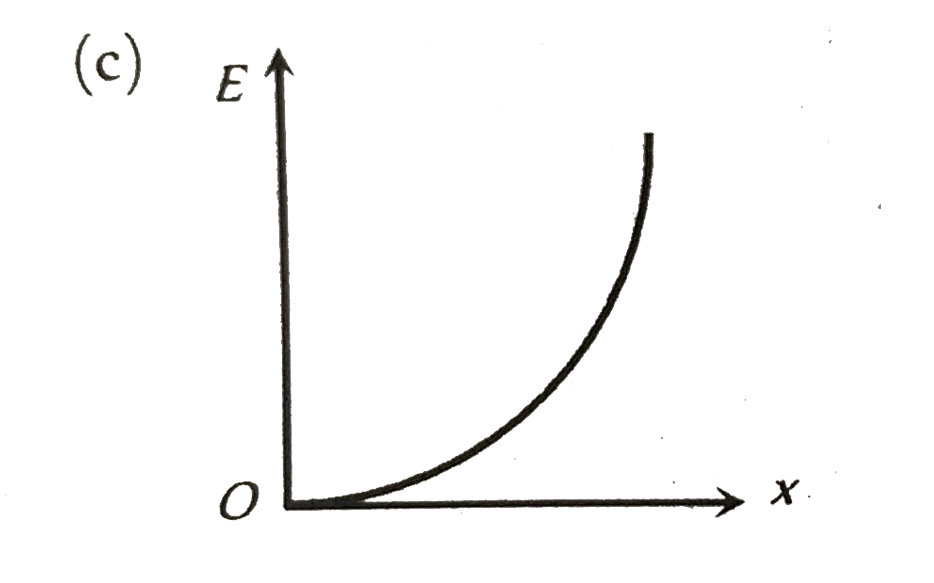 D
D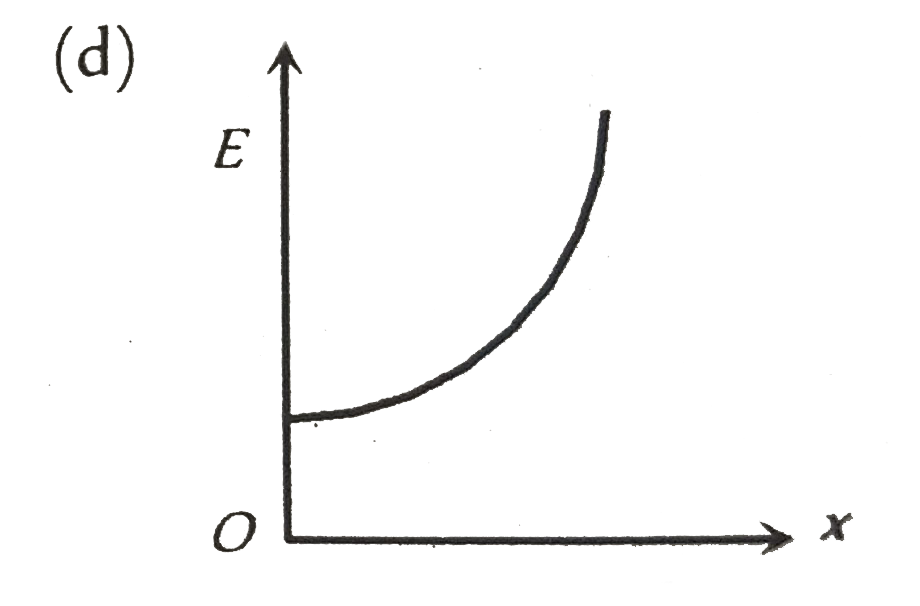
A cylindrical conductor has uniform cross-section. Resistivity of its material increase linearly from left end to right end. If a constant current is flowing through it and at a section distance x from left end, magnitude of electric field intensity is E , which of the following graphs is correct
A
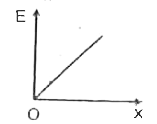 B
B
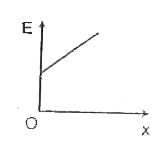 C
C
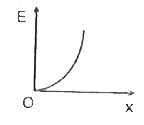 D
D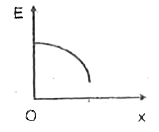
A conductor of length L is placed along the x - axis , with one of its ends at x = 0 and the other at x = L. If the rate of flow of heat energy through the conduct is constant and its thermal resistance per unit length is also constant , then Which of the following graphs is/are correct ?
View SolutionA parallel plate capacitor has two layers of dielectric as shown in figure. This capacitor is connected across a battery. The graph which shows the variation of electric field (E) and distance (X) from left plate.
View SolutionRadius of a conductor increases uniformly from left end to right end as shown in fig.
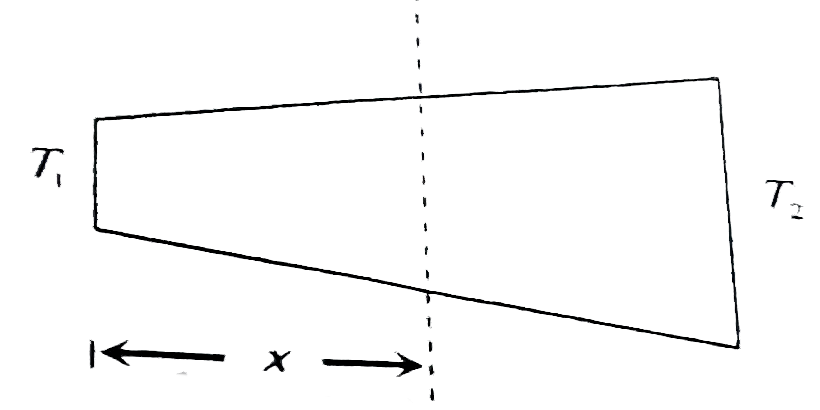
Material of the conductor is isotropic and its curved surface is thermally isolated from surrounding. Its ends are maintained at temperatures T1 and T2(T1>T2): If, in steady state, heat flow rate is equal to H , then which of the following graphs is correct
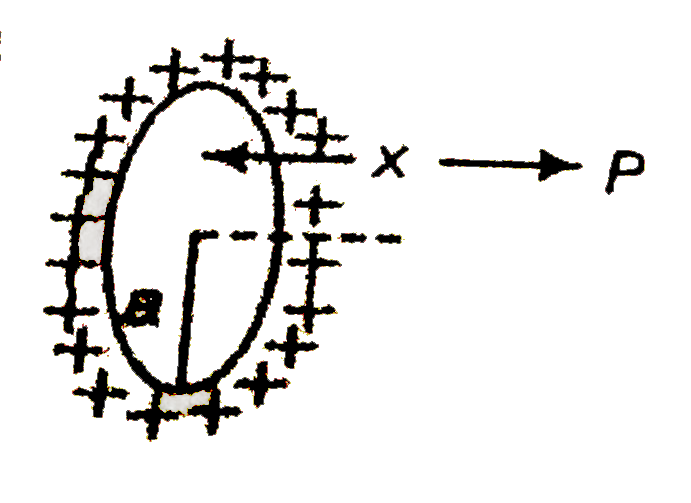
View SolutionA ring shaped conductor with radius a carries a net positive charge q uniformly distributed on it as shown in figure. A point P is situated at a distance x from its centre. Which of following graph shows the correct variation of electric field (E) wilth distance (x)?
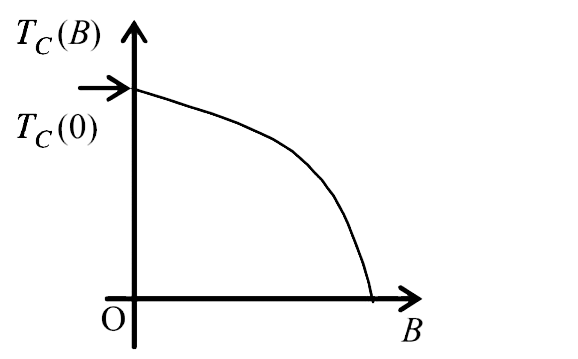
View SolutionElectrical resistance of certain materials, known as superconductors, changes abruptly from a nonzero value of zero as their temperature is lowered below a critical temperature TC(0). An interesting property of super conductors is that their critical temperature becomes smaller than TC(0) if they are placed in a magnetic field, i.e., the critical temperature TC(B) is a function of the magnetic field strength B. The dependence of TC(B) on B is shown in the figure.
 .
.
In the graphs below, the resistance R of a superconductor is shown as a function of its temperature T for two different magnetic fields B1(solid line) and B2 (dashed line). If B2 is larget than B1 which of the following graphs shows the correct variation of R with T in these fields?
View Solution
