At a give lunch period, 75% of the students buying lunch selected pizza. 60% of the students who did not select pizza selected chicken nuggets. What percent of the students selected something other than pizza or chicken nuggets ?
0
0.1
0.15
0.25
The correct Answer is:B
To solve the problem step by step, we can follow these calculations:
1. Assume Total Students: Let's assume there are 100 students in total. This makes it easier to work with percentages.
2. Calculate Students Selecting Pizza: According to the problem, 75% of the students selected pizza.
Number of students selecting pizza=75% of 100=75100×100=75 students
3. Calculate Students Not Selecting Pizza: The number of students who did not select pizza is:
Number of students not selecting pizza=100−75=25 students
4. Calculate Students Selecting Chicken Nuggets: It is given that 60% of the students who did not select pizza selected chicken nuggets. Therefore, we calculate:
Number of students selecting chicken nuggets=60% of 25=60100×25=15 students
5. Calculate Students Selecting Something Other Than Pizza or Chicken Nuggets: The remaining students selected something other than pizza or chicken nuggets. We can find this by subtracting the number of students who selected pizza and chicken nuggets from the total number of students:
Number of students selecting something else=100−(75+15)=100−90=10 students
6. Calculate the Percentage of Students Selecting Something Other Than Pizza or Chicken Nuggets: Finally, to find the percentage of students who selected something other than pizza or chicken nuggets:
Percentage=(10100)×100%=10%
Thus, the final answer is that 10% of the students selected something other than pizza or chicken nuggets.
Number of students selecting pizza=75% of 100=75100×100=75 students
Number of students not selecting pizza=100−75=25 students
Number of students selecting chicken nuggets=60% of 25=60100×25=15 students
Number of students selecting something else=100−(75+15)=100−90=10 students
Percentage=(10100)×100%=10%
Topper's Solved these Questions
- BOOK - ENGLISH SATCHAPTER - ELEMENTARY ALGEBRAEXERCISE - EXERCISE12videos
ELEMENTARY ALGEBRA
- BOOK - ENGLISH SATCHAPTER - DIAGNOSTIC TEST EXERCISE - MCQs (EXERCISE)50videos
DIAGNOSTIC TEST
- BOOK - ENGLISH SATCHAPTER - EXPONENTIAL AND LOGARITHMIC FUNCTIONS EXERCISE - Exercises10videos
EXPONENTIAL AND LOGARITHMIC FUNCTIONS
Similar Questions
There are 60% students in Maths and 30% in Biology. If 10% students are in both subjects. Find the probability that a randomly selected student has Maths or Biology.
View SolutionIn a certain college, 4% of boys and 1% of girls are taller than 1.75 metres. Furthermore, 60% of the students in the college are girls. A student is selected at random from the college and is found to be taller than 1.75 metres. Find the probability that the selected student is a girl.
View Solution
Knowledge Check
- Question 1 - Select One
The Harrisburg Recreation Center recently changed its hours to open 1 hour later and close 3 hours later than it had previously. Residents of Harrisburg age 16 or older were given a survey and 560 residents replied. The survey asked each resident his or her student status (high school, college, or nonstudent) and what he or she thought about the change in hour (approve, disapprove, or no opinion). The results are summarized in the table below.

After constructing the table, it was discovered that the student status of 15 residents who replied that they approved had been incorrectly classified as nonstudents. After correcting the errors, exactly 60% of the college students had replied that they approved. To the nearest 1%, what percent of high school students replied that they approved?A0.6B0.67C0.7D0.75
In a certain college, 4% of boys and 1% of girls are taller than 1.75 metres. Furthermore, 60% of the students in the college are girls. A student is selected at random from the college and is found to be taller than 1.75 metres. Find the probability that the selected student is a girl.
View SolutionIn a hostel 60% of the students read Hindi news paper, 40% read English newspaper and 20% read both Hindi and English newspapers. A student is selected at random.Find the probability that she reads neither Hindi nor English news paper ?
View Solution
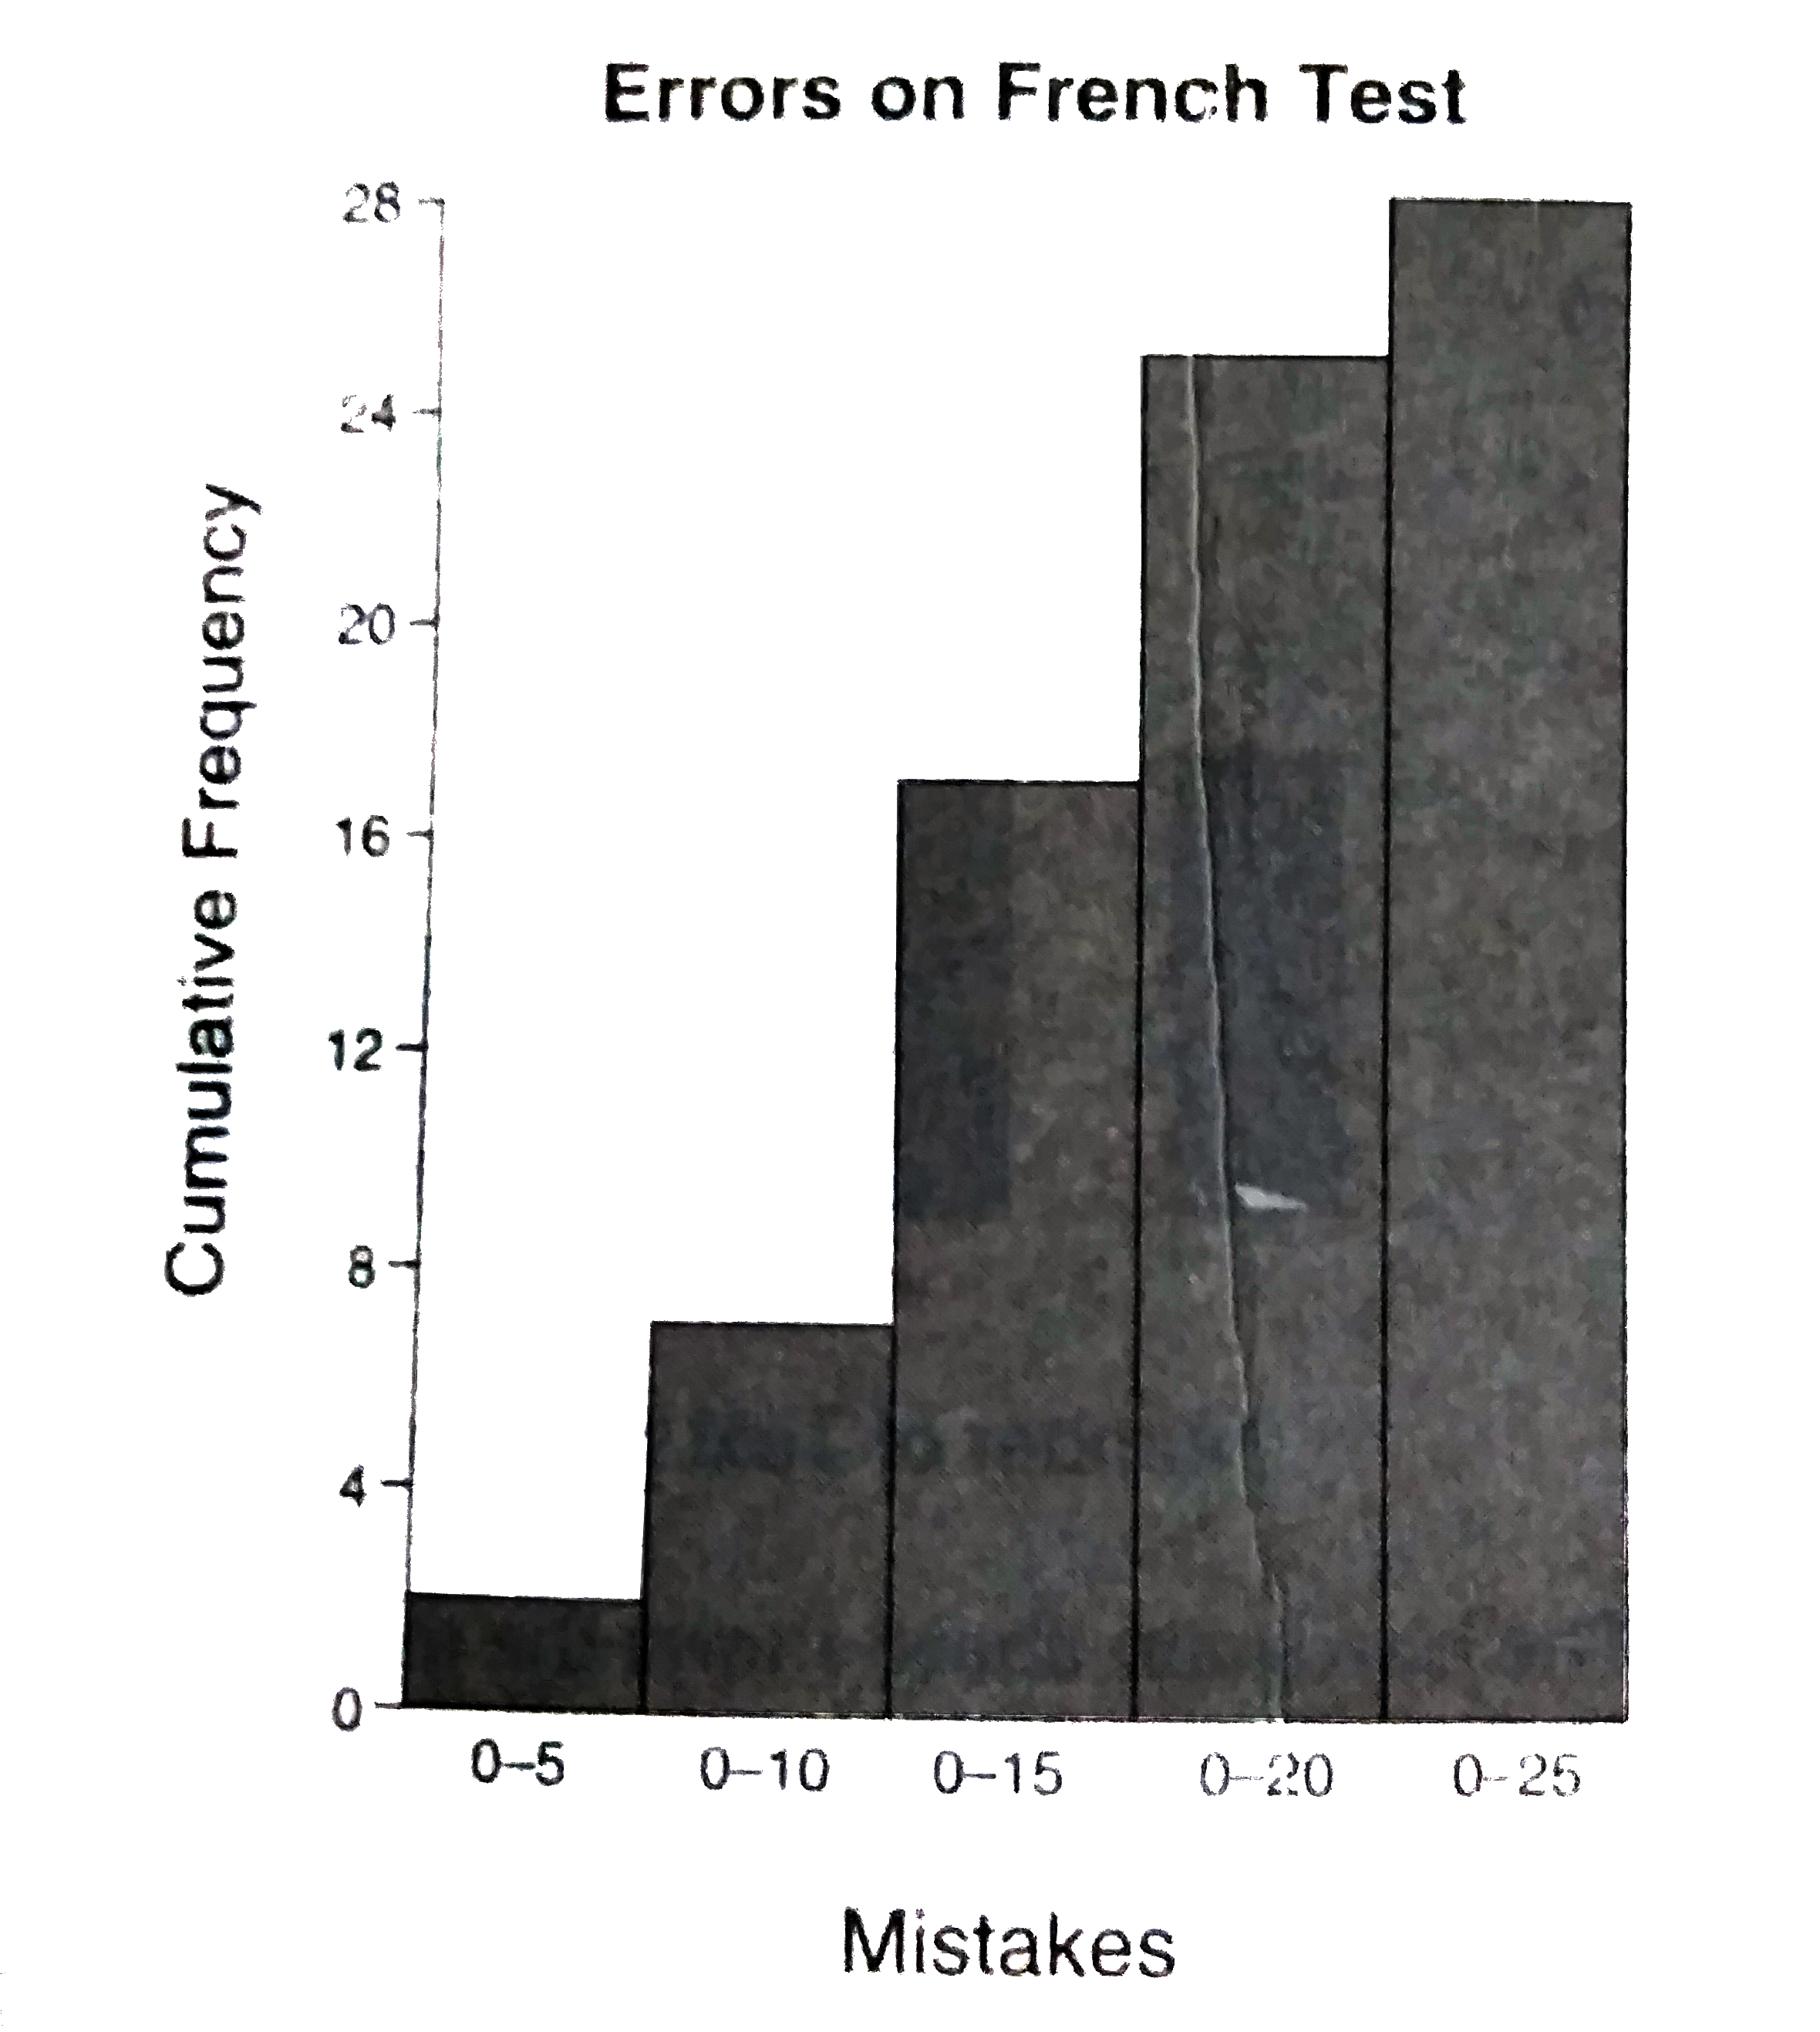
The cumulative histogram above shows the distribution of mistakes 28 students in a French languge class made on a test. What is the probability that a student selected at random made more than 10 mistakes?View SolutionIn Class XI of a school 40% of the students study Mathematics and 30% study Biology. 10% of the class study both Mathematics and Biology. If a student is selected at random from the class, find the probability that he will be studying Mathematics or Biology.
View SolutionIn class XI of a school 40% of the students study Mathematics and 30% study Biology. 10% of the class study both mathematics and biology. If a student is selected at random from the class, find the probability that he will be studying Mathematics or Biology or both.
View SolutionIn a hostel 60% of the students read Hindi news paper, 40% read English news paper and 20% read both Hindi and English news papers. A student is selected at random.
(a) Find the probability that she reads neither Hindi nor English news papers.
(b) If she reads Hindi news paper, find the probability that she reads English news paper.
(c) If she reads English news paper, find the probability that she reads Hindi news paper.View SolutionIn a class, 5% of the boys and 10% of the girls have an IQ of more than 150. In this class 60% of the students are boys. If a student is selected at random and found to have an IQ of more than 150, find the probability that the student is a boy.
View Solution

