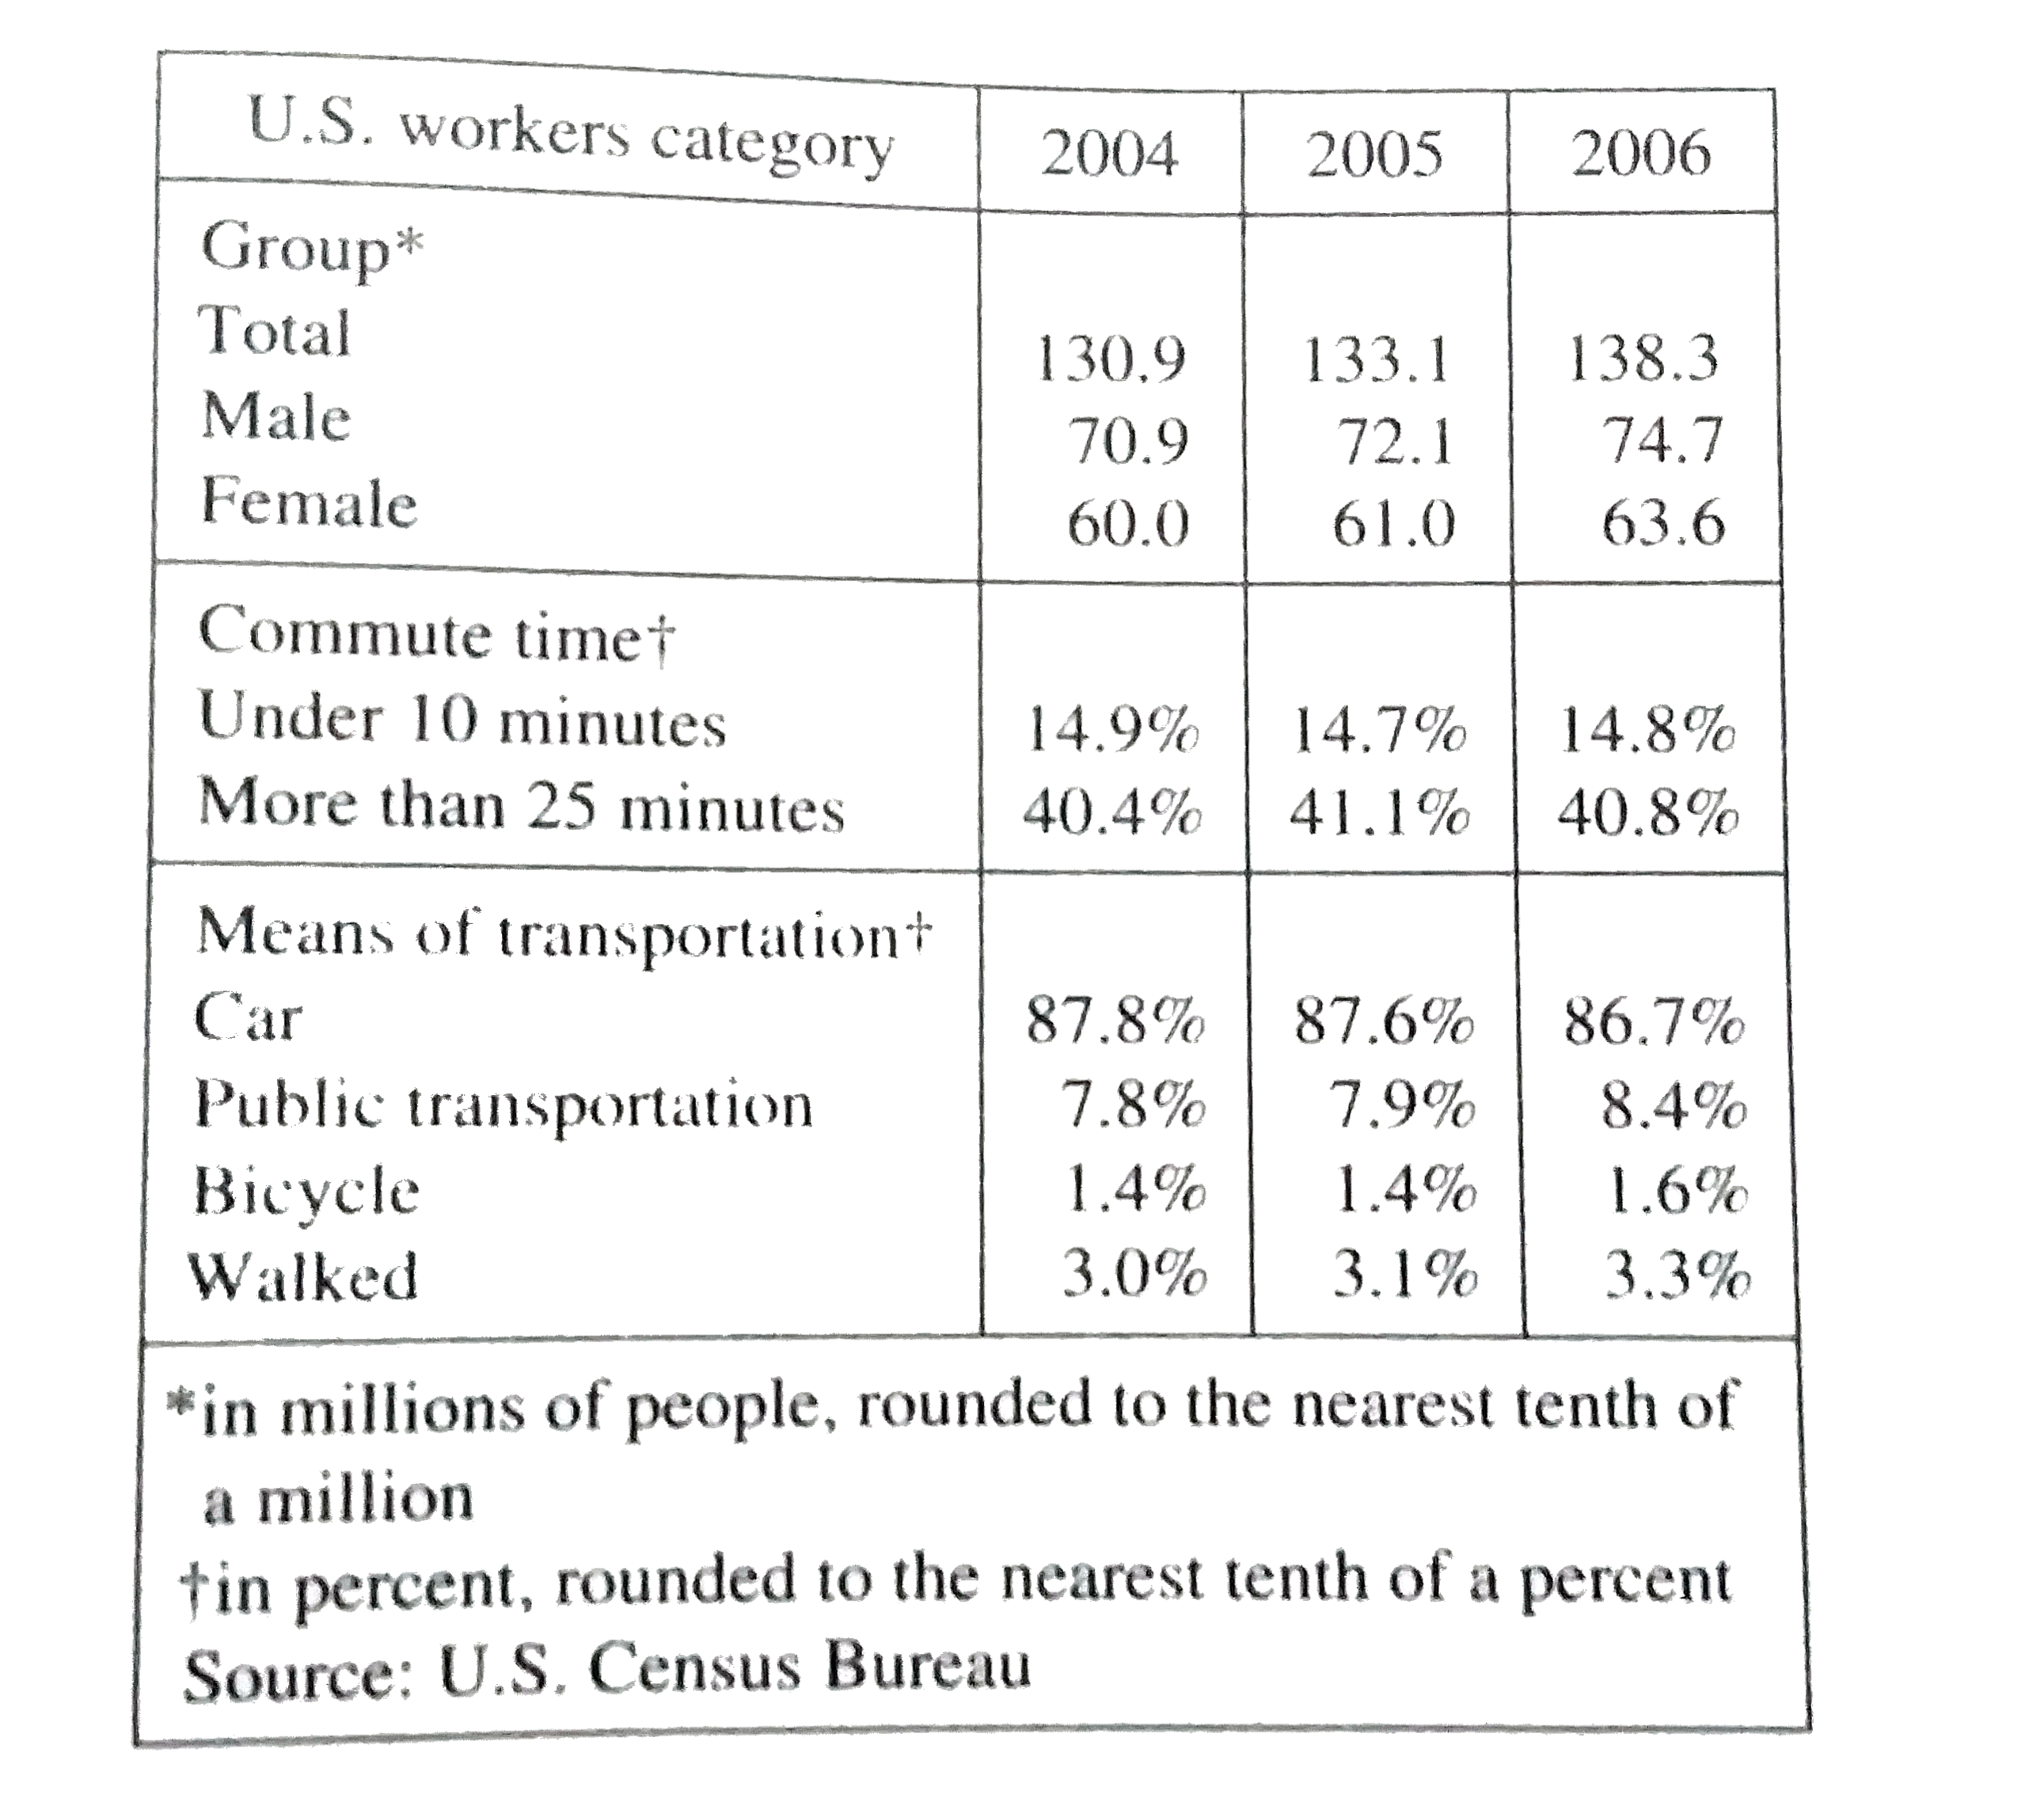
The table below details a recent census report about the commuting habits of U.S . Workers age 16 or over for the years 2004 , 2005 , and 2006.
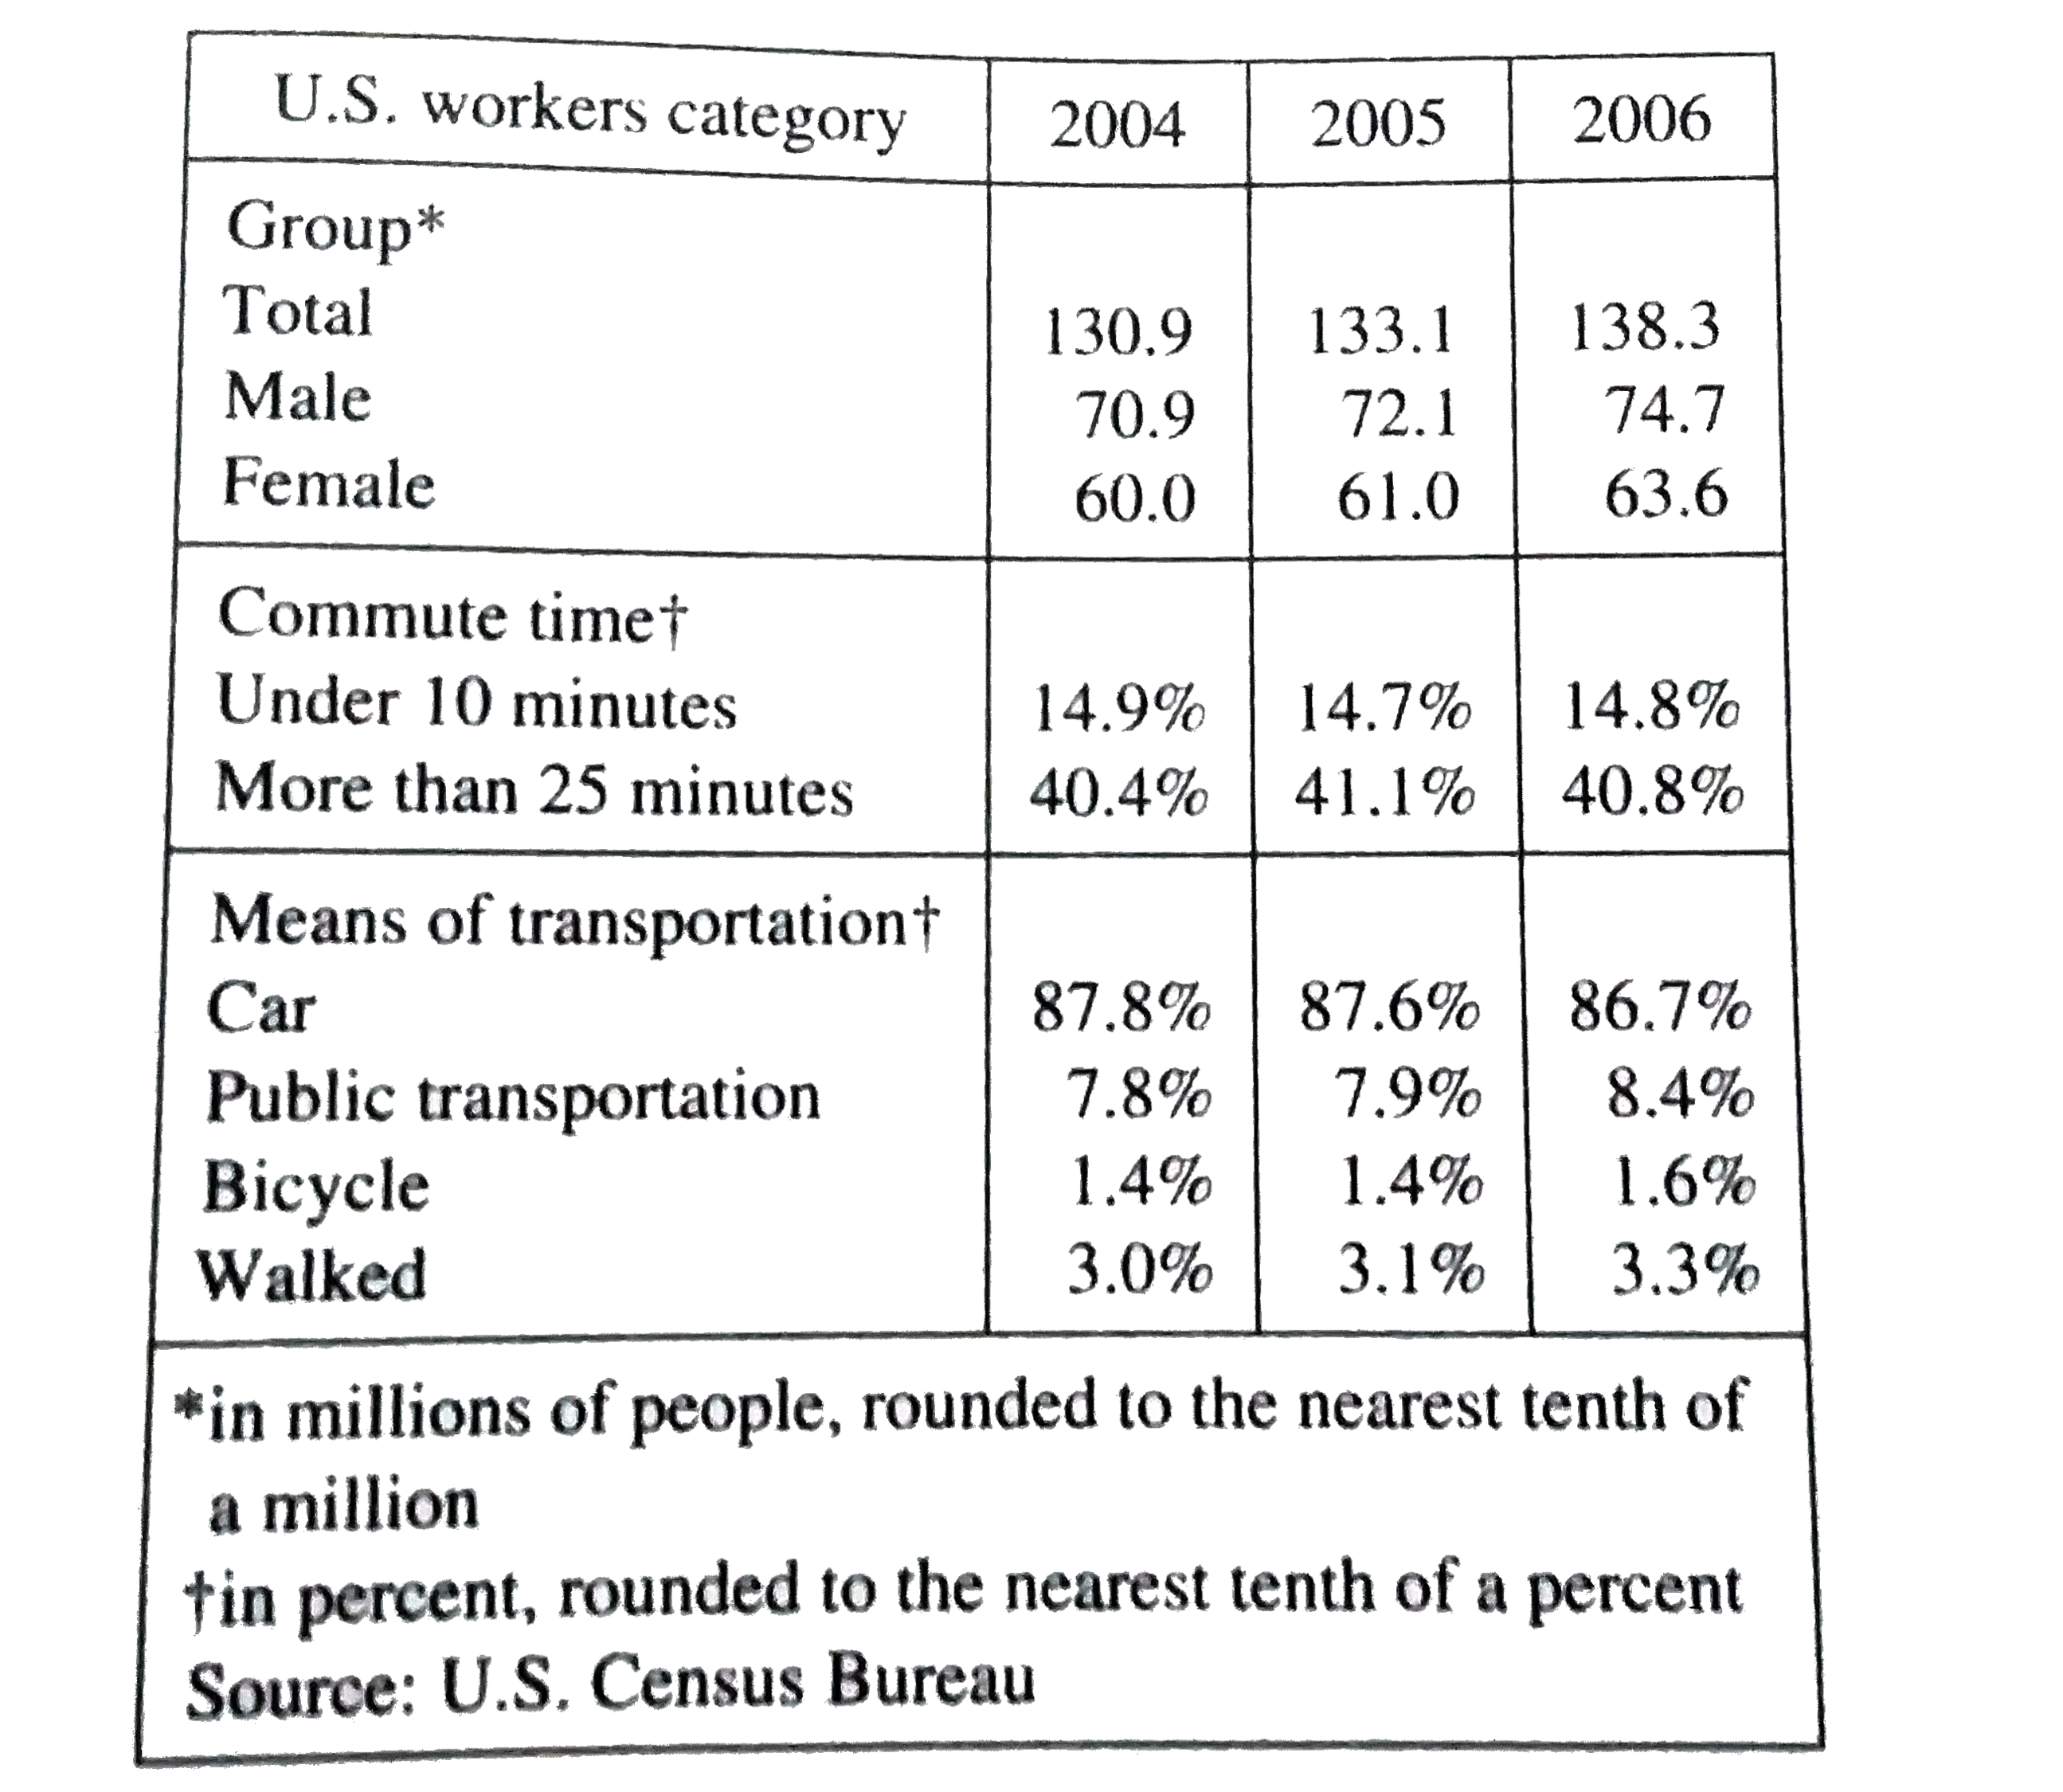
The the nearest percent , what percent of all U.S workers age 16 or over in 2004 was female ?
50%
48%
46%
44%
The correct Answer is:C
Topper's Solved these Questions
Similar Questions
Knowledge Check
The table below details a recent census report about the commuting habits of U.S . Workers age 16 or over for the years 2004 , 2005 , and 2006.
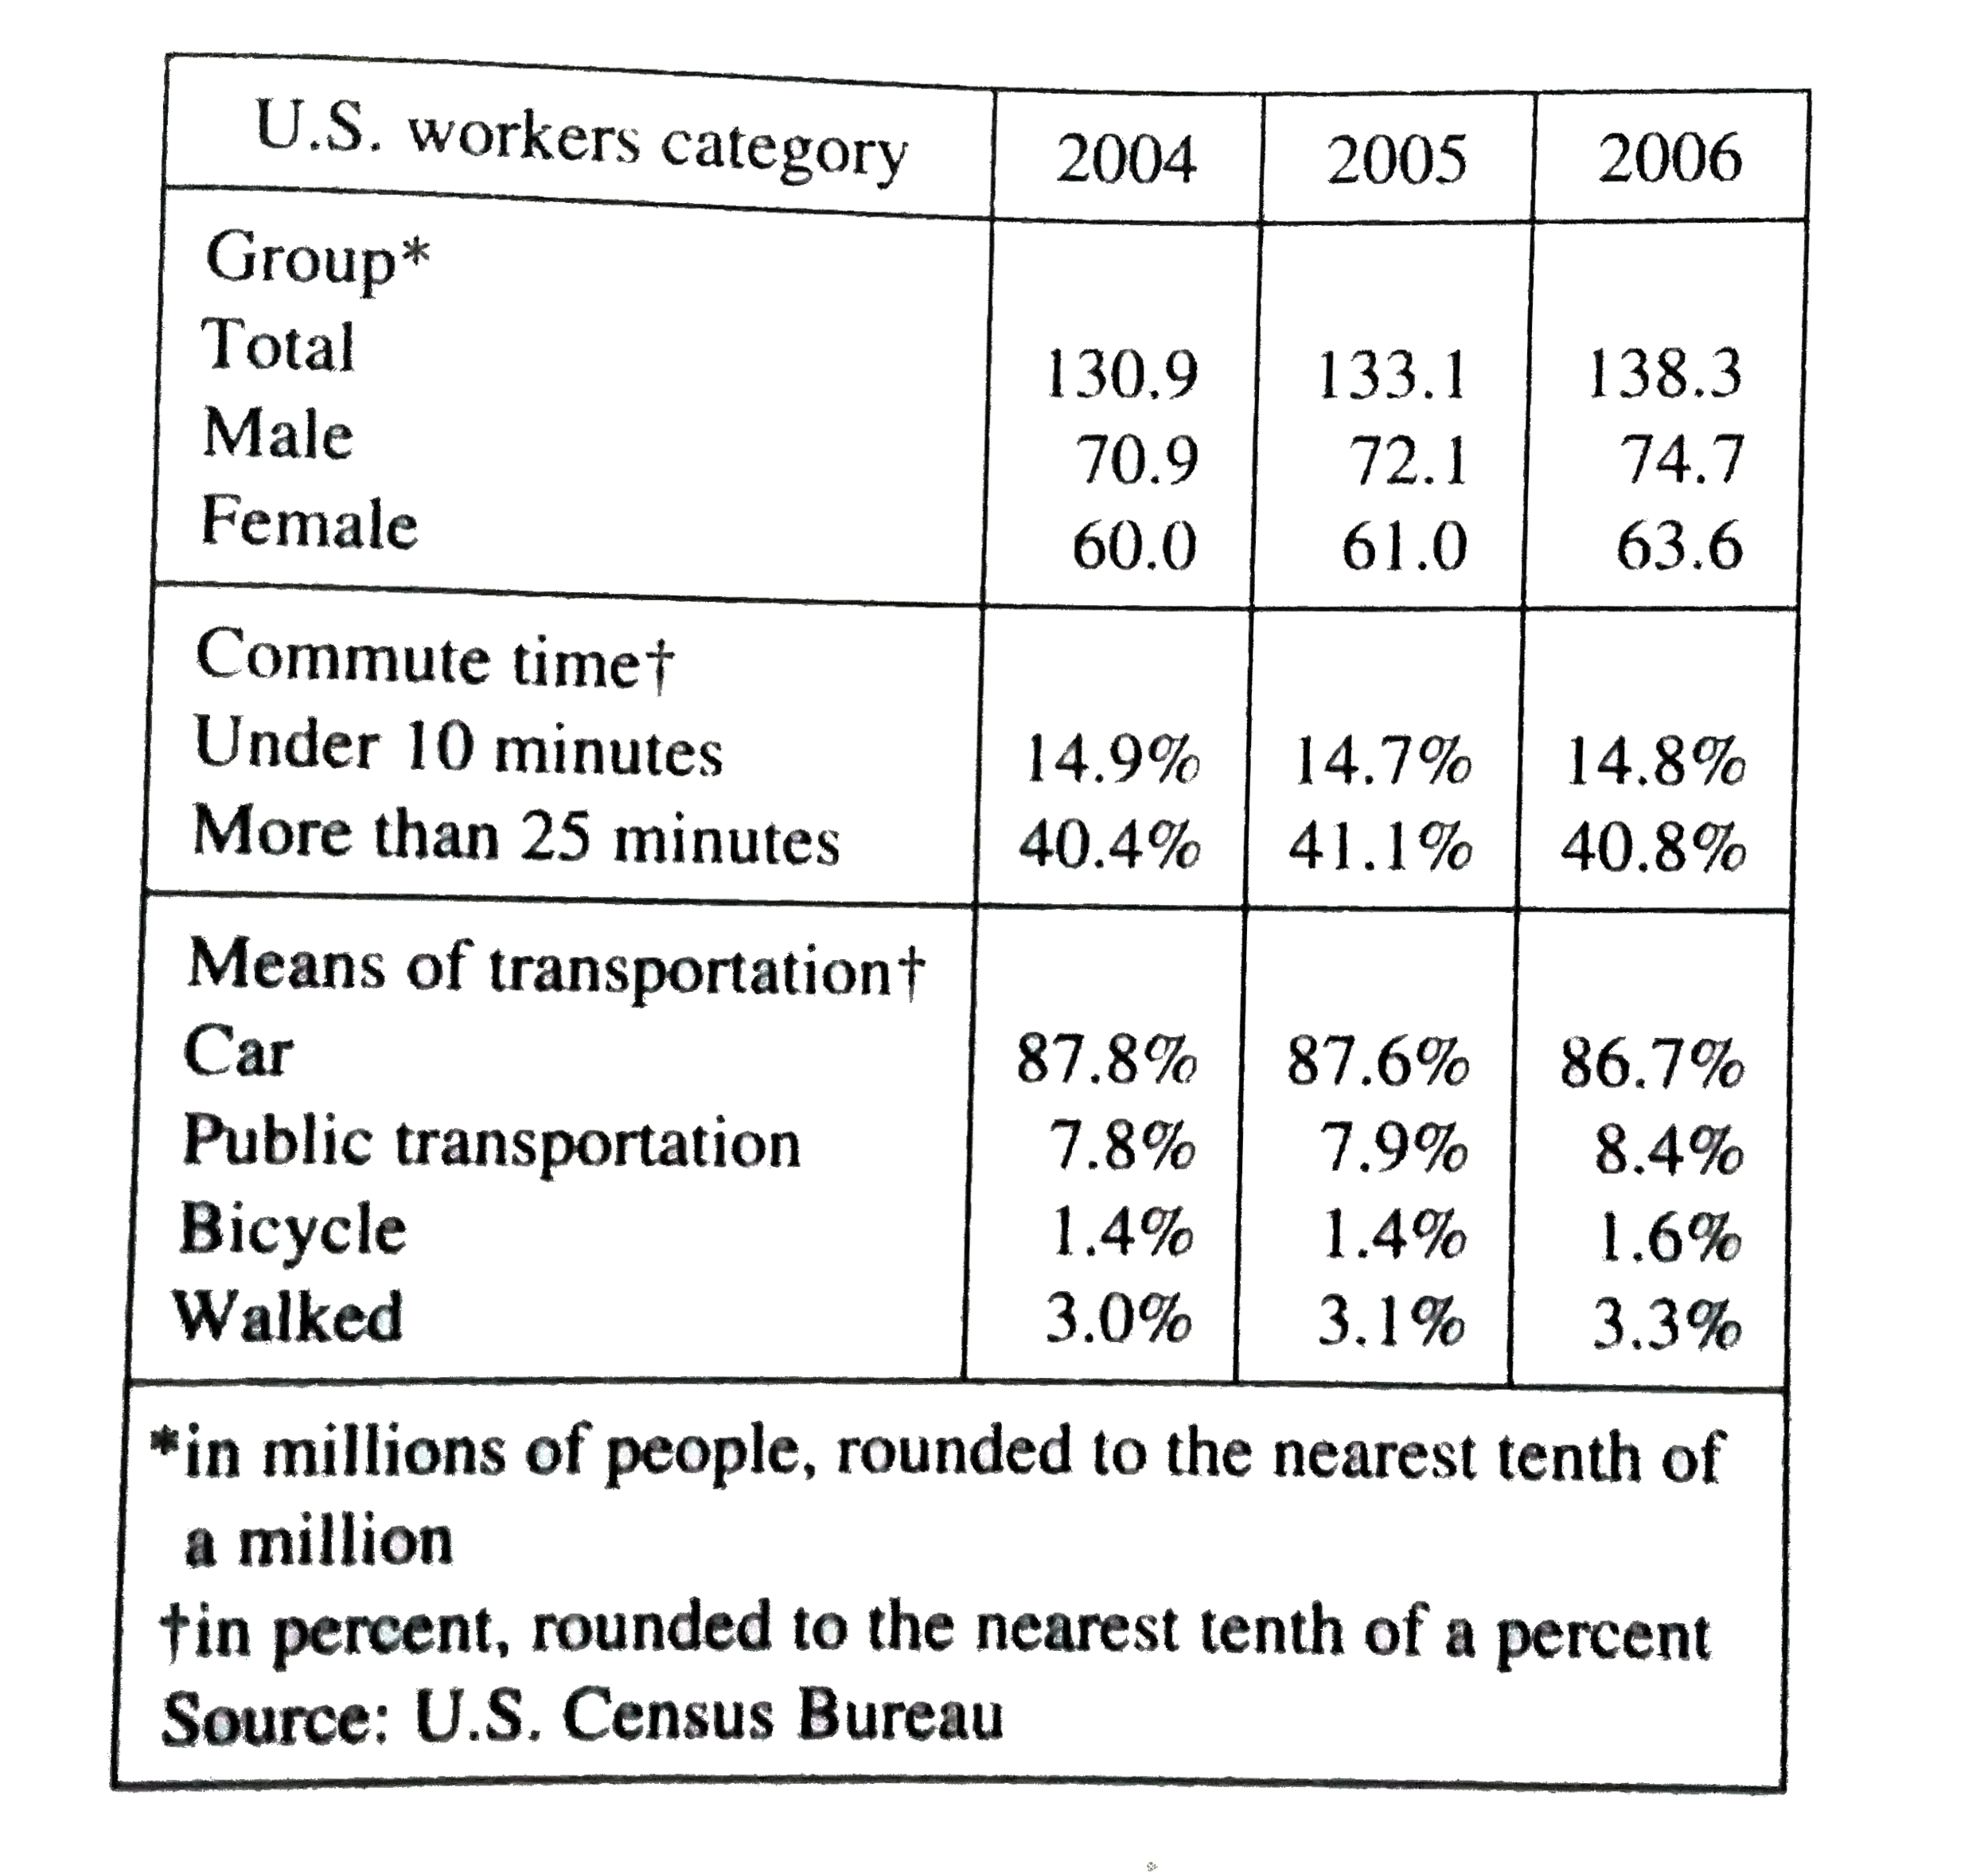
Expressed in millions of people , what was the average growth per year for female U.S workers age 16 or over from 2004 to 2006 , rounded to the nearest 0.1 million ?A0.5B0.9C1.3D1.8The table below details a recent census report about the commuting habits of U.S . Workers age 16 or over for the years 2004 , 2005 , and 2006.
The circle graph (pie chart ) below represents the 2006 means of transportation for U.S . workers age 16 or over for the four transportation types listed . To the nearest degree , What is the measure of the central angle for the " Public " sector ?
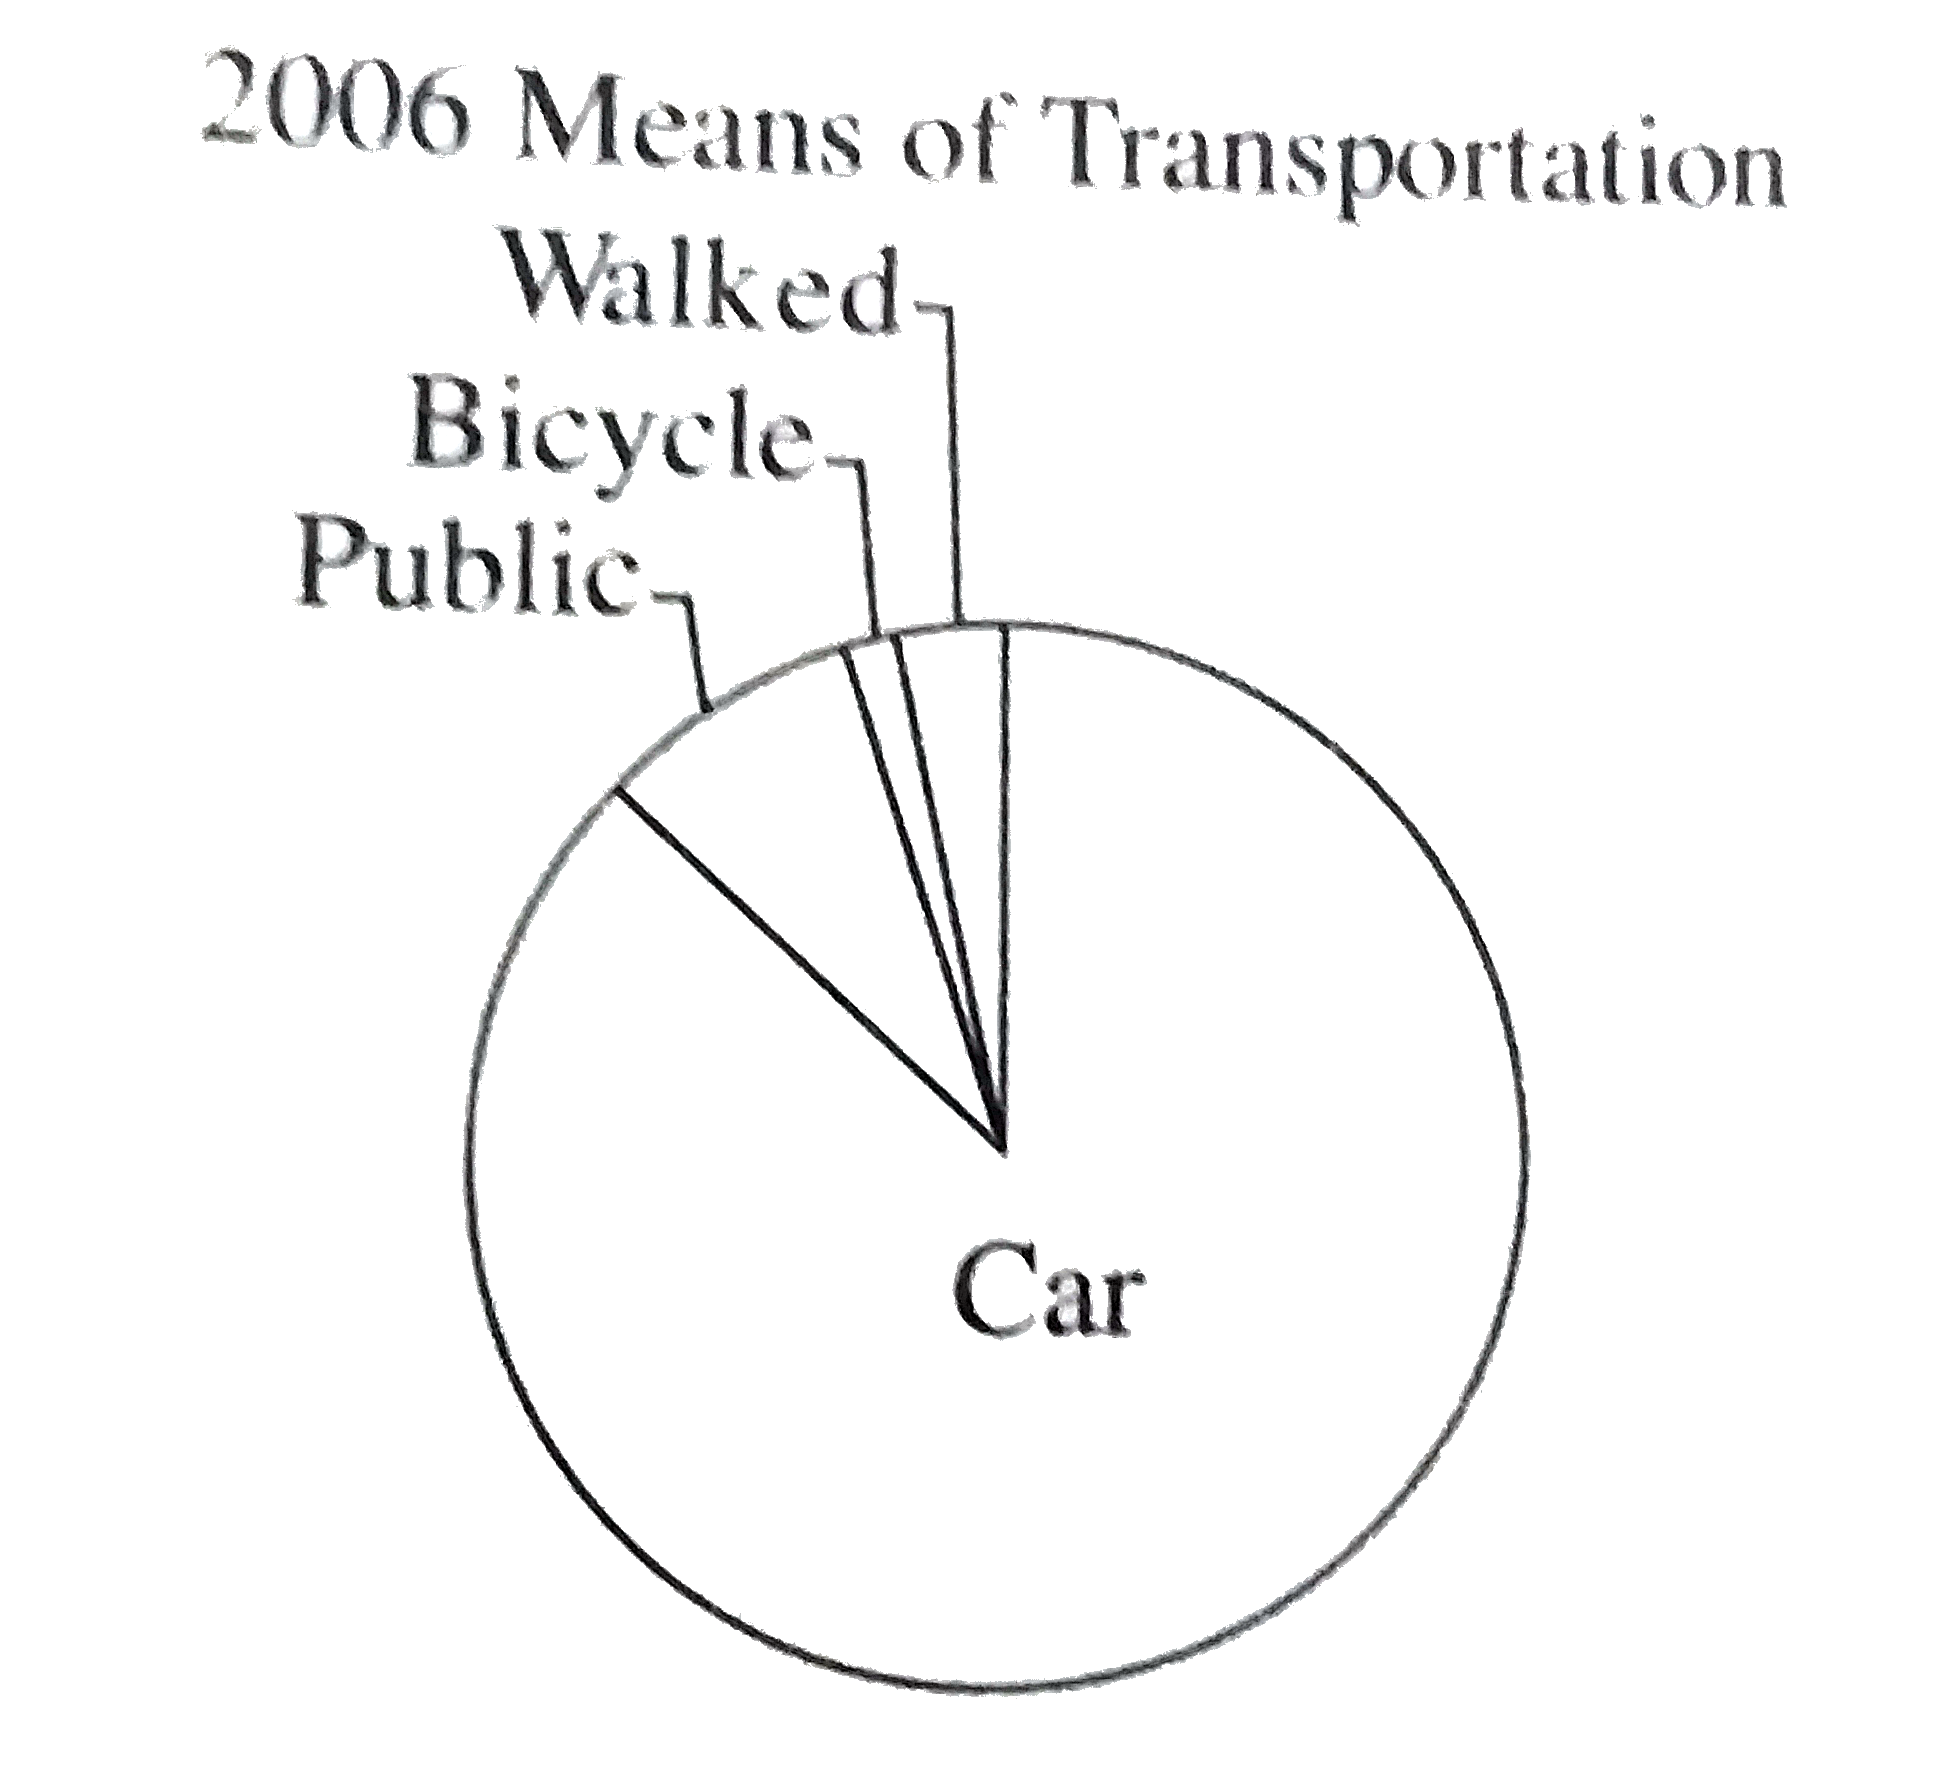 A8∘B12∘C20∘D30∘
If S is 160% of T, then T will be what percent of S?
A0.85B0.625C0.652D0.7
Study the following graph carefully to answer the questions given below it Import and Export of spare parts by an automobile company over the given years
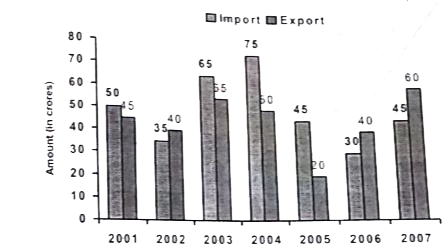
The total exports in the year 2003, 2004 and 2005 together are what percent of the total imports during the same period? (Rounded upto two digits after decimal)
View Solution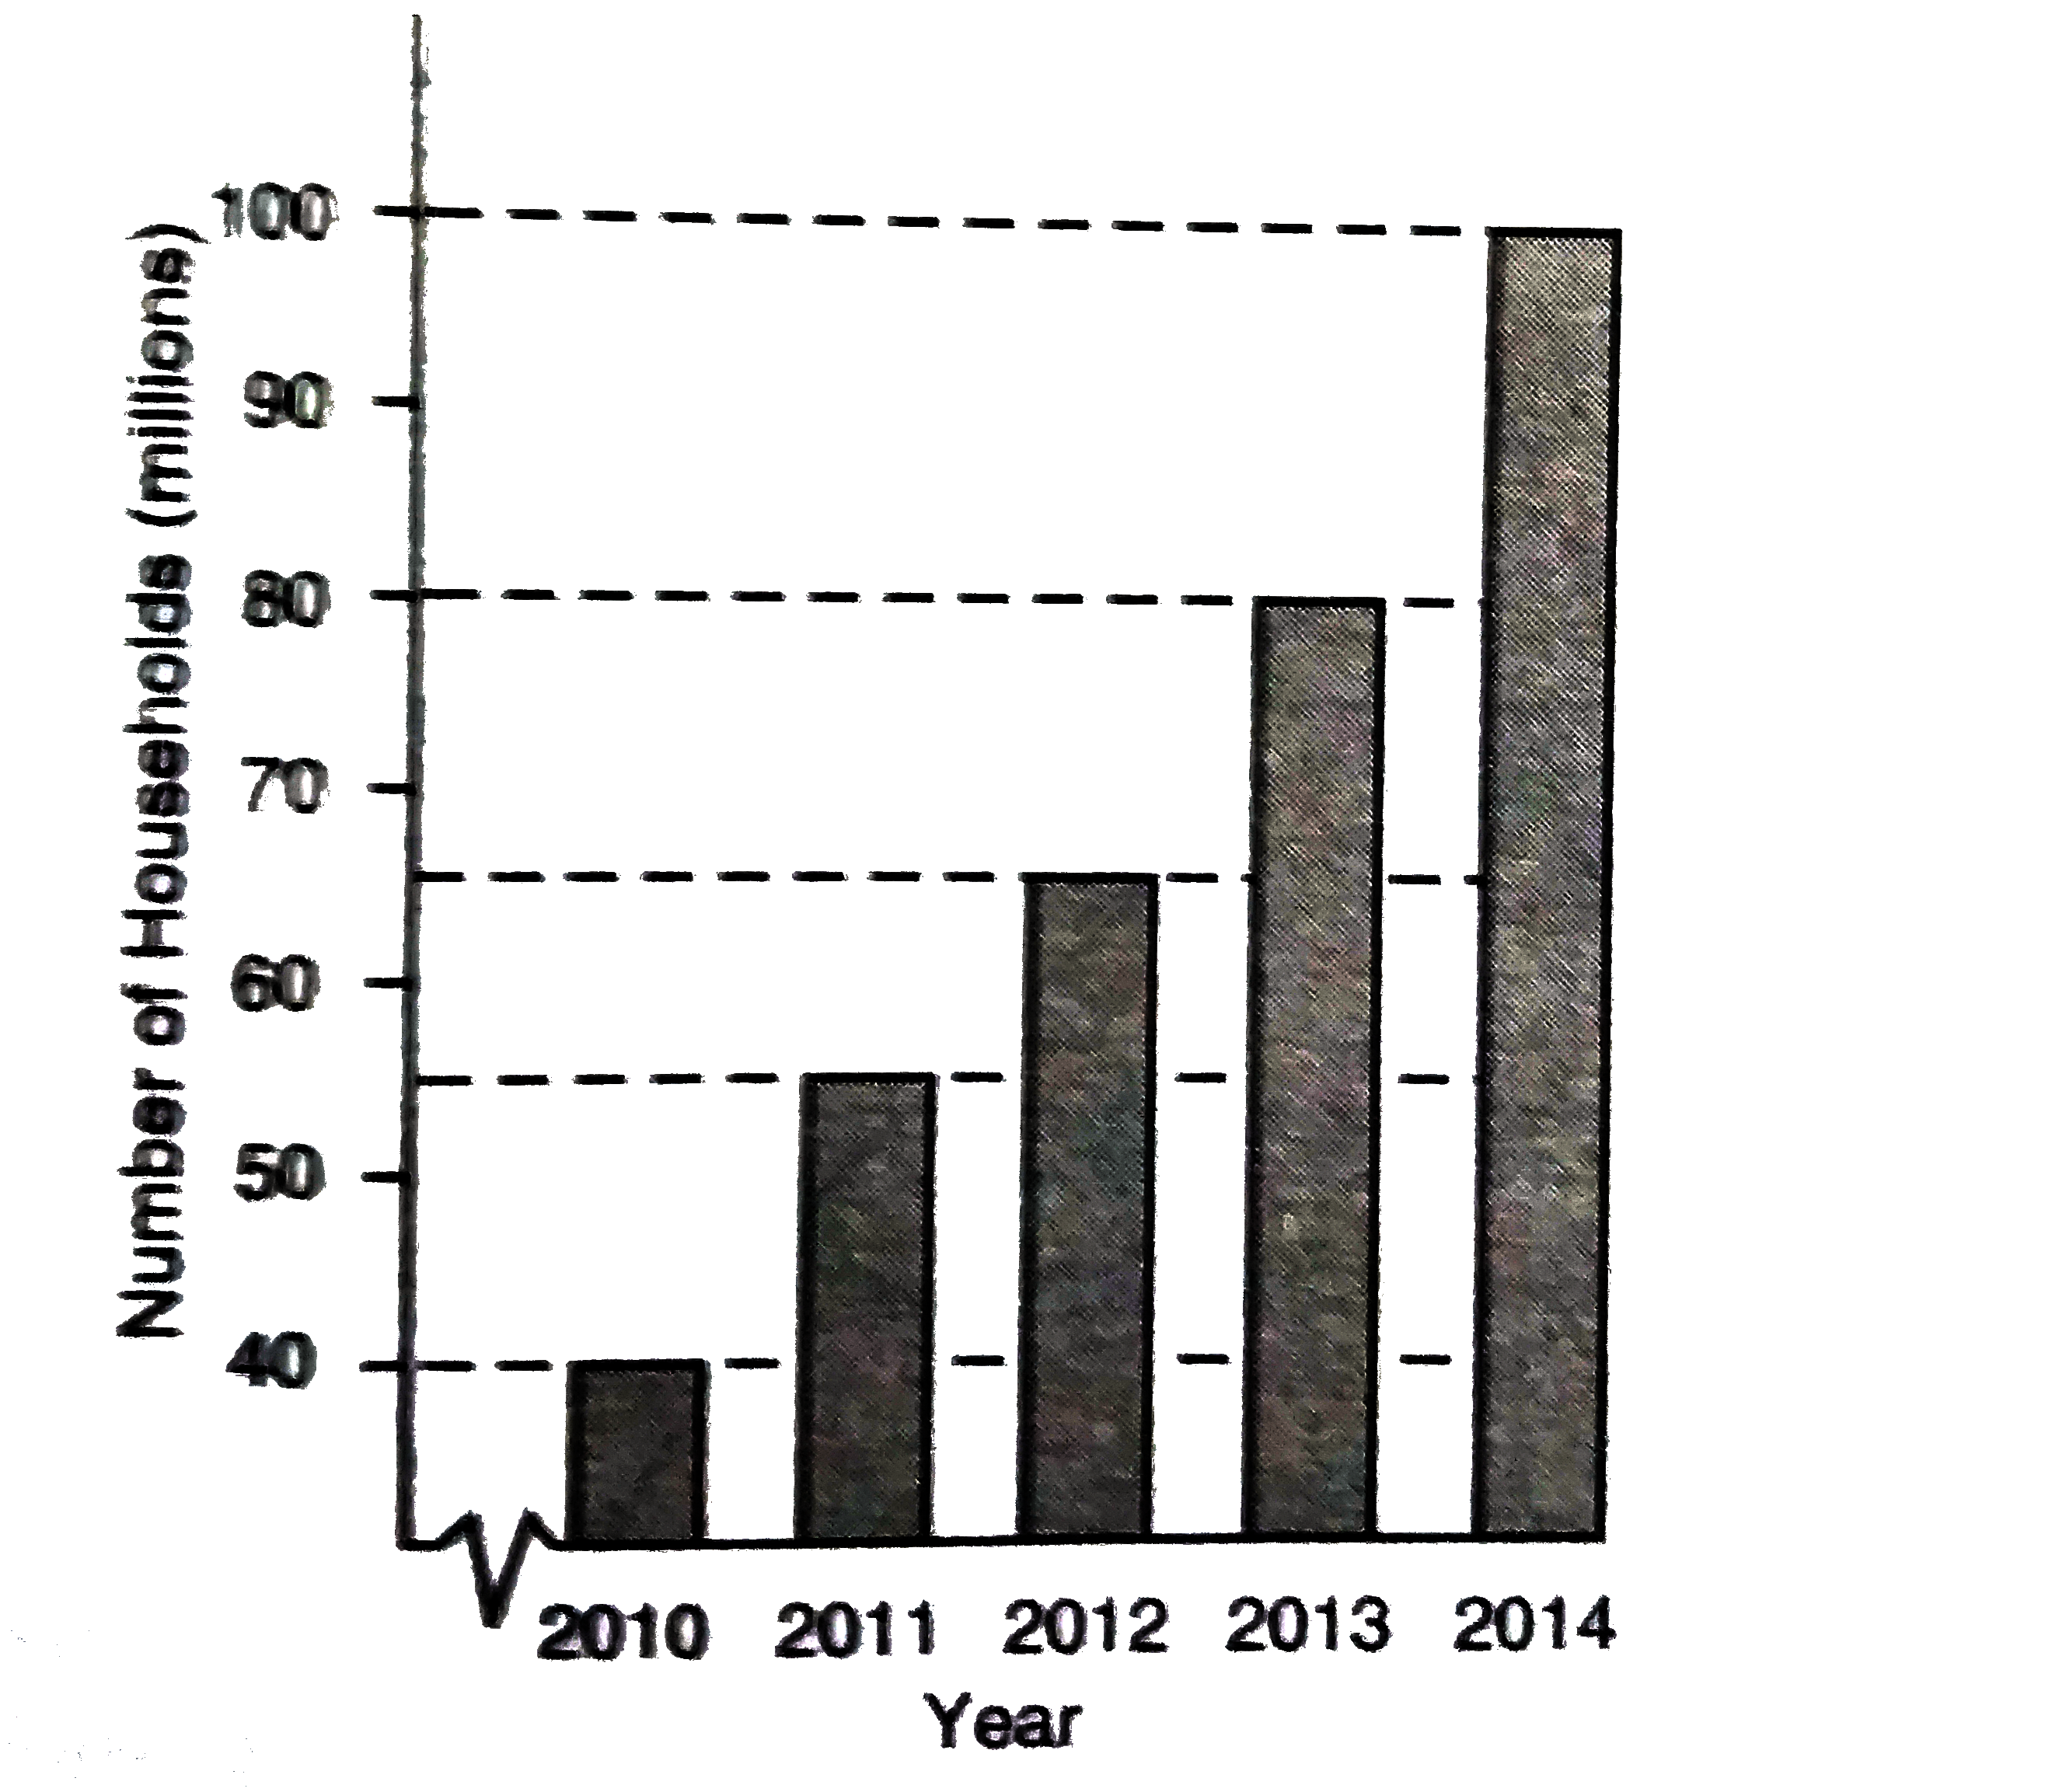
The graph above shows the number of U.S. households with laptop computers for the years 2010 to 2014.
Q. What was the percent of increase in the number of households with laptops from 2010 to 2014?
View Solution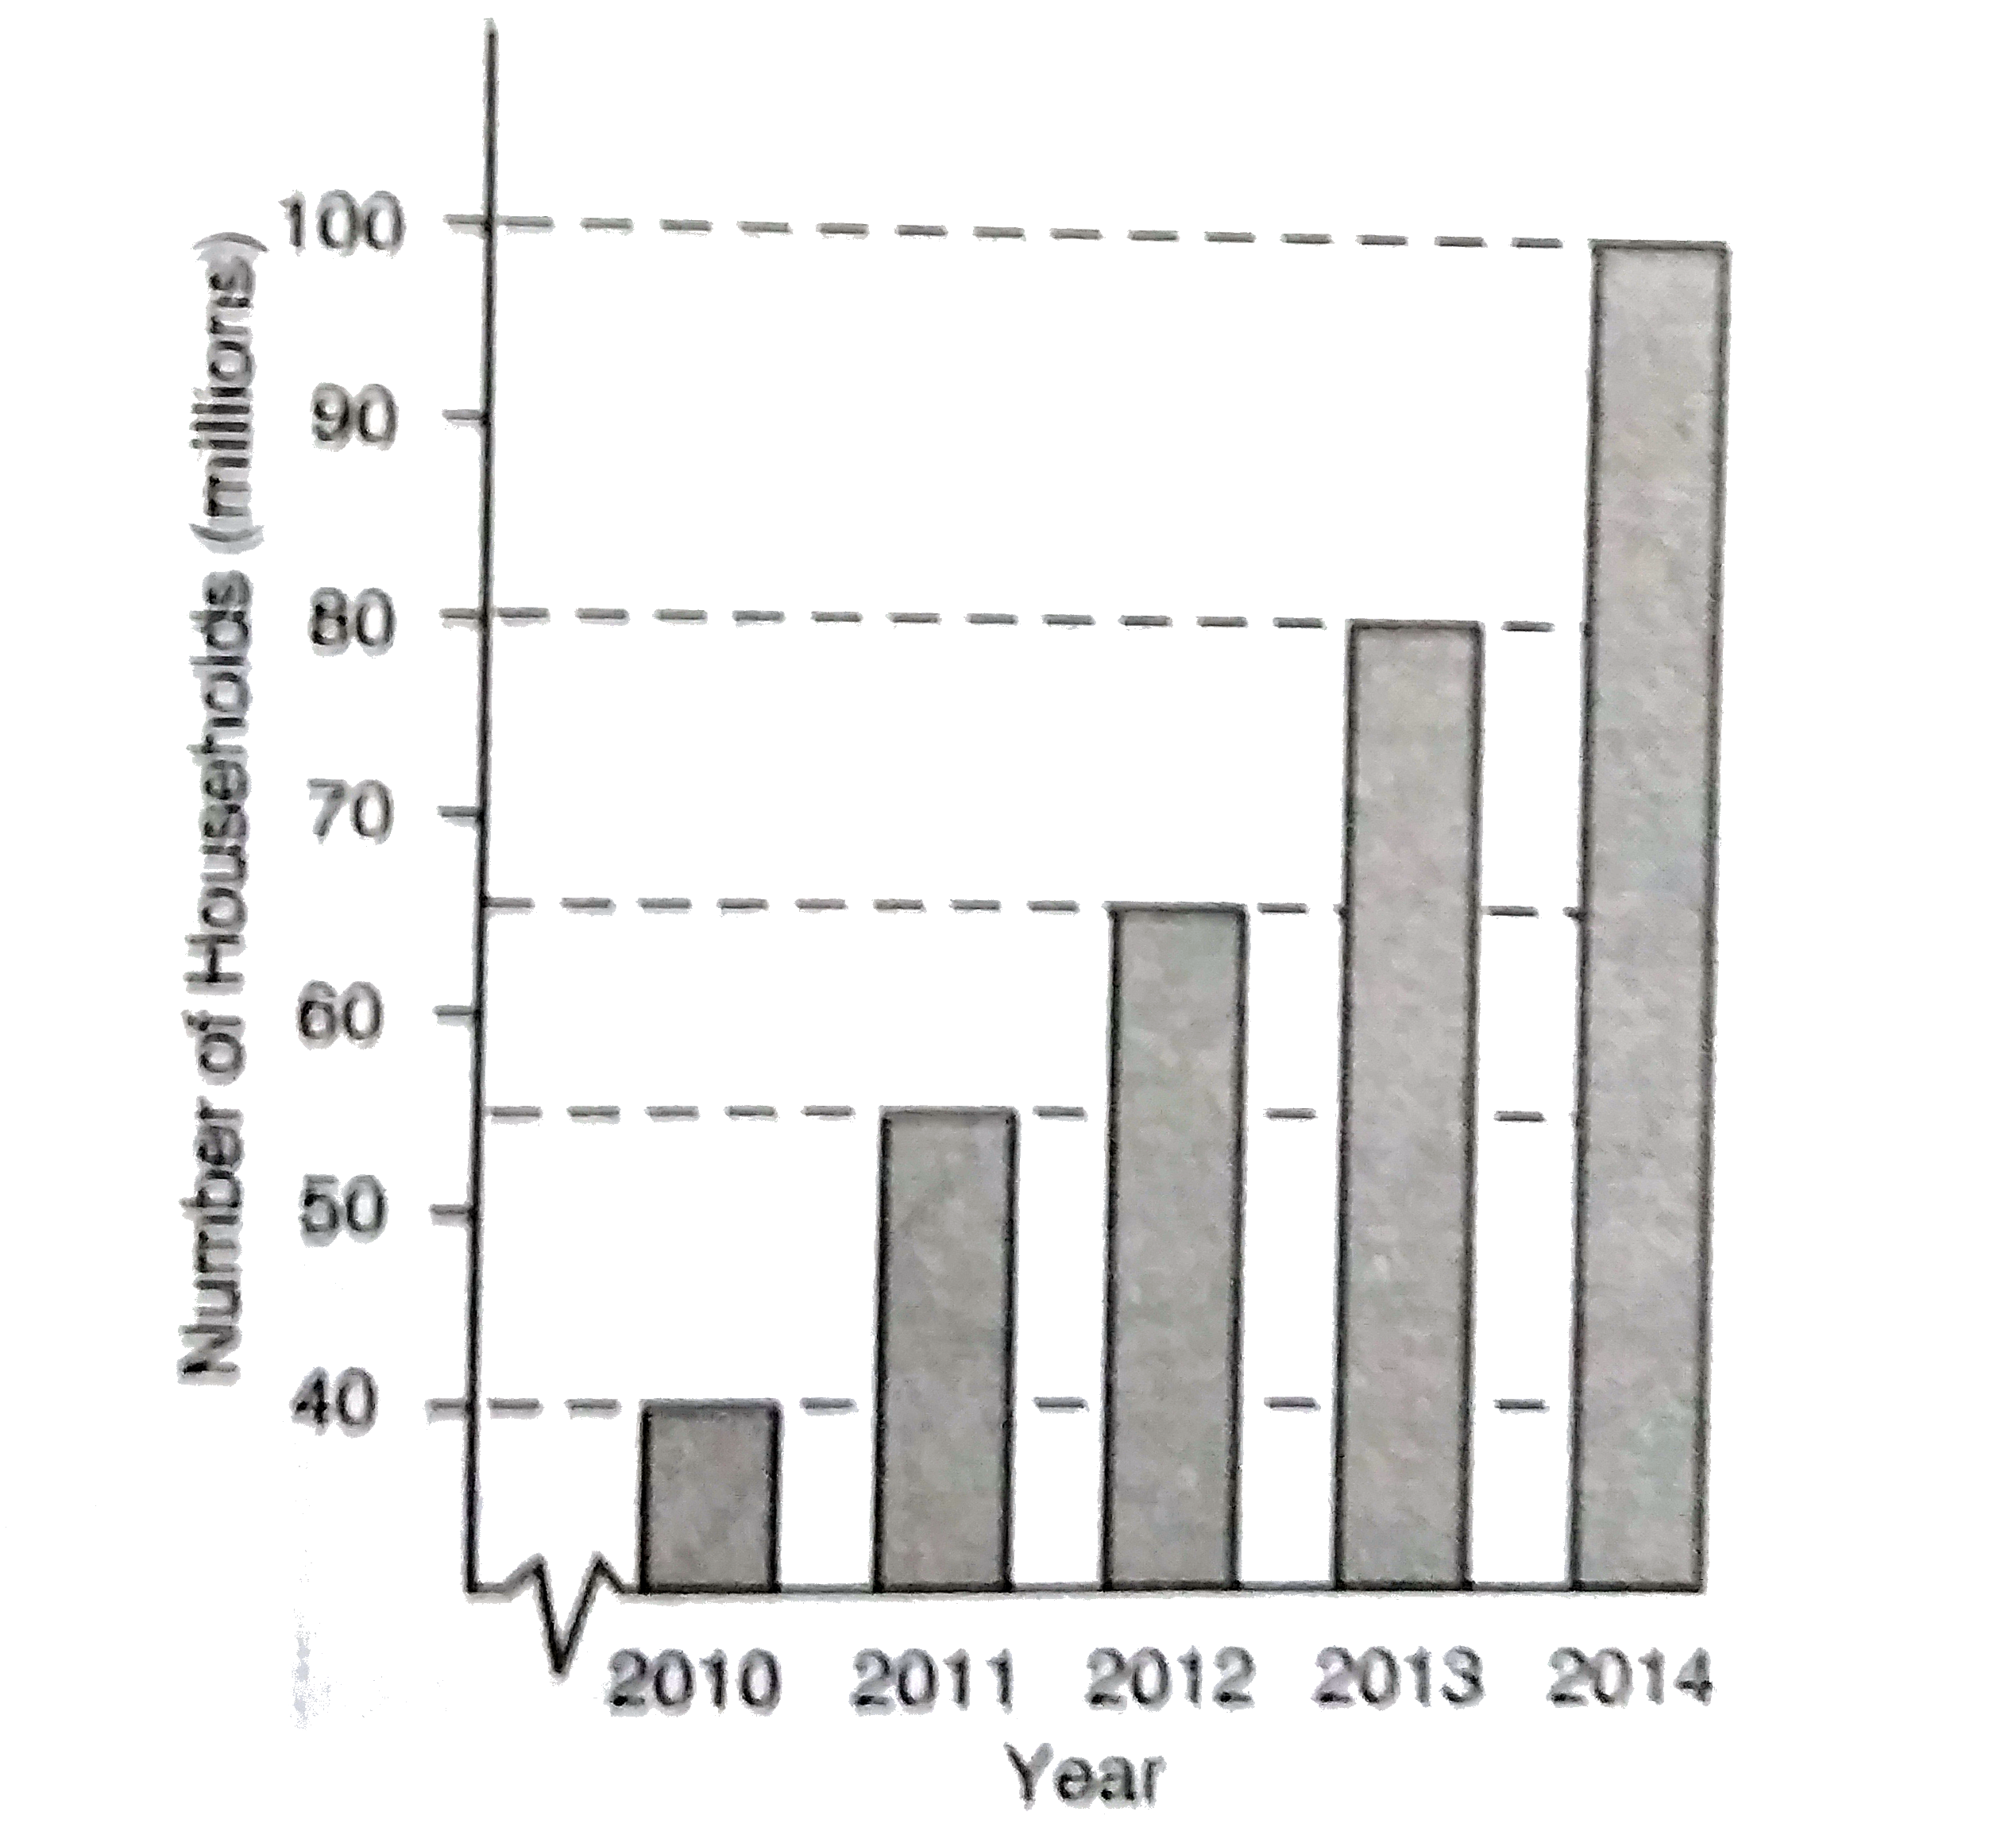
The graph above shows the number of U.S. households with laptop computers for the years 2010 to 2014.
Q. The greatest percent of increase in the number of households with laptops occurred in which two consecutive years?
View SolutionThe table below shows the percents of U.S. citizens who had ever consumed Bob's soda , out of all soda consumers , for each year form 1986 through 2006.
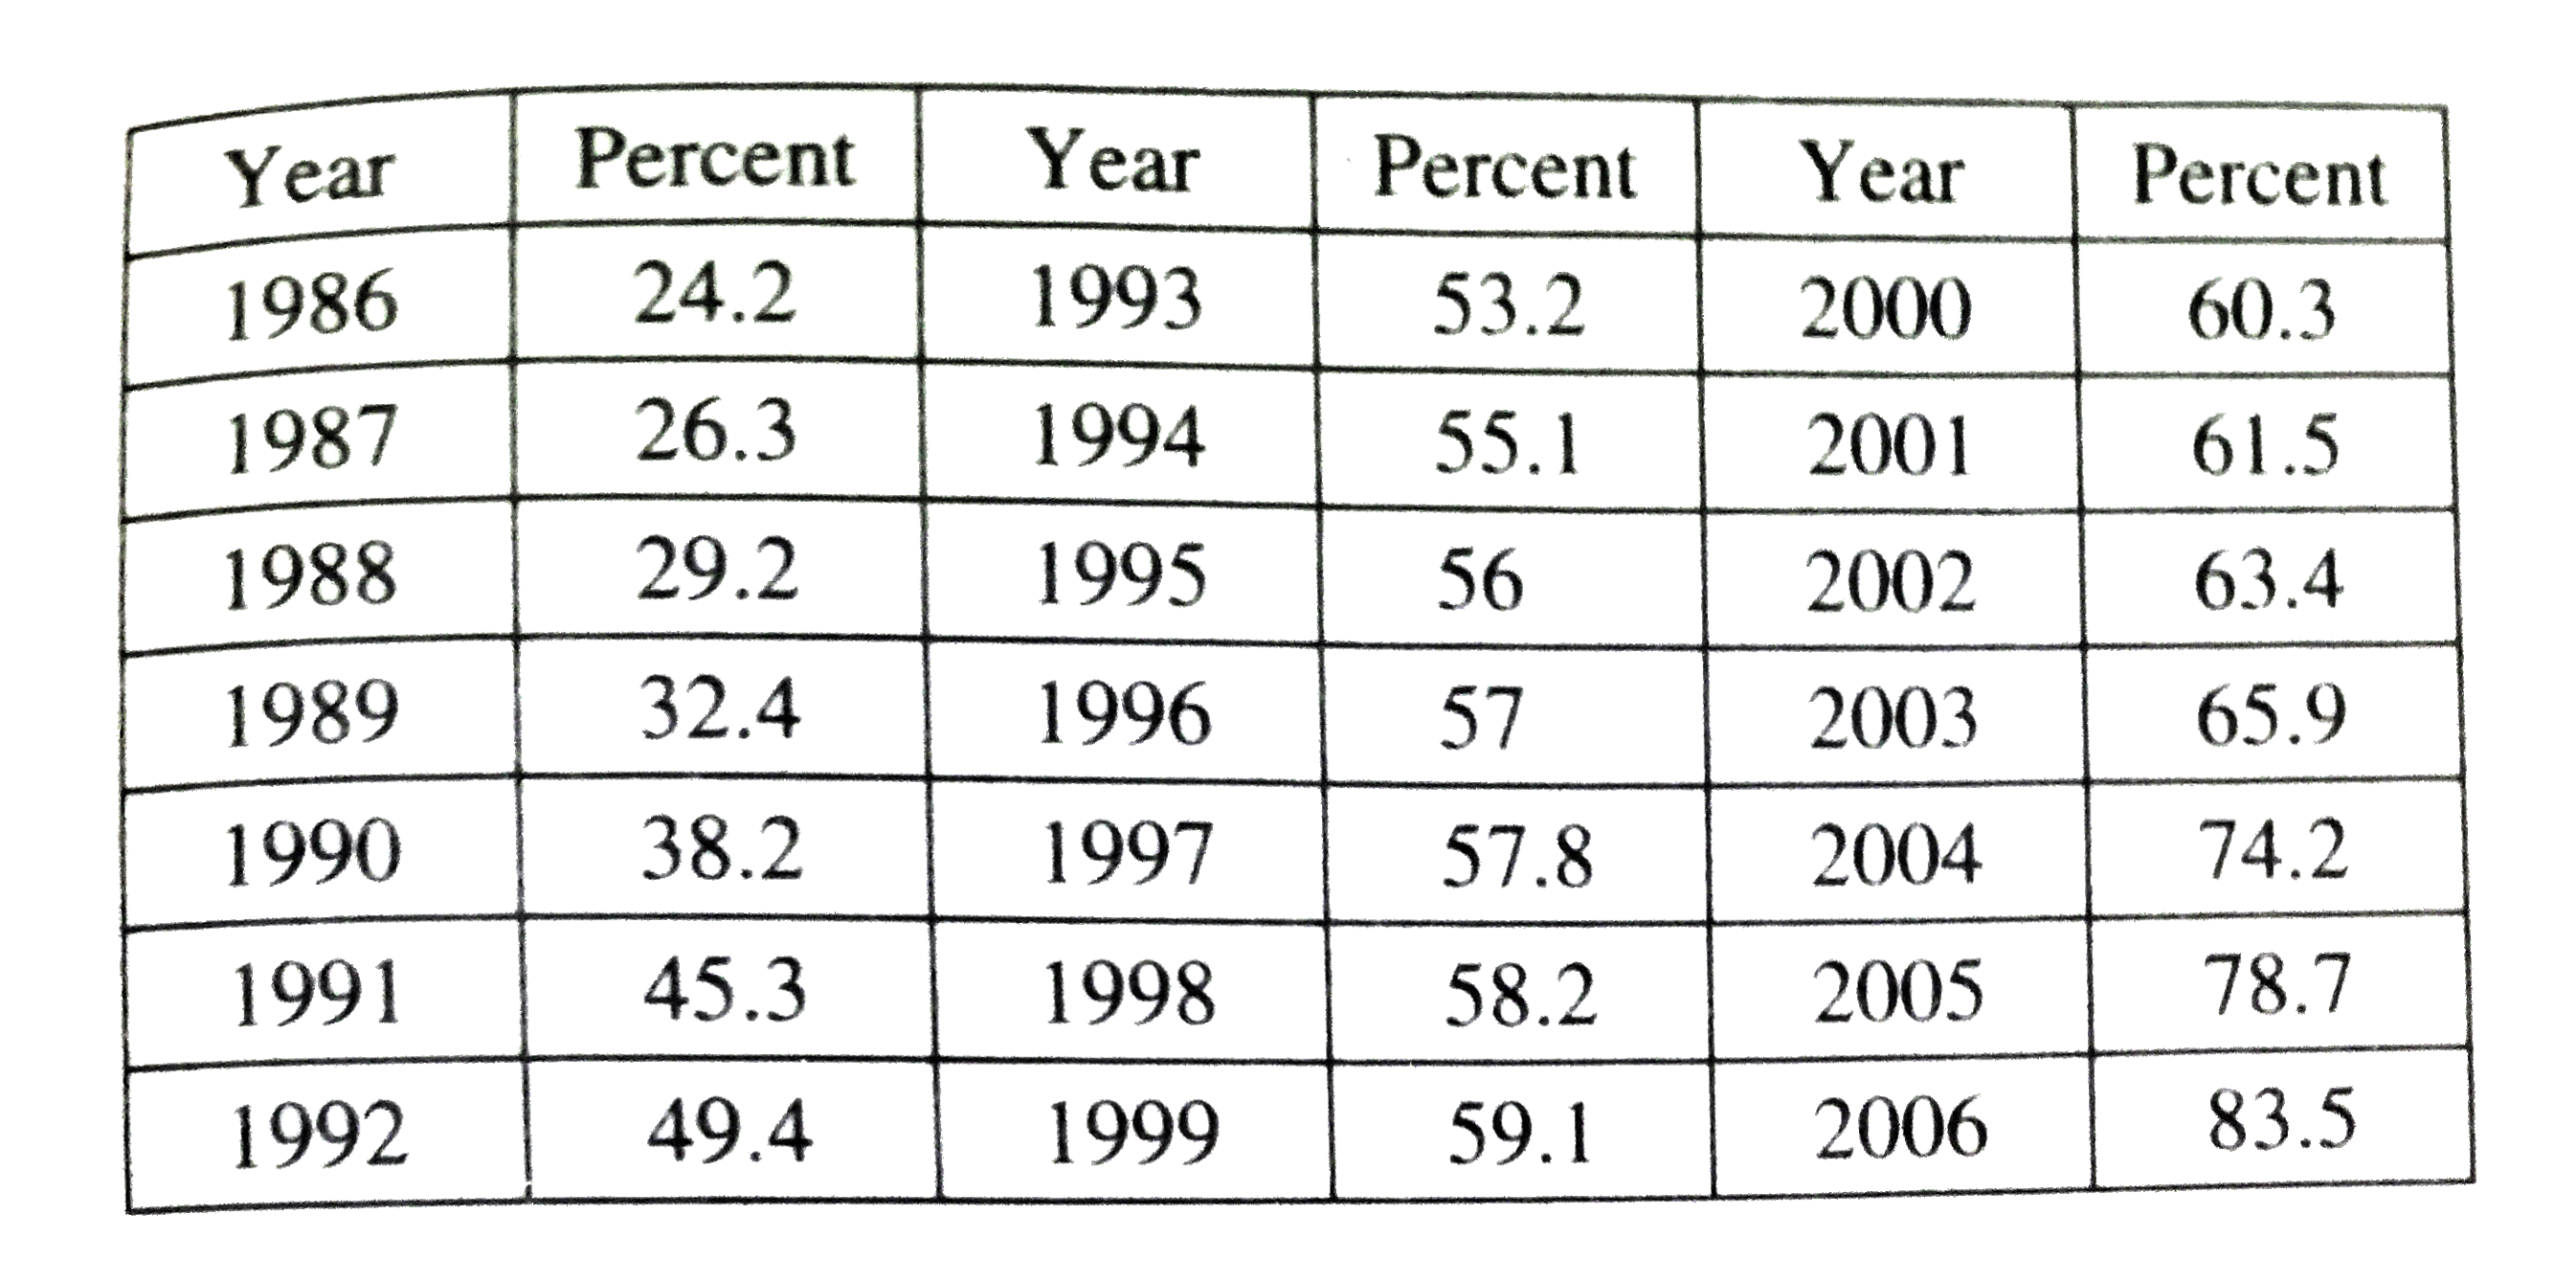
Which of the following years had the LEAST increase in the percent of U.S. citizens who had consumed Bob's soda from the previous year ?
View SolutionStudy the following graph and answer the following questions :-
Following graph shows the actual & target productin of a companry over the period (in thousand tonnes)
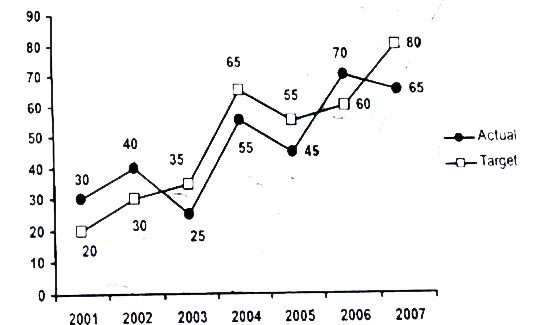
the target production in the year 2001, 2003 and 2005 together is what percent of acutal production of 2002, 2004 and 2006 together ?
View Solution

