The table below details a recent census report about the commuting habits of U.S . Workers age 16 or over for the years 2004 , 2005 , and 2006.
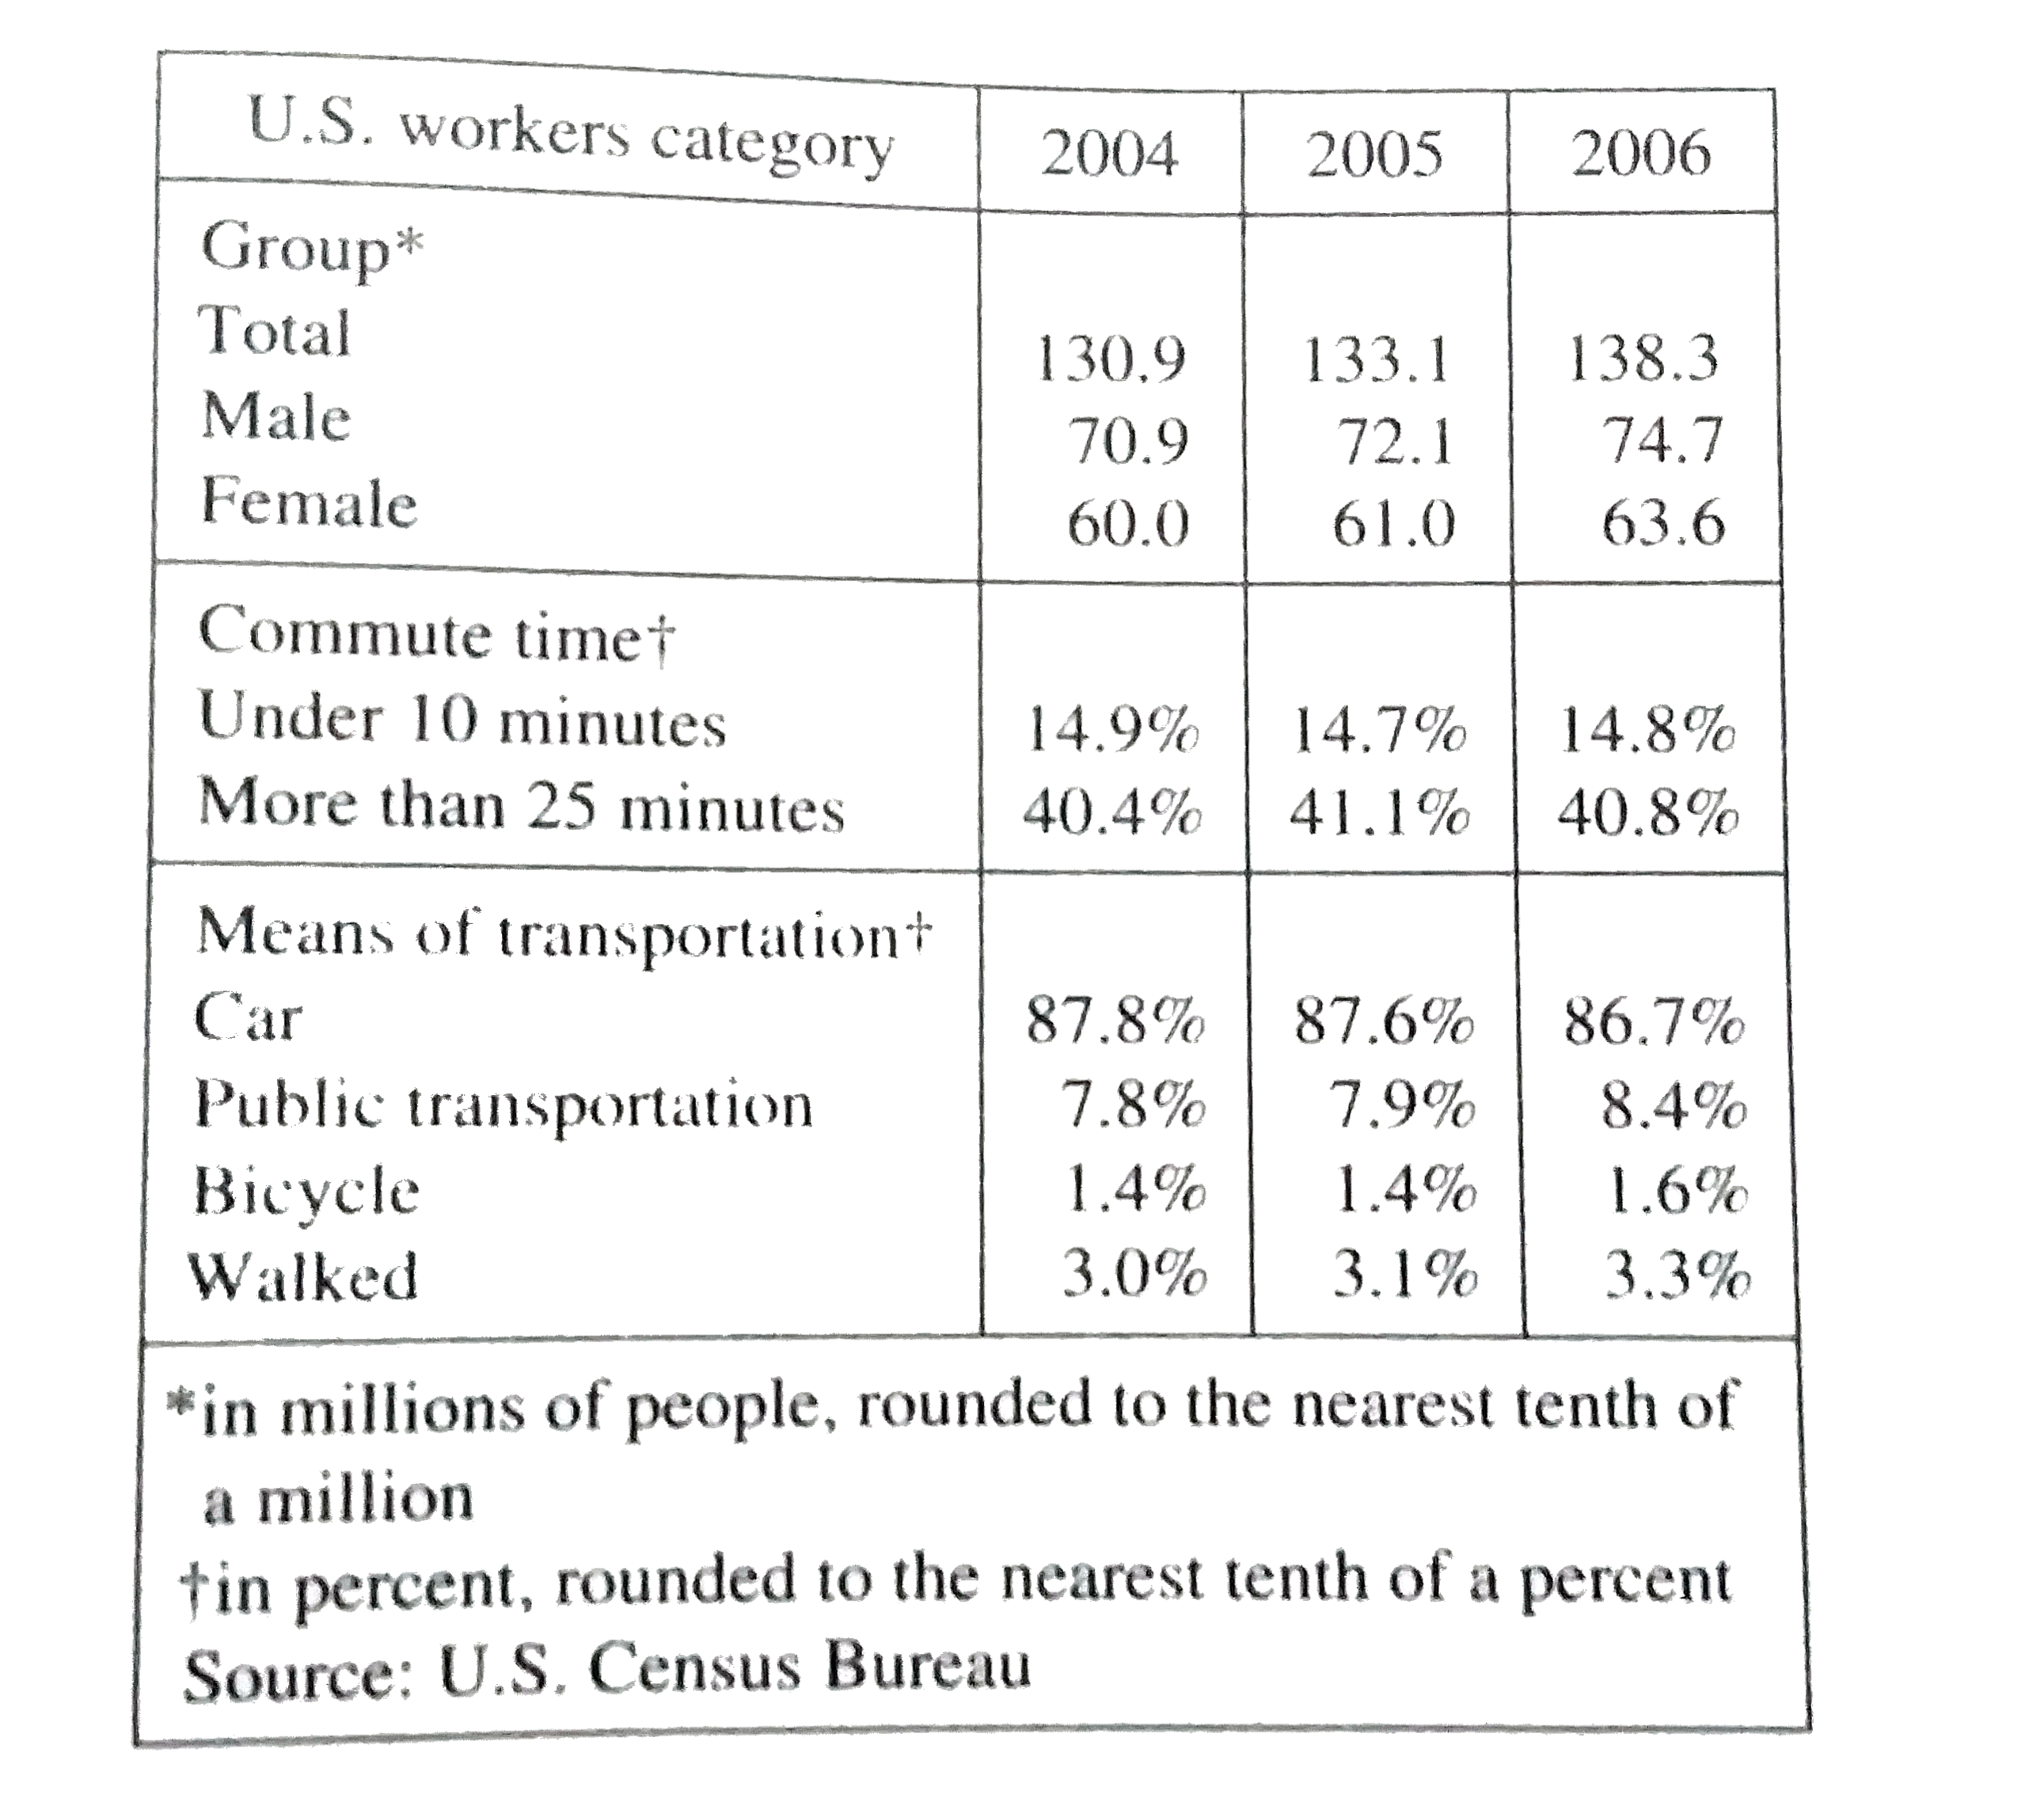
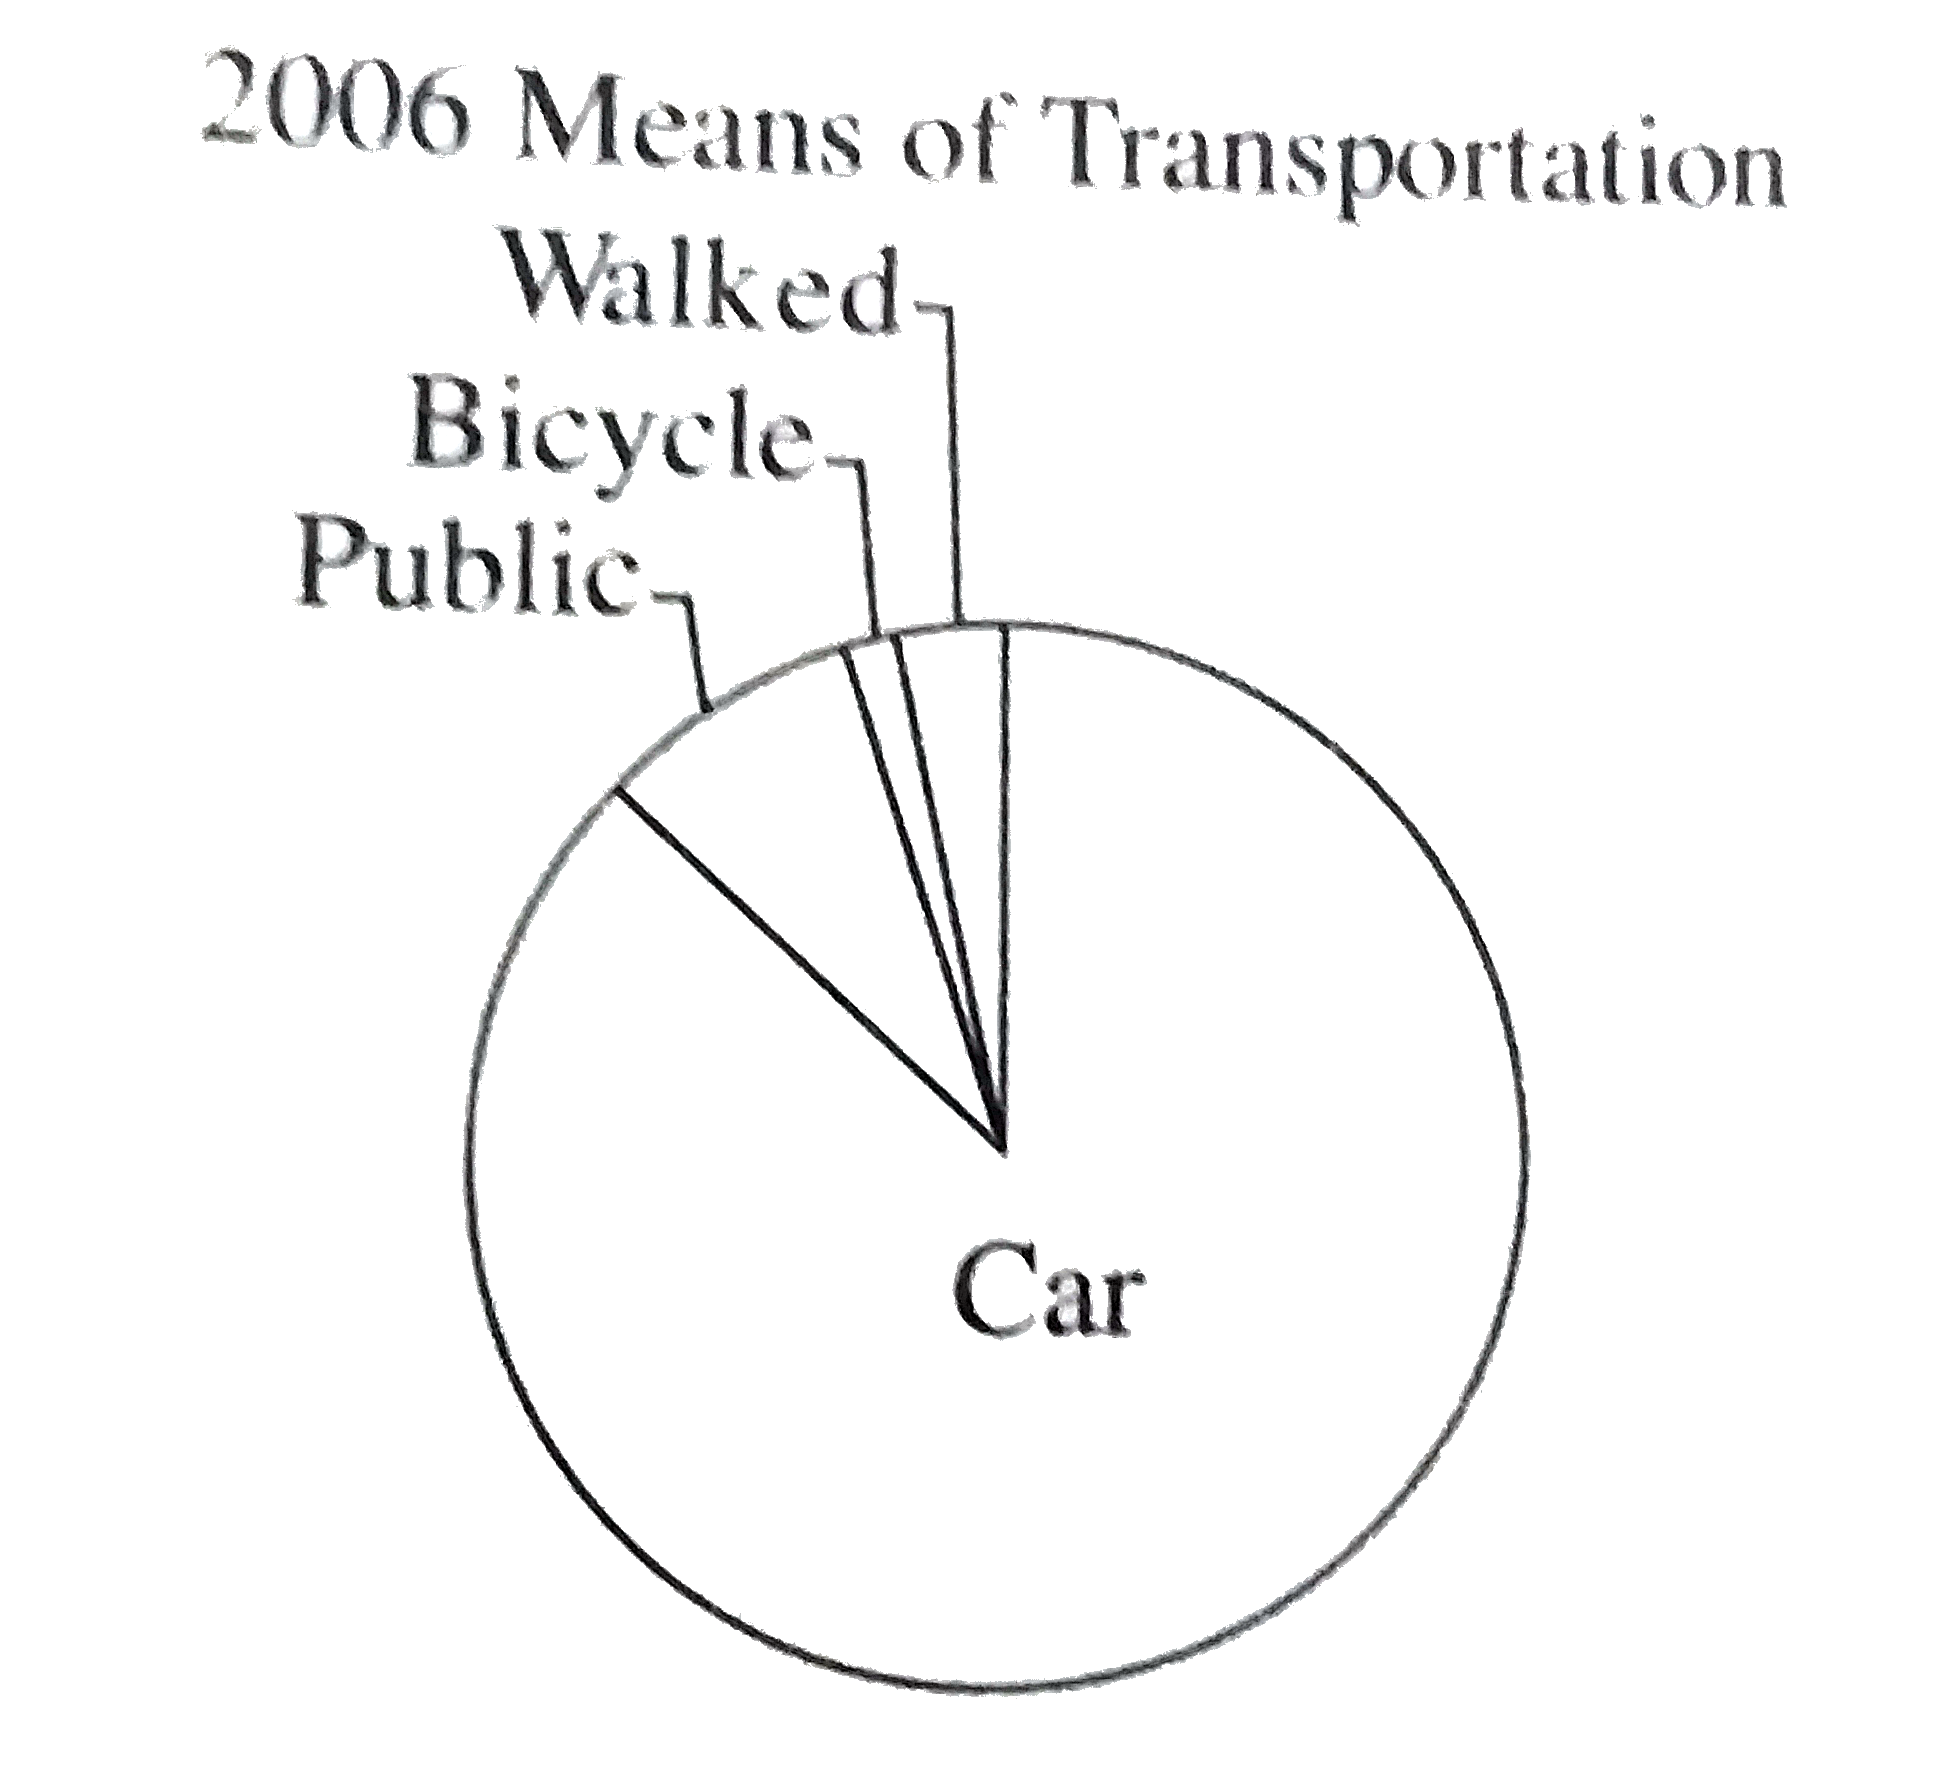
The circle graph (pie chart ) below represents the 2006 means of transportation for U.S . workers age 16 or over for the four transportation types listed . To the nearest degree , What is the measure of the central angle for the " Public " sector ?
A
8∘
B
12∘
C
20∘
D
30∘
Text Solution
The correct Answer is:D
|
Topper's Solved these Questions
Similar Questions
Knowledge Check
The table below details a recent census report about the commuting habits of U.S . Workers age 16 or over for the years 2004 , 2005 , and 2006.
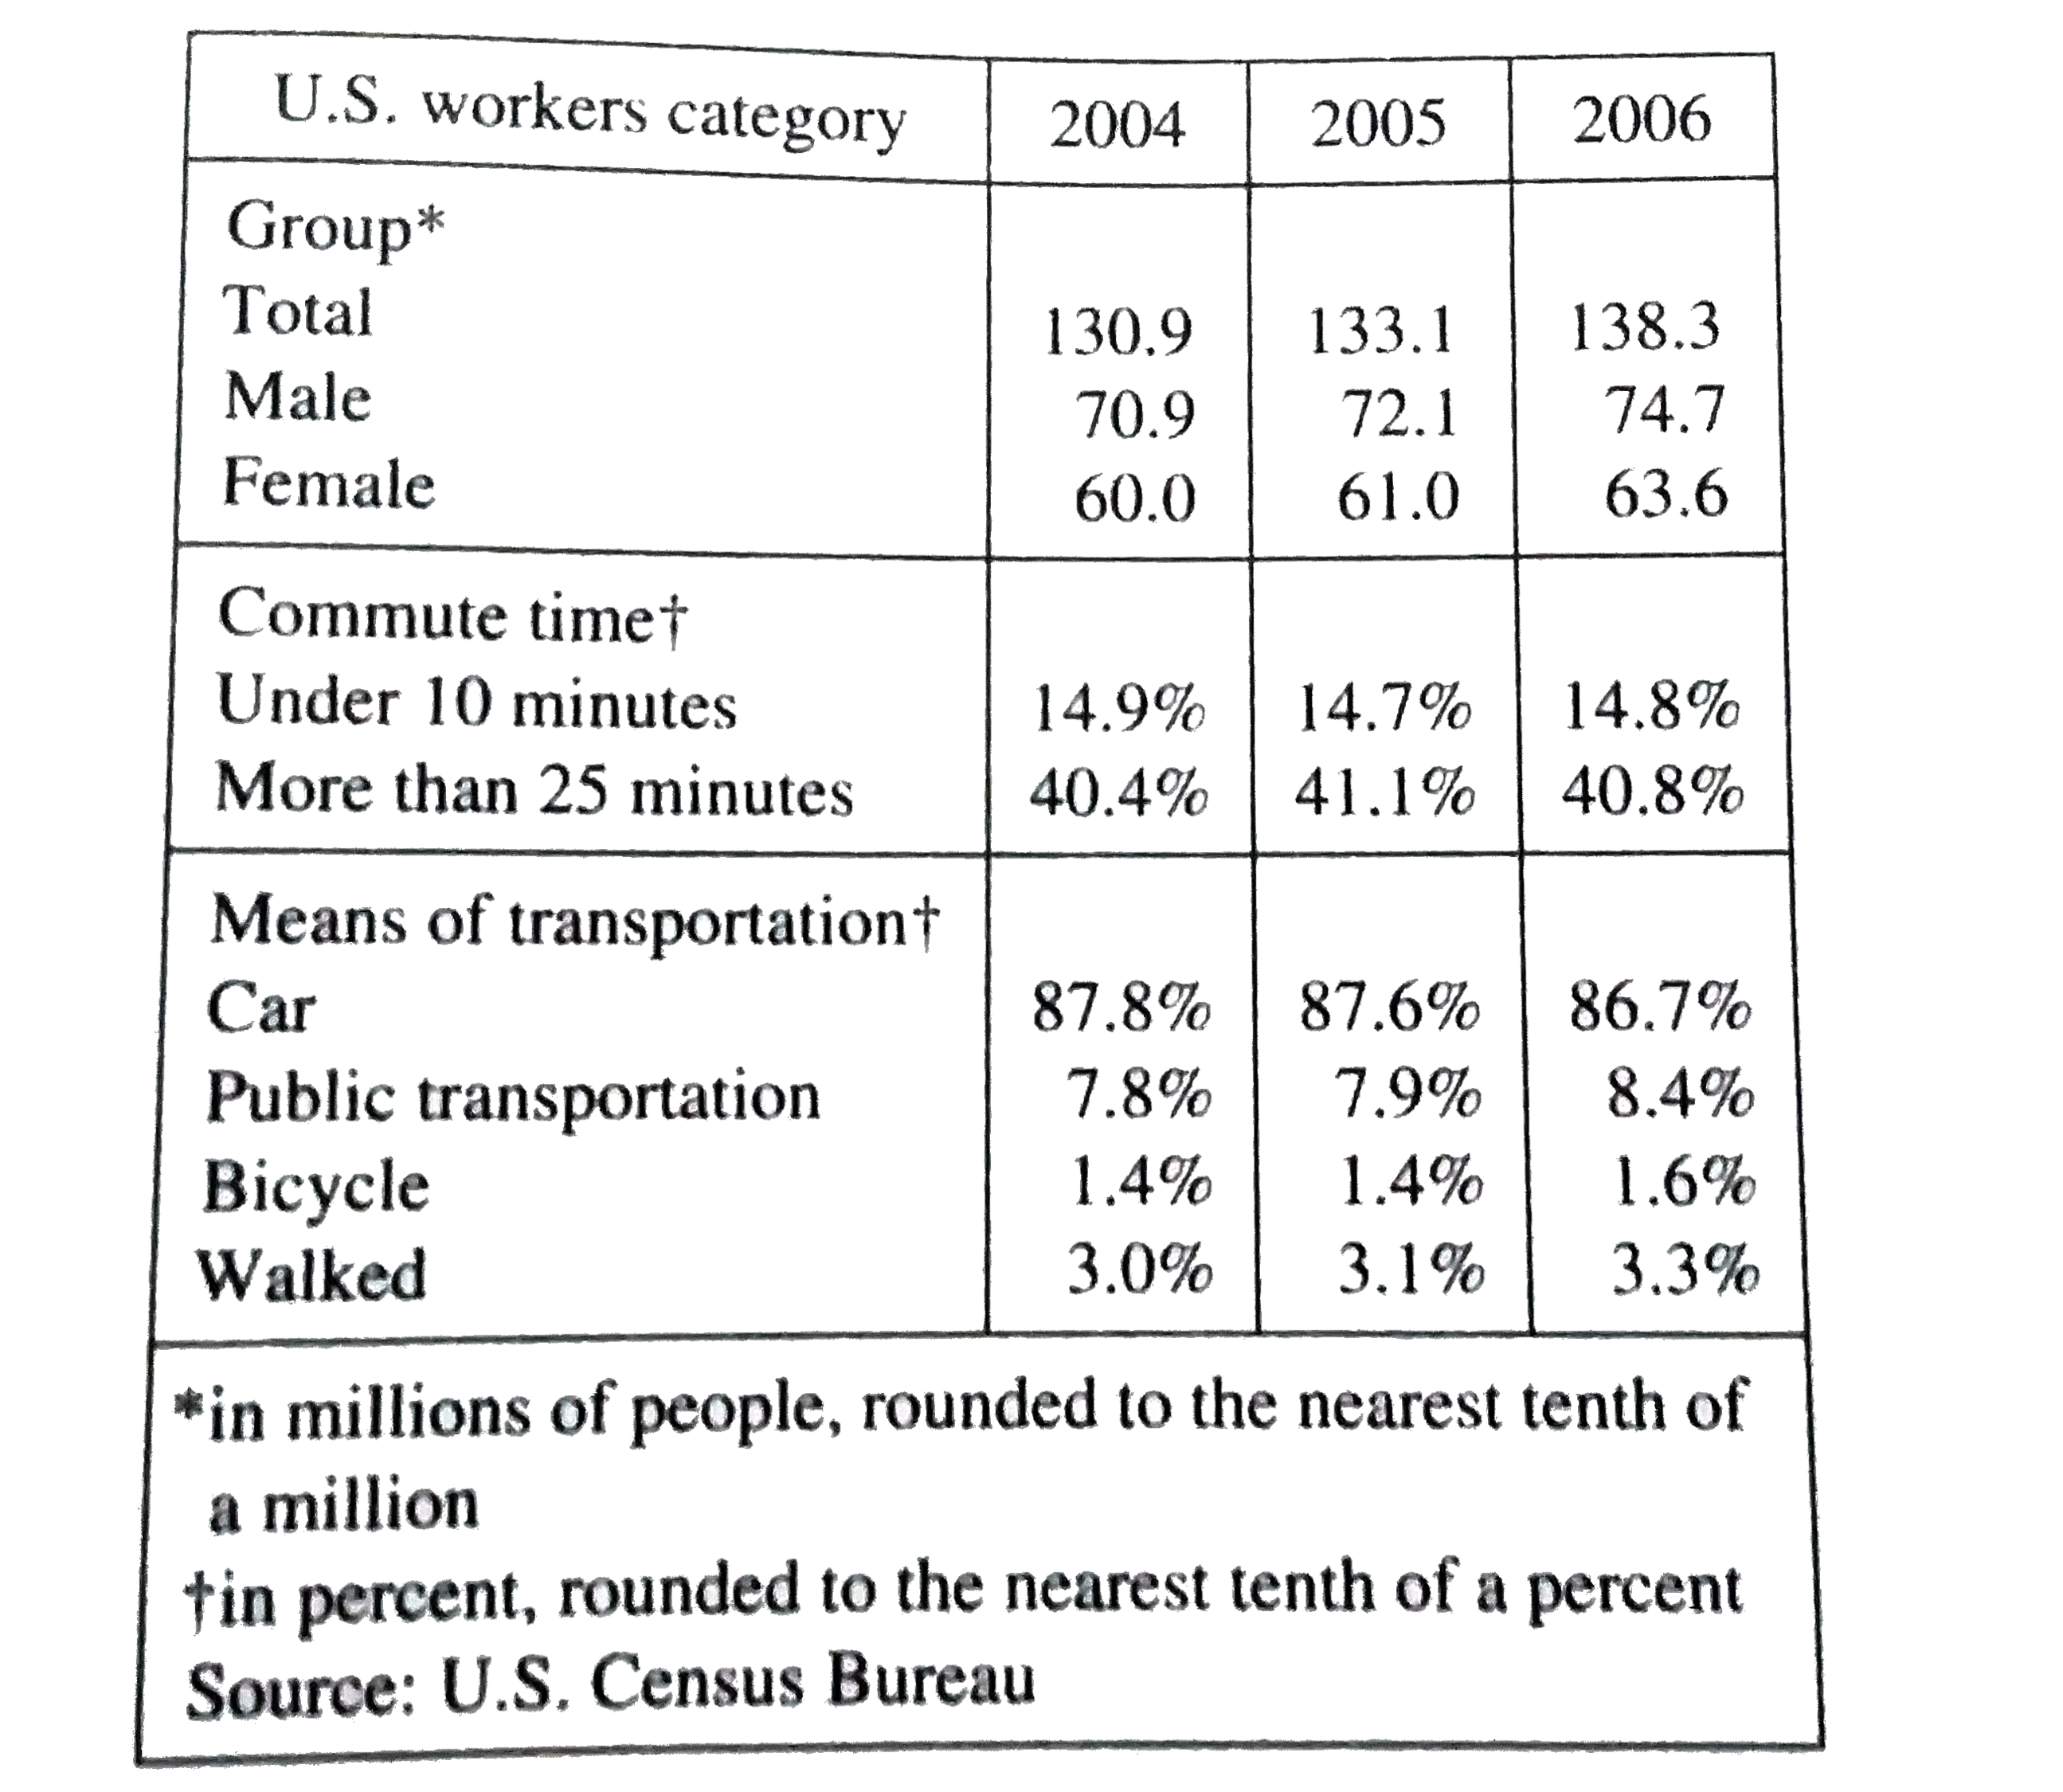
The the nearest percent , what percent of all U.S workers age 16 or over in 2004 was female ?A50%B48%C46%D44%The table below details a recent census report about the commuting habits of U.S . Workers age 16 or over for the years 2004 , 2005 , and 2006.
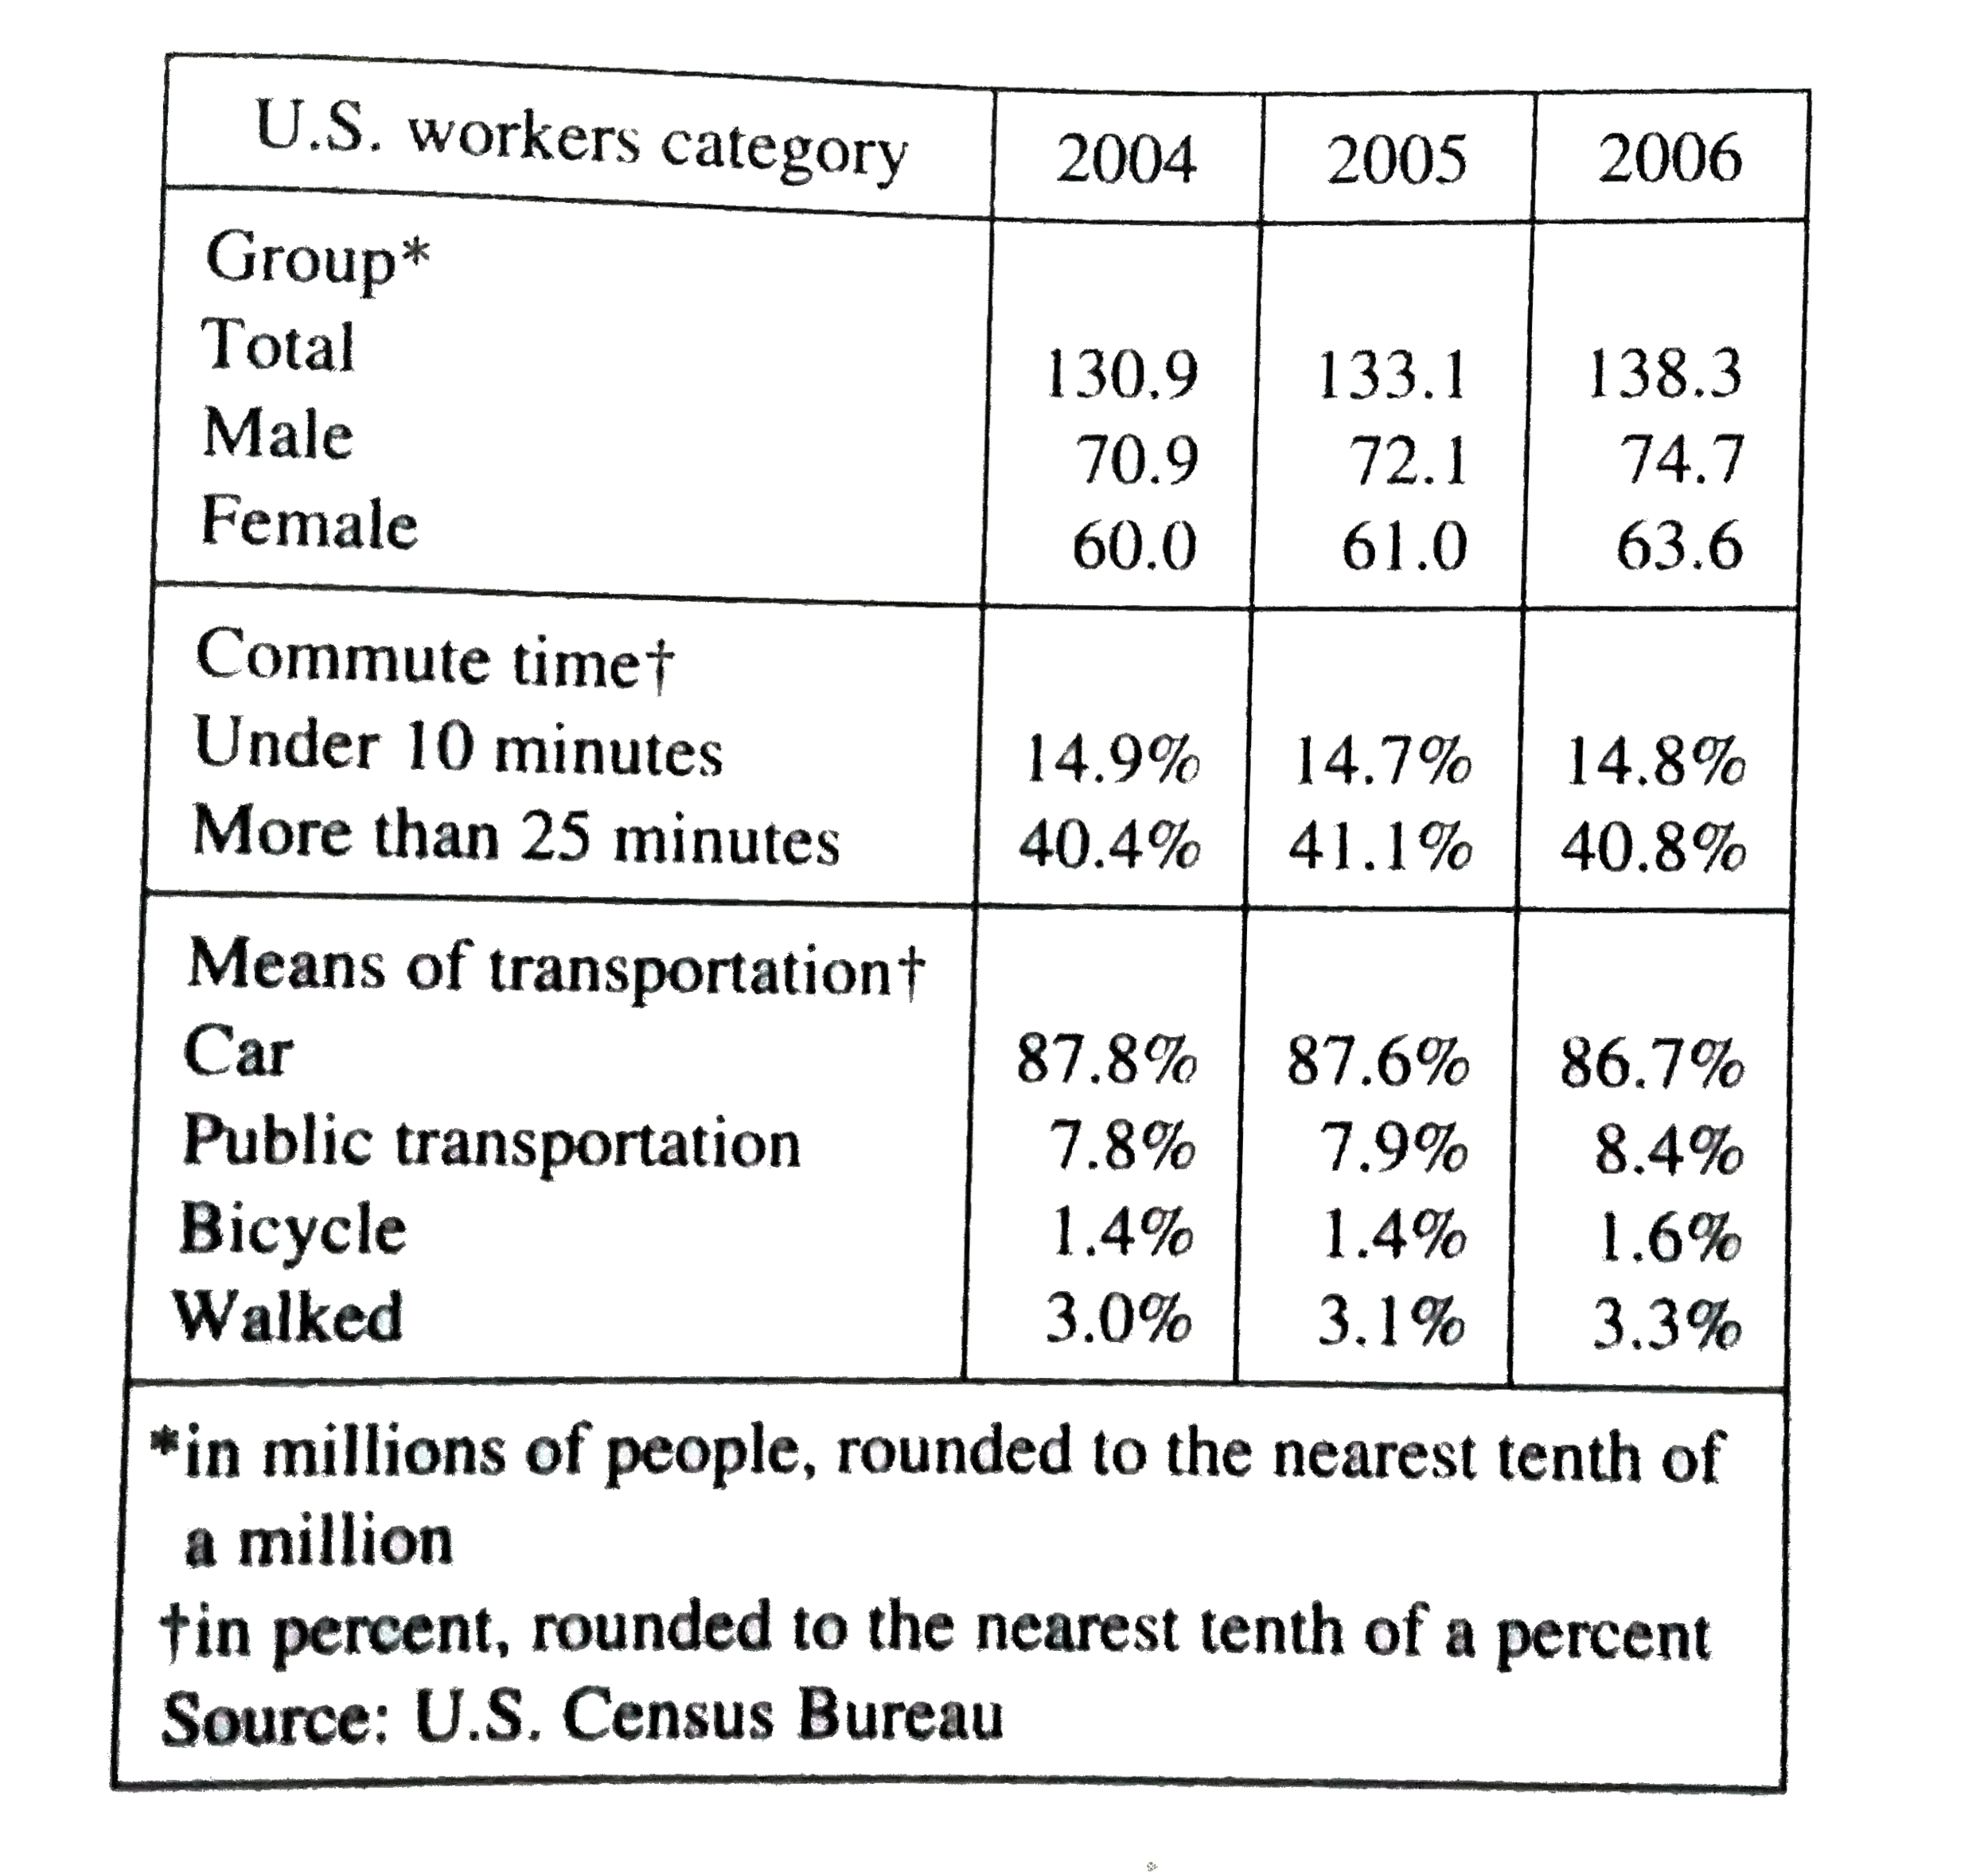
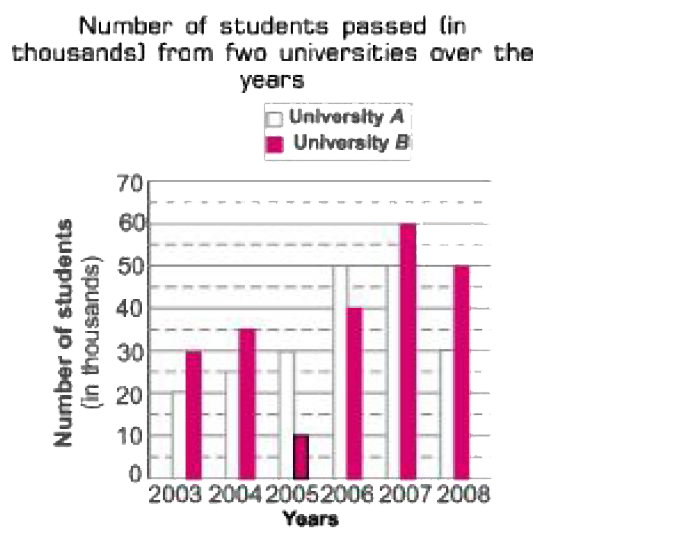
Expressed in millions of people , what was the average growth per year for female U.S workers age 16 or over from 2004 to 2006 , rounded to the nearest 0.1 million ?A0.5B0.9C1.3D1.8What is the sum of students passed from university B in the years 2003, 2005 and 2006 together?
 A80000B8000C800000D75000
The following table gives the average temperatures, during the year 2006 and 2007. Draw a double bar graph for the given data.

View SolutionThe ratio of the total expenditure for the years 2000 and 2006 is 5:8. The cost of living index of 2006, taking 2000 as the base year, is ____
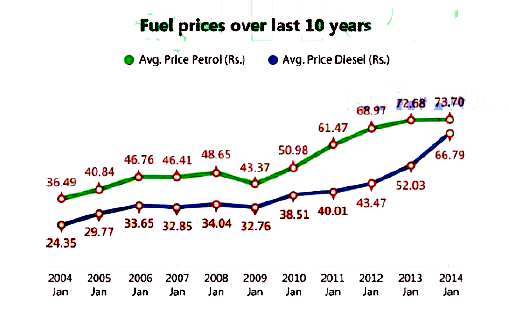
View SolutionObserve the graph below and answer the following question.
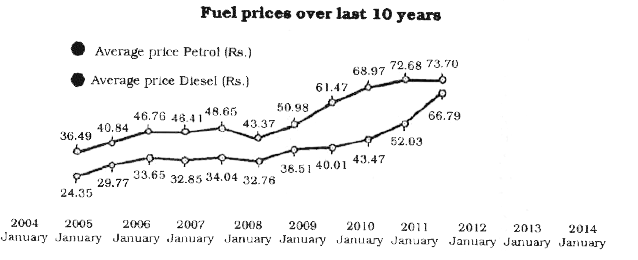
What is the average of diesel prices over the years 2006-2012?
View SolutionThe United Nations declared 2006 as the International Year of
View SolutionThe pie chart drawn below shows the spendings of a country on various sports during a particular year. Study the pie chart and answer the questions.
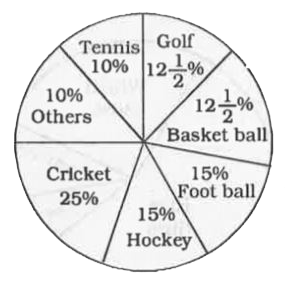
Total central angle showing the money spent on hockey, football and other during the year was
View Solution

