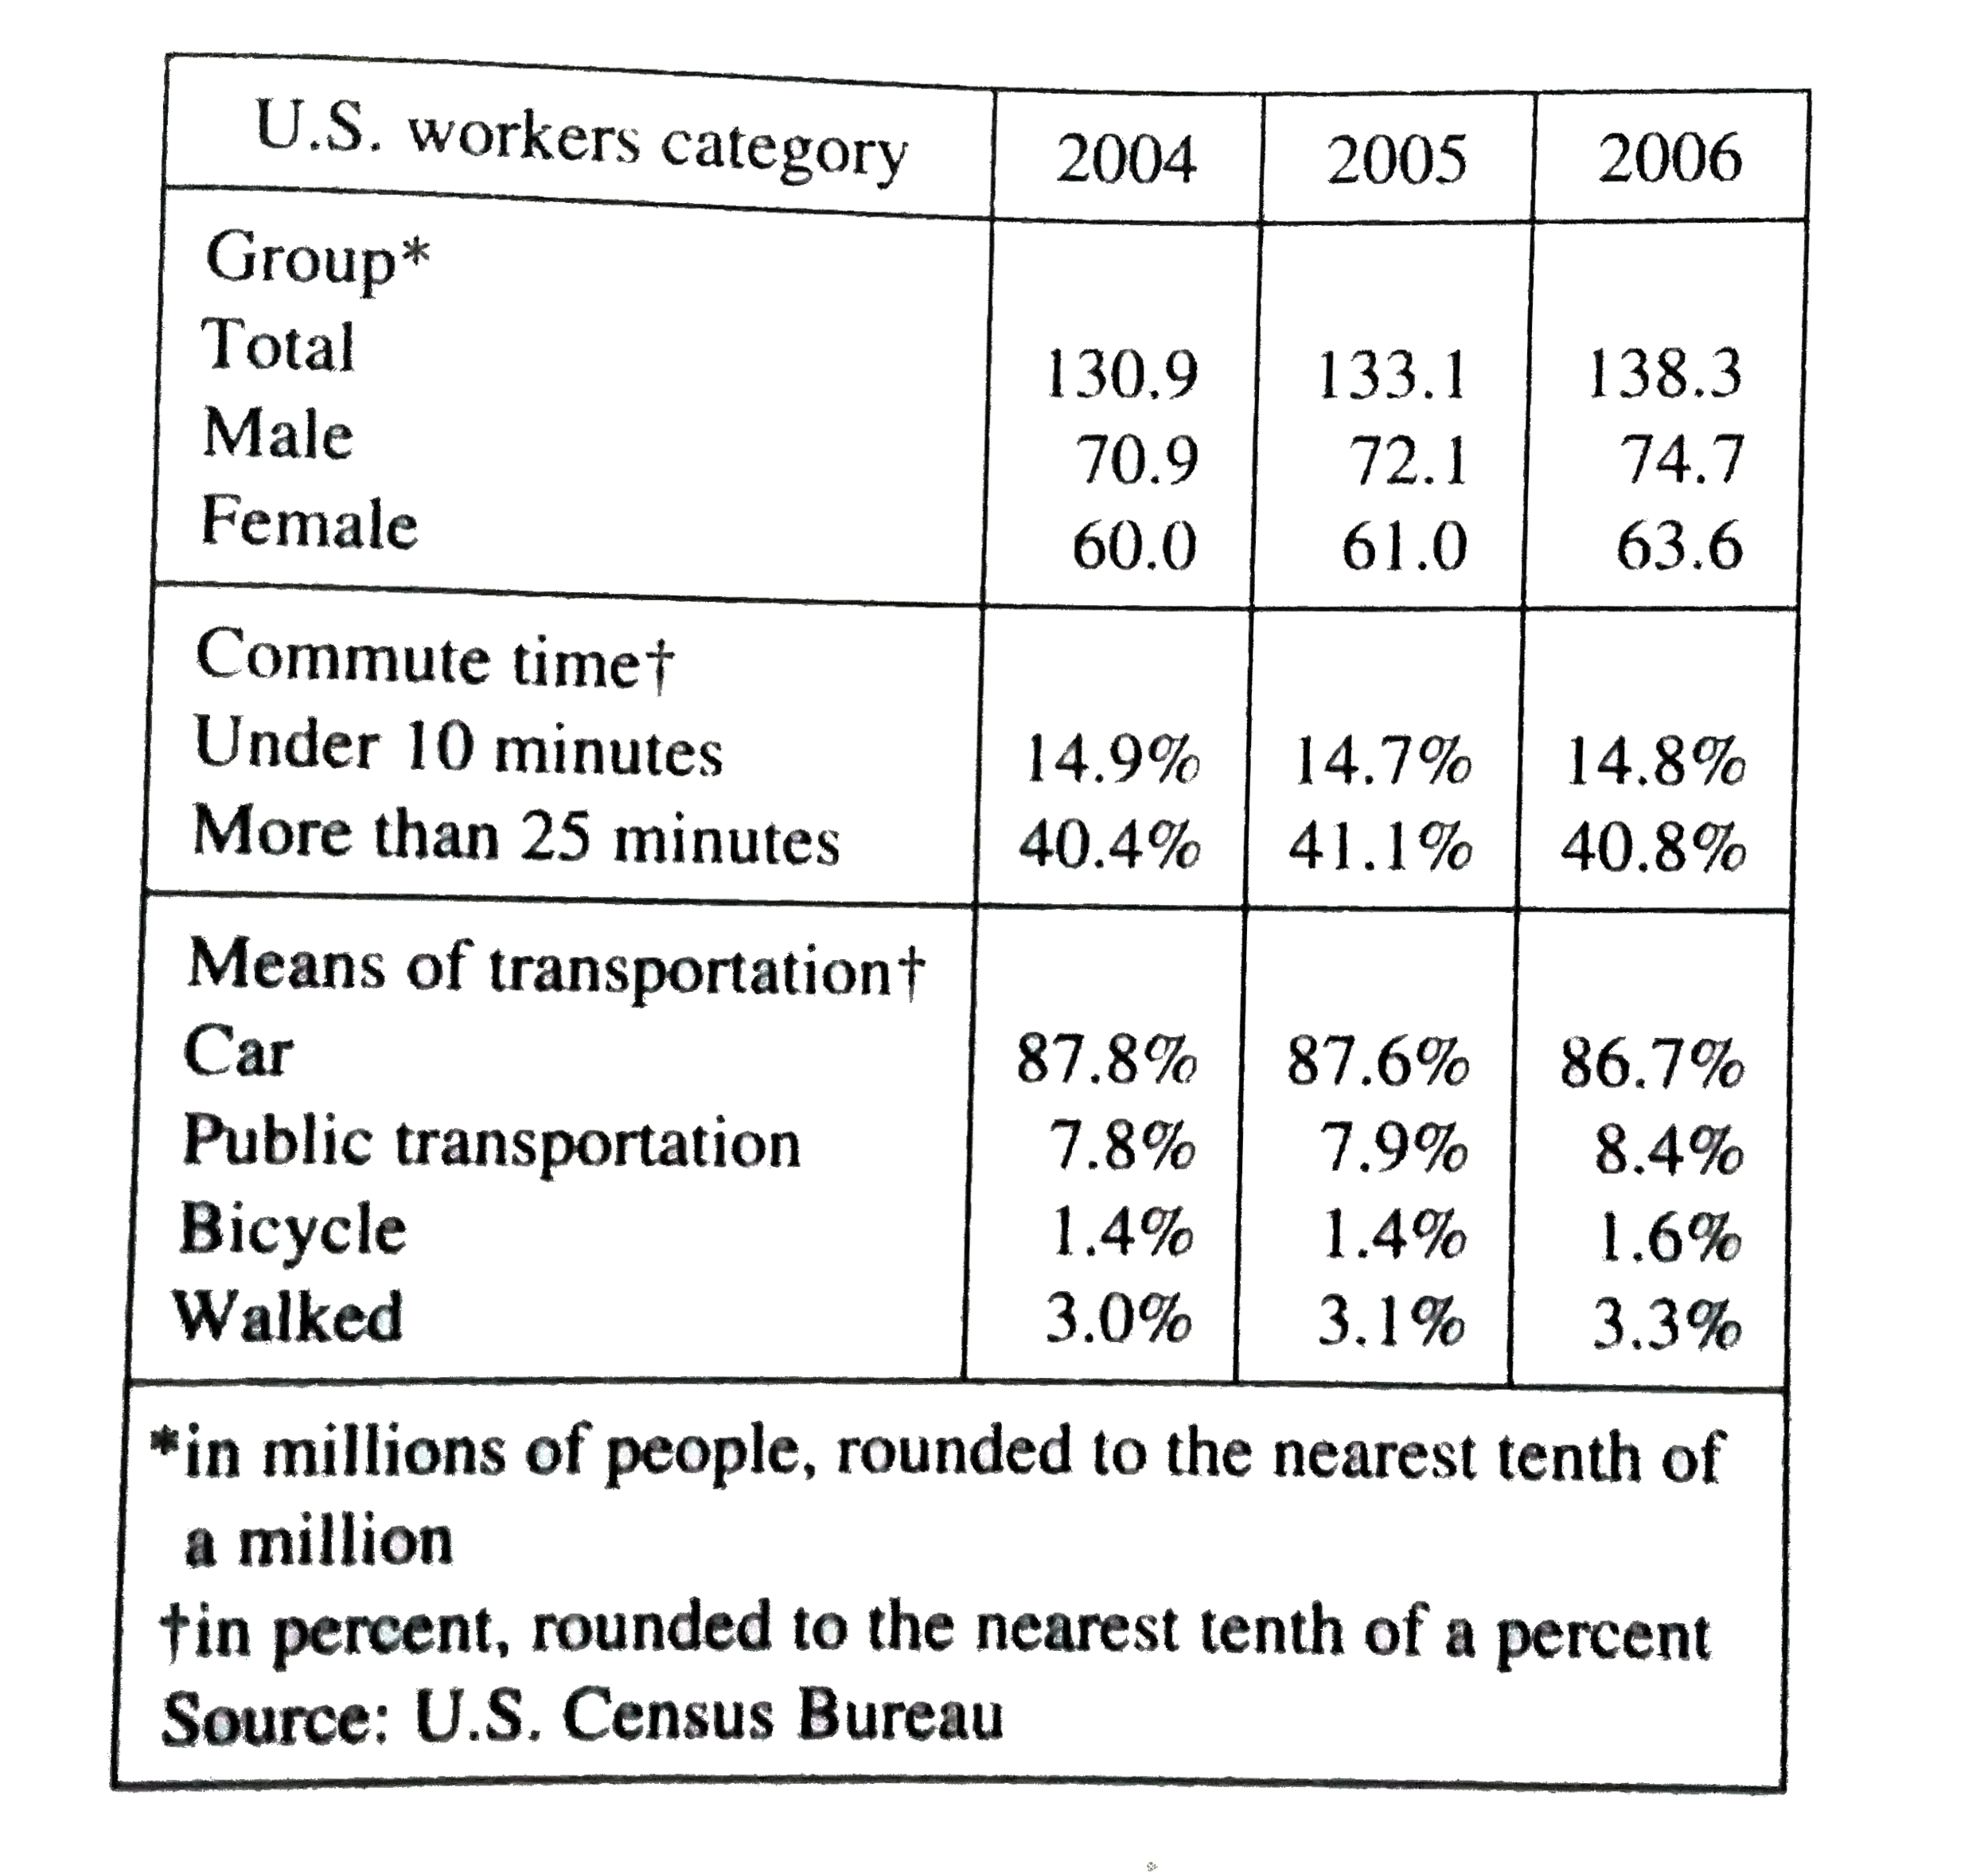
The table below details a recent census report about the commuting habits of U.S . Workers age 16 or over for the years 2004 , 2005 , and 2006.

Expressed in millions of people , what was the average growth per year for female U.S workers age 16 or over from 2004 to 2006 , rounded to the nearest 0.1 million ?
0.5
0.9
1.3
1.8
The correct Answer is:D
Topper's Solved these Questions
Similar Questions
n=12×2t3
The number of mice in a certain colony is shown by the formula above, such that n is the number of mice and t is the time, in months, since the start of the colony. IF 2 years have passed since the start of the colony, how many mice does the colony contain now?
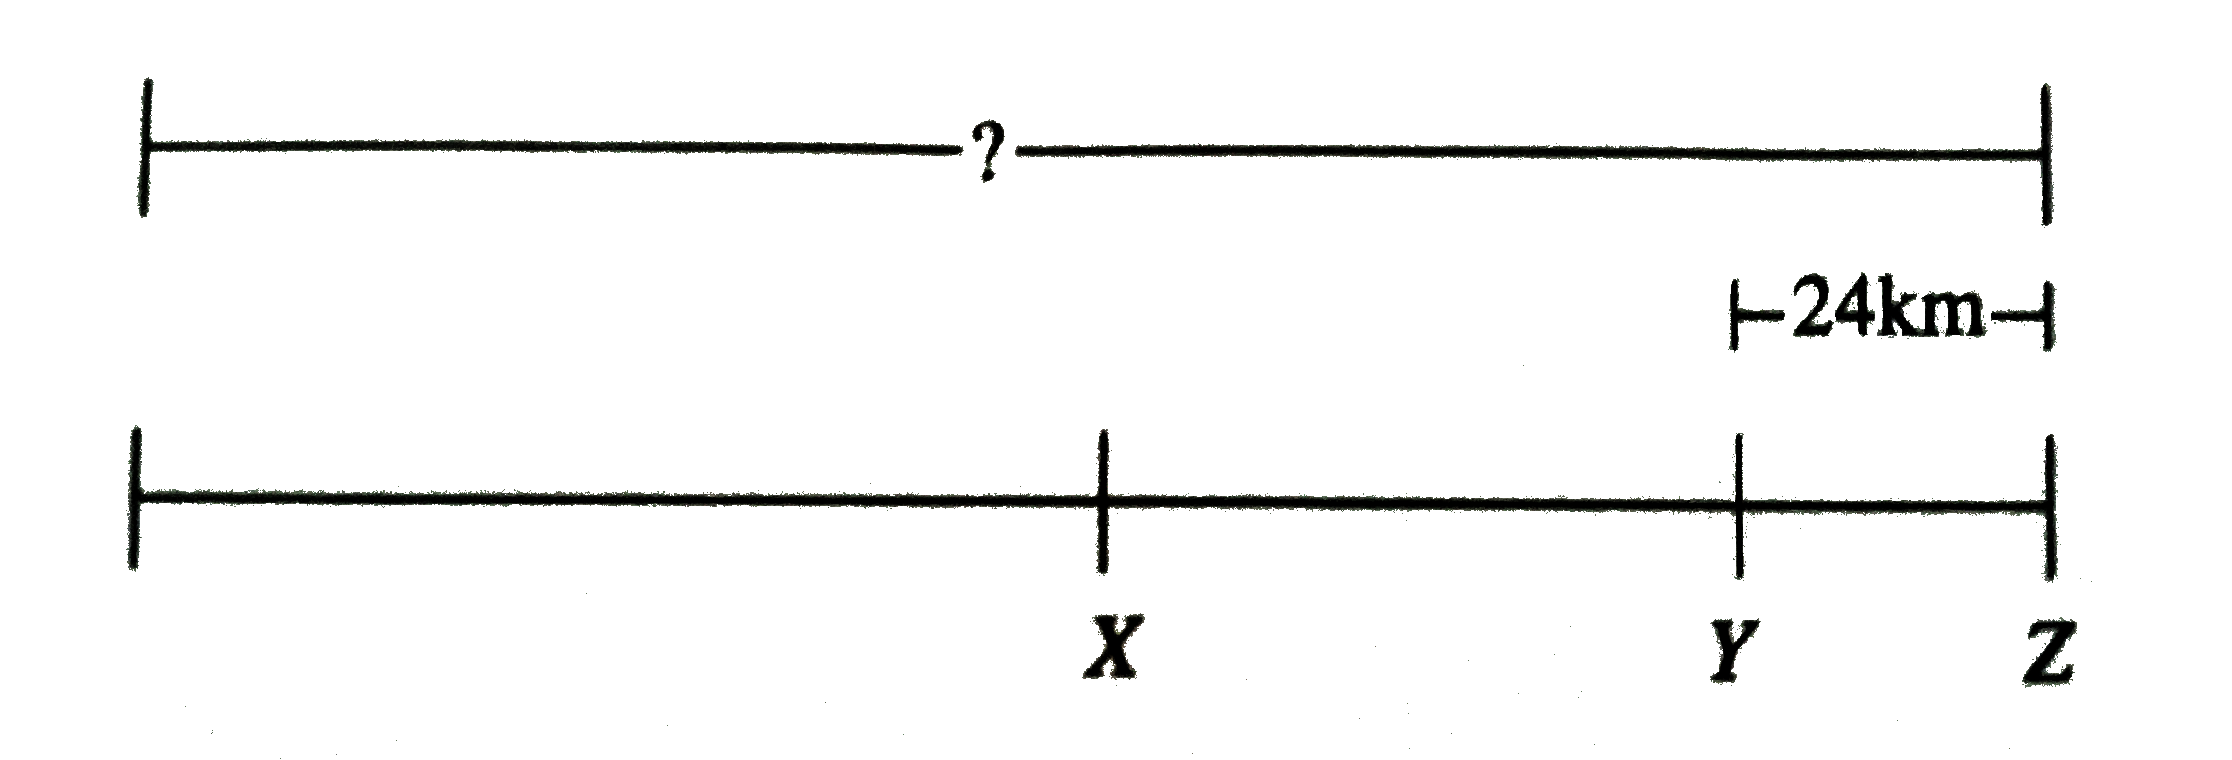
View SolutionIn the hiking trail shown below .X marks the trail's halfway point .If ¯¯¯¯¯¯YZ measures 24 kilometers and is 13 the length of ¯¯¯¯xz , what is the total length , in kilometers of the trail ?

View SolutionWhich of the following are correct chain isomers of butane ? (i)
View SolutionDetermine the point of symmetry of a regular hexagon.
View SolutionDtermine the images of the following figure about the given line :
View SolutionMatch the following Column A to Column B

View SolutionMatch the following Column A to Column B

View SolutionMatch the following Column A to Column B

View SolutionFind the area of figure given below.

View SolutionFind the perimeter of the figure given below.

View SolutionFind the area of the figure given below.

View SolutionThe area of the shaded part in the figure given below is ______.

View SolutionThe inequation represented by the graph given below is :
View SolutionThe inequation that best describes the graph given below is _________
View SolutionThe inequation that best describes the following graph is _________
View SolutionWhich inequations represent the shaded region in the given figure
View Solution
