The production cos of x computers for a company over one year is $175x+$150,000 . To minimize production costs in a given year to $465,000 , how many computers can the company make in that year ?
857
1725
1800
2657
The correct Answer is:C
Topper's Solved these Questions
Similar Questions
Study the given graph and answer the question that follows.
Production and Exports of Computers(In Thousands)by company XYZ in six years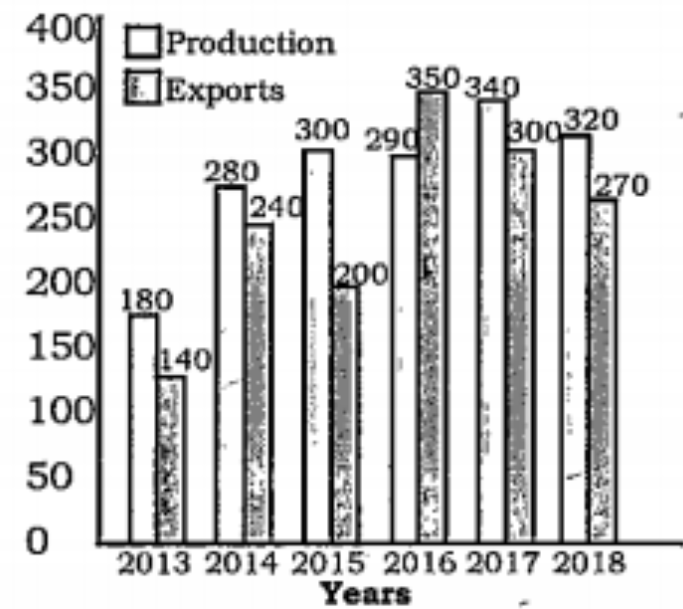
The total production of computers in 2013, 2015 and 2018 is x% of the total exports of computers by the company during the six years. The value of x is:
दिए गए ग्राफ का अध्ययन करें और इस प्रश्न का उत्तर दें। 2013, 2015 और 2018 छह वर्षों के दौरान कंपनी द्वारा कंप्यूटरों के कुल निर्यात का x% है। X का मान है
View SolutionReading the graph of production of paper by three company in different years
View Solution
Knowledge Check
The bar graph given below shows the production (in000 tonnes) of rice of a country for the year 2007 to 2011 .
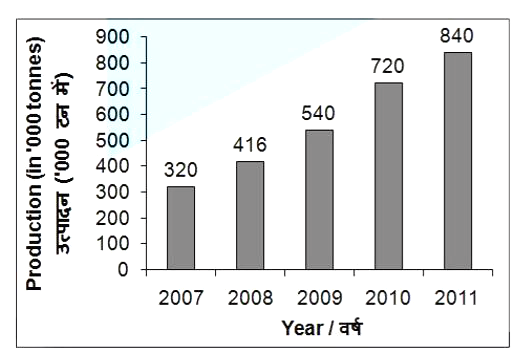
The production of rice in year 2010 is how much percent more that the production of rice in the year 2009 ?A21.5B37.5C42.5D33.33The table given below shows the production (in '000 tonnes) of five companies from 2012 to 2016.
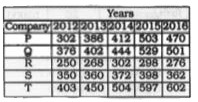
The production of company R in year 2014 is how much per cent more than the production of company R in the year 2013?A12.68B11.56C14.42D15.31The table given below shows the production (in '000 tonnes) of five companies from 2012 to 2016.

The production of all companies in year 2014 is how much per cent less than the production of all companies in the year 2015?A8.25B11.3C14.4D12.5
Below is the volume of production of sugar by company X and Y over 5 years.
The production volume denoted in lakh tones
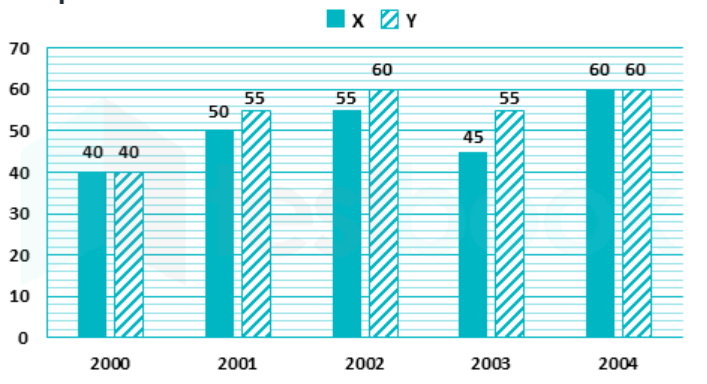
What is the difference in the total production of company X and Y together in years 2000 and 2004?
View SolutionThe line chart given below shows the ratio of poduction to sales of two bike-manufacturing firms over the period of 6 years.
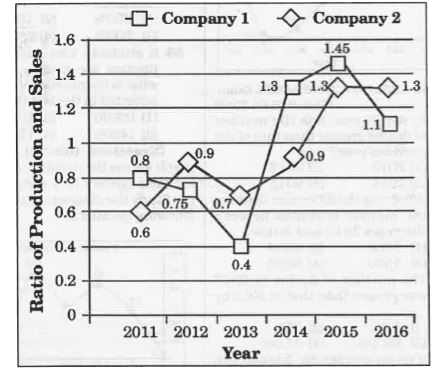
Assume if in any year sales is more than production then both the companies have sufficient stock to meet such instances.
The production of company 1 in year 2014 is 18000 and sales of comapny 2 in year 2012 is 15000. What is the ratio of difference in sales and production of company 1 in year 2014 and that of company 2 in year 2012?
View SolutionThe bar graph given below shows the production (in 000 tonnes) of rice of a country for the year 2007 to 2011 ?
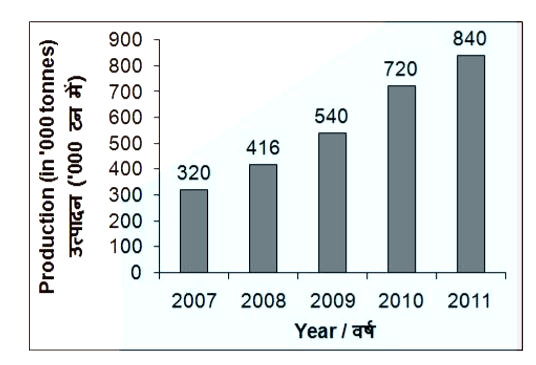
How much is the percentage increase in the production of rice in the year 2008 in comparison to year 2007 ?
View SolutionThe following graph shows the production of cotton cloth (in lakh metres) by three companies A, B and C over the years.
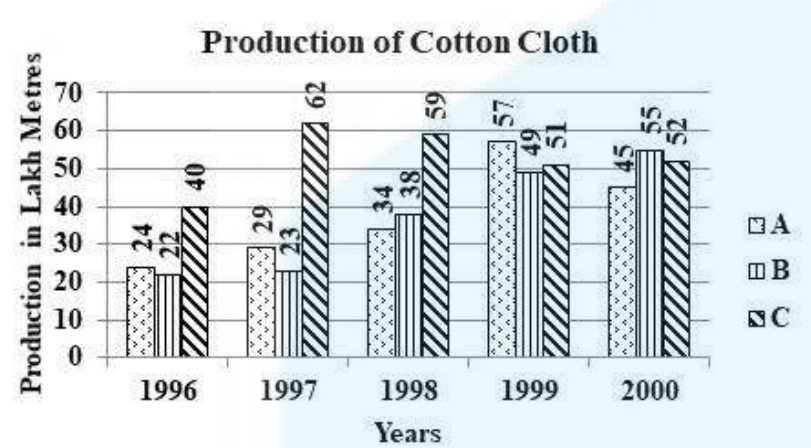
What is the ratio of the production of Company C in the years 1996 and 1997 to the production of Company B in the years 1999 and 2000?
View SolutionStudy the following graph which shows income and expenditure of a company over the years 2005 - 2009 and answer the questions.
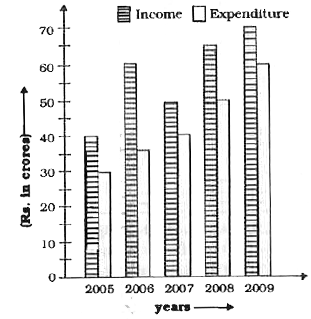
In how many years was the income of the company less than the average income of the given years ?
View Solution
