Reading the graph of production of paper by three company in different years
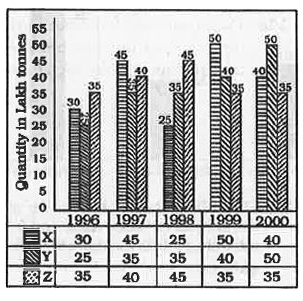
To solve the question regarding the production of paper by companies X, Y, and Z over the years 2006 to 2010, we will follow these steps:
Step 1: Identify the Production Values
- For Company Z in 2008:
- From the bar graph, the production value is represented by the dark bar for the year 2008. The height of the bar indicates a production of 45 lakh tons.
- For Company Y in 2006:
- The production value is represented by the blank bar for the year 2006. The height of the bar indicates a production of 25 lakh tons.
Step 2: Calculate the Difference
- We need to find the difference between the production of Company Z in 2008 and Company Y in 2006.
- Difference = Production of Z in 2008 - Production of Y in 2006
- Difference = 45 lakh tons - 25 lakh tons = 20 lakh tons
Step 3: Conclusion for the First Question
- The required difference is 20 lakh tons.
---
Step 4: Calculate the Average Production for Company X (2008-2010)
- Production Values:
- 2008: 25 lakh tons
- 2009: 50 lakh tons
- 2010: 40 lakh tons
- Average Production = (Sum of Observations) / (Total Number of Observations)
- Average for X = (25 + 50 + 40) / 3 = 115 / 3 = 38.33 lakh tons
Step 5: Calculate the Average Production for Company Y (2008-2010)
- Production Values:
- 2008: 35 lakh tons
- 2009: 40 lakh tons
- 2010: 50 lakh tons
- Average for Y = (35 + 40 + 50) / 3 = 125 / 3 = 41.67 lakh tons
Step 6: Calculate the Ratio of Average Productions
- Ratio = Average Production of X : Average Production of Y
- Ratio = 38.33 : 41.67
- To simplify, multiply both sides by 3 to eliminate the fraction:
- Ratio = 115 : 125
- Simplifying gives us 23 : 25.
Step 7: Conclusion for the Second Question
- The ratio of the average production of Company X to Company Y is 23:25.
---
Step 8: Calculate the Percent Increase for Company Y (2006 to 2009)
- Production in 2006: 25 lakh tons
- Production in 2009: 40 lakh tons
- Percent Increase = ((New Value - Old Value) / Old Value) * 100
- Percent Increase = ((40 - 25) / 25) * 100 = (15 / 25) * 100 = 60%
Step 9: Conclusion for the Third Question
- The percent increase in the production of Company Y from 2006 to 2009 is 60%.
---
- For Company Z in 2008:
- From the bar graph, the production value is represented by the dark bar for the year 2008. The height of the bar indicates a production of 45 lakh tons.
- For Company Y in 2006:
- The production value is represented by the blank bar for the year 2006. The height of the bar indicates a production of 25 lakh tons.
- We need to find the difference between the production of Company Z in 2008 and Company Y in 2006.
- Difference = Production of Z in 2008 - Production of Y in 2006
- Difference = 45 lakh tons - 25 lakh tons = 20 lakh tons
- The required difference is 20 lakh tons.
- Production Values:
- 2008: 25 lakh tons
- 2009: 50 lakh tons
- 2010: 40 lakh tons
- Average Production = (Sum of Observations) / (Total Number of Observations)
- Average for X = (25 + 50 + 40) / 3 = 115 / 3 = 38.33 lakh tons
- Production Values:
- 2008: 35 lakh tons
- 2009: 40 lakh tons
- 2010: 50 lakh tons
- Average for Y = (35 + 40 + 50) / 3 = 125 / 3 = 41.67 lakh tons
- Ratio = Average Production of X : Average Production of Y
- Ratio = 38.33 : 41.67
- To simplify, multiply both sides by 3 to eliminate the fraction:
- Ratio = 115 : 125
- Simplifying gives us 23 : 25.
- The ratio of the average production of Company X to Company Y is 23:25.
- Production in 2006: 25 lakh tons
- Production in 2009: 40 lakh tons
- Percent Increase = ((New Value - Old Value) / Old Value) * 100
- Percent Increase = ((40 - 25) / 25) * 100 = (15 / 25) * 100 = 60%
- The percent increase in the production of Company Y from 2006 to 2009 is 60%.
Similar Questions
Formation of table for the production and sales of a company in different years
View SolutionDirections (Questions 21-26): The bar graph given below gives the data of the production of paper (in lakh tonnes) by three different companies X, Y and Z over last 5 years. Study the graph carefully and answer the questions that follow. Production of Paper (in lakh tons) By Companies X, Y and Z over the Years (FIGURE) What is the difference between the production of Company Z in 2008 and Company Y in 2006? (a) 2 lakh tons (b) 20 lakh tons (c) 20 thousand tons (d) 200 lakh tons (e) None of these
View Solution
Knowledge Check
The graph shows the production of food grains of a country in different years. Study the graph and answer the questions.
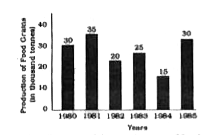
The difference between the production of food grains in the years 1981 and 1985 isA500 tonnesB100 tonnesC5000 tonnesD10000 tonnesThe graph shows the production of food grains of a country in different years. Study the graph and answer the questions.
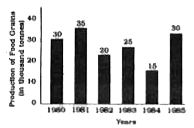
The sum of the production of food grains in the years 1982 and 1984 is equal to that in the year :A1980B1981C1983D1985The bar graph provided below gives the data of the production of paper (in lakh tonnes) by three different companies X, Y and Z over the years. Study the bar chart and answer the following questions.
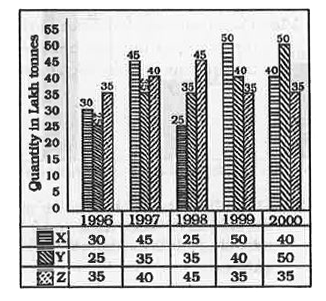
The difference between the production of company Z in 1998 and company Y in 1996 is :A25,00,000 tonnesB10,00,000 tonnesC15,00,000 tonnesD20,00,000 tonnes
Below is the volume of production of sugar by company X and Y over 5 years.
The production volume denoted in lakh tones
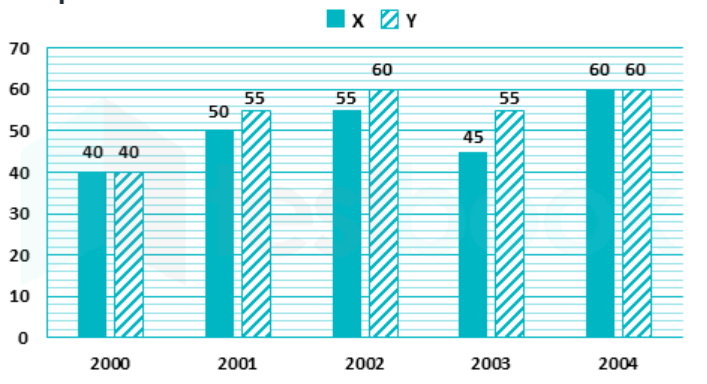
What is the difference in the total production of company X and Y together in years 2000 and 2004?
View SolutionThe bar graph provided below gives the data of the production of paper (in lakh tonnes) by three different companies X, Y and Z over the years. Study the bar chart and answer the following questions.
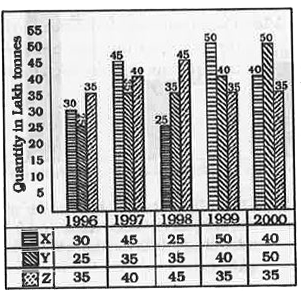
The percentage of production of company Z to the production of company Y is maximum in :
View SolutionThe bar graph provided below gives the data of the production of paper (in lakh tonnes) by three different companies X, Y and Z over the years. Study the bar chart and answer the following questions.
The average production for five years is maximum for which company?
View SolutionThe bar graph provided below gives the data of the production of paper (in lakh tonnes) by three different companies X, Y and Z over the years. Study the bar chart and answer the following questions.
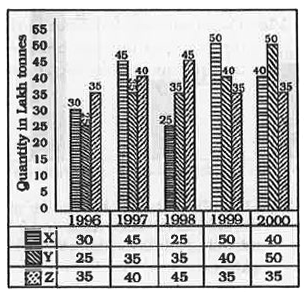
The percentage increase in the production of company Y from 1996 to 1999 is :
View SolutionThe bar graph provided below gives the data of the production of paper (in lakh tonnes) by three different companies X, Y and Z over the years. Study the bar chart and answer the following questions.
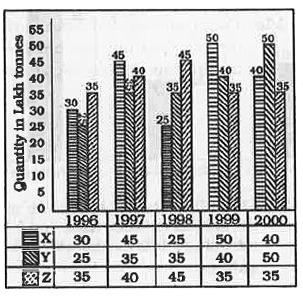
The ratio of the average production of company X in the production of company X in the period 1998-2000 to the average production of company Y in the same period is :
View Solution
