For a certain gas which deviates a little from ideal behaviour, a plot between P/p vs P was found to be non- linear . The intercept on y-axis will be :
RTM
MRT
MZRT
RTM
The correct Answer is:a
(a) P(V−nb)=nRT
PV−P n b=nRT d=MassVolume
PV=nRT+P n b n=MassM
PMassd=nRT+P n b
Pd=nMassRT+P n bMass
Pd=RTM+PbM
Topper's Solved these Questions
- BOOK - NARENDRA AWASTHICHAPTER - GASEOUS STATEEXERCISE - Level 1 (Q.31 To Q.60)1videos
GASEOUS STATE
- BOOK - NARENDRA AWASTHICHAPTER - GASEOUS STATEEXERCISE - Level 1 (Q.121 To Q.150)1videos
GASEOUS STATE
- BOOK - NARENDRA AWASTHICHAPTER - ELECTROCHEMISTRYEXERCISE - Level 3 - Subjective Problems1videos
ELECTROCHEMISTRY
- BOOK - NARENDRA AWASTHICHAPTER - IONIC EEQUILIBRIUMEXERCISE - Exercise196videos
IONIC EEQUILIBRIUM
Similar Questions
In an adsorption experiment, a graph between log (xm) versus log P was found to be linear with a slope of 45∘ . The intercept on the log (xm) axis was found to be 0.3010 . Calculate the amount of the gas adsorbed per gram of charcoal under a pressure of 0.5 atm .
View SolutionIn an adsorption experiment, a graph between log (xm) versus log P was found to be linear with a slope of 45∘ . The intercept on the log (xm) axis was found to be 0.3010 . Calculate the amount of the gas adsorbed per gram of charcoal under a pressure of 0.5 atm .
View Solution
Knowledge Check
- Question 1 - Select One
In an adsorption experiment, a graph between log (xm) versus log P was found to be linear with a slope of 45∘ . The intercept on the log y axis was found to be 0.301 . Calculate the amount of the gas adsorbed per gram of charcoal under a pressure of 3.0 atm.
A4B2C6D8 - Question 2 - Select One
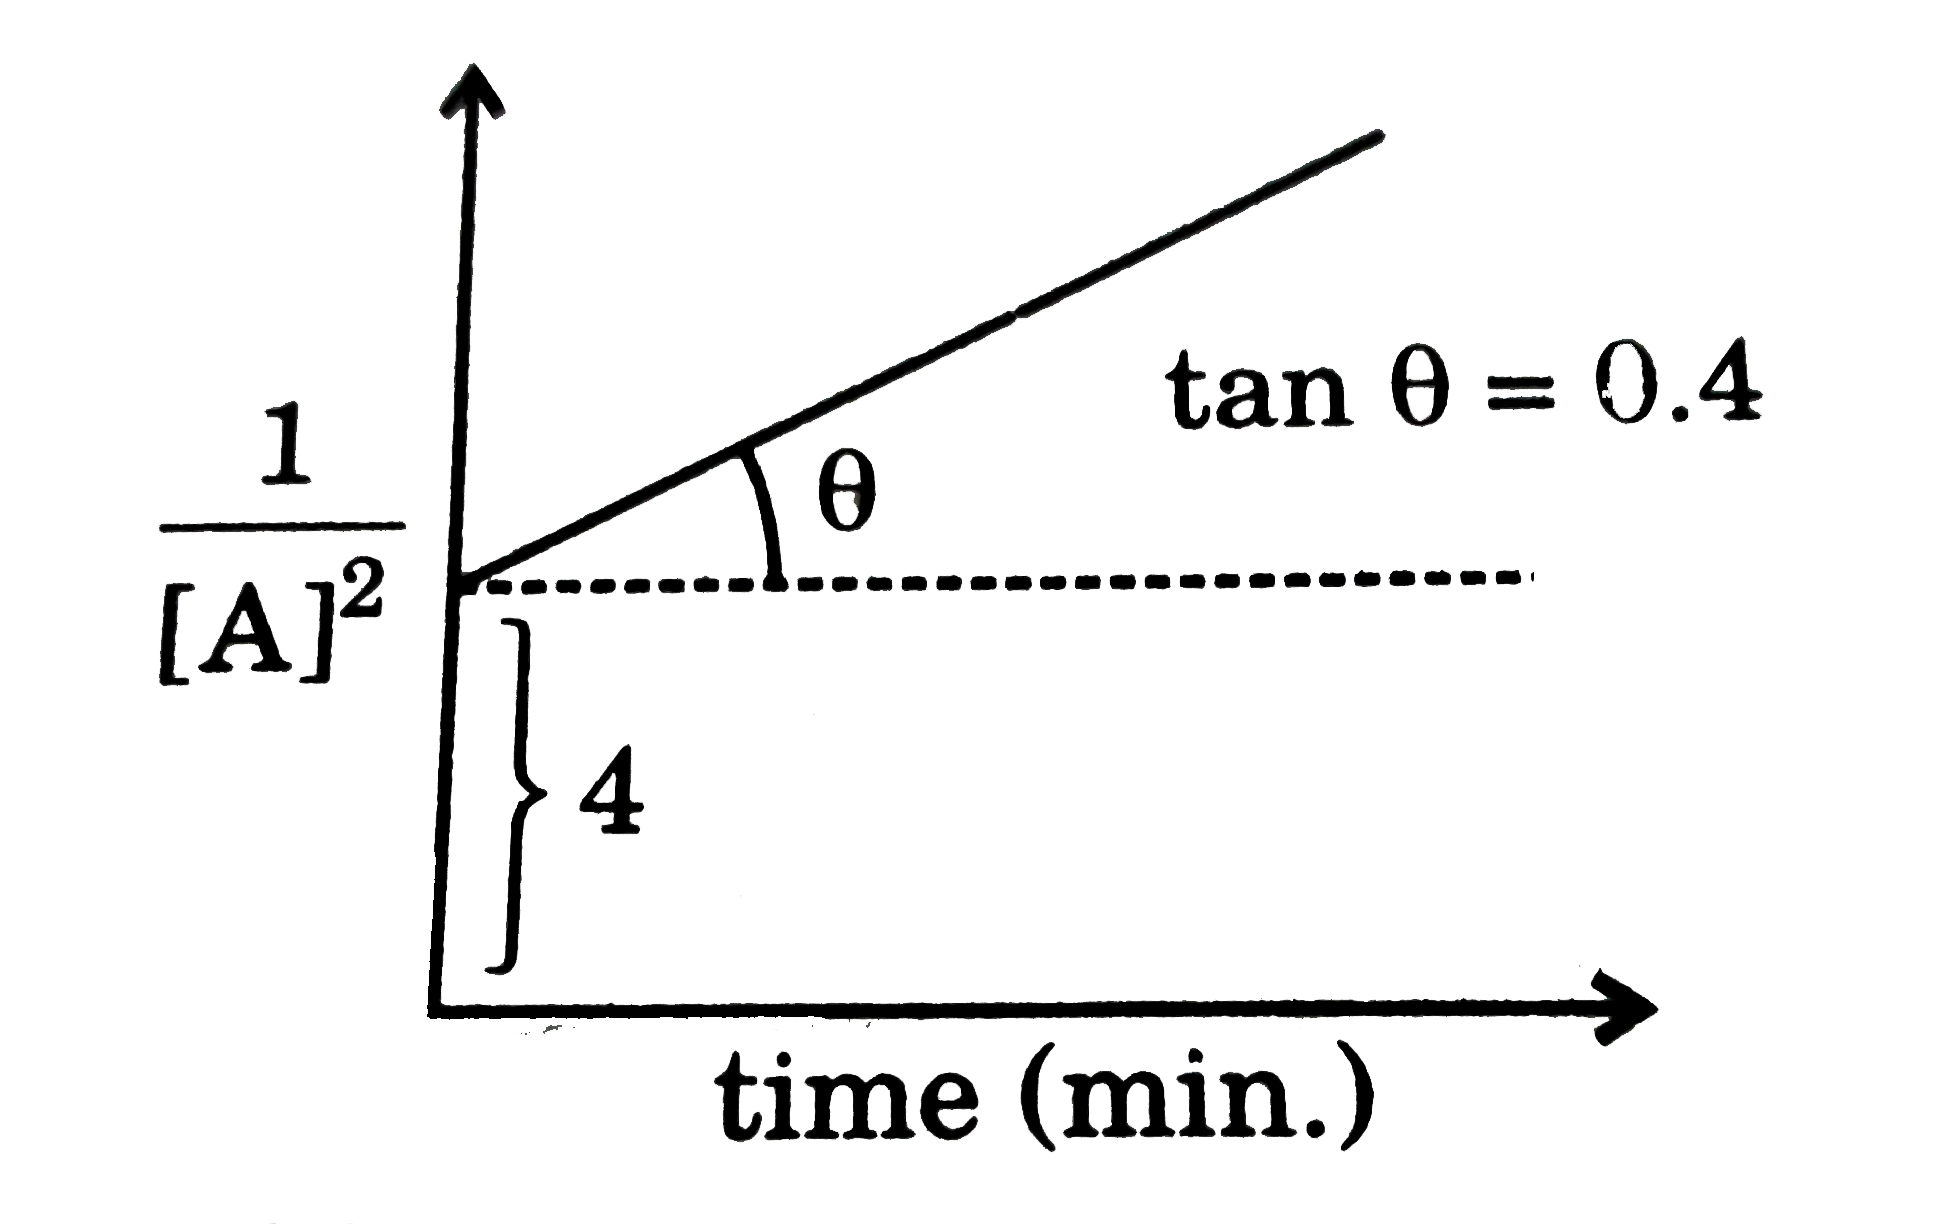
For a reaction A→ Product, a graph plotted between 1[A]2 vs time is found to be linear with slope = 0.4 and y intercept equal to 4 as shown. The rate of disapparance of A at the initial stages will be:

[A] is in terms of molarityA0.025M/secB4.16×10−4M/secC8.33×10−4M/secD0.05M/sec - Question 3 - Select One or More
Which of the following measure the deviation from ideal behaviour of gas?
ACollision diameterBCollision frequencyCCompressibility factorDvan der Waal's constant 'a'
The graph between PV vs P at constant temperature is linear parallel to the pressure axis.
View SolutionWhich of the following graph between (x/m) vs P is correct?
View SolutionGases deviate from ideal gas behaviour at high pressure. Which of the following is correct for non ideality?
View SolutionFor a real gas obeying van der waal's equation , graph is plotted between PVm (y- axis) and P (x - axis) where Vm is molar volume . Y - intercept the graph is
View SolutionRead the paragraph carefully and answer the following questions:
Real gases deviate from ideal behaviour because of the following two faulty assumptions of kinetic theory.
(I) The actual volume occupied by molecules is negligible as compared to the total volume of the gas.
(II) The forces of attraction and repulsion between molecules of the gas are negligible. The extent of deviation of a real gas from ideal behaviour is expressed in terms of compressibility factor (z).
Hence, suitable corrections were applied to the ideal gas equation so that it can also explain the behaviour of real gases. The equation obtained by applying the two corrections to the usual gas equation is known as van der Waal equation.
A Volume correction Corrected (ideal) volume = (V - b) Where b is the effective volume of the molecules.
B. Pressure correction (intermolecular attraction corection). Corrected (ideal) pressure = P + P
However, P=aV2
∴ The van der Waal's equation becomes (P+an2V2)(V−nb)=nRT
The pressure correction used on the ideal gas behaviour is generally indicated by P +P what does this P' stand forView Solution

