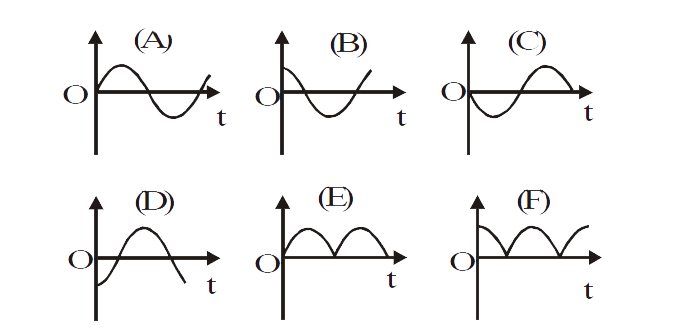
Which of the following graph between vs P is correct?
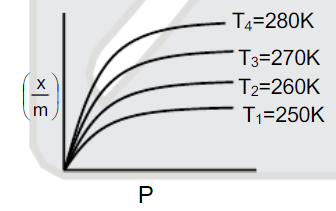
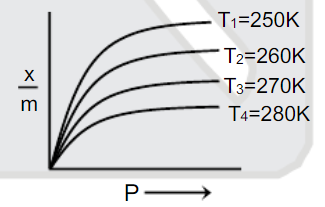
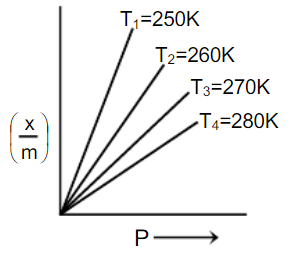
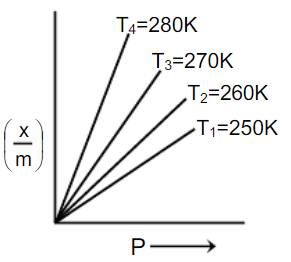
To solve the problem of determining the correct graph between xm (extent of adsorption) versus pressure P, we need to analyze the relationship between these variables based on the principles of adsorption.
1. Understanding the Variables:
- x represents the amount of adsorbate (the substance being adsorbed).
- m is the mass of the adsorbent (the substance on which adsorption occurs).
- xm represents the extent of adsorption, which is the amount of adsorbate per unit mass of adsorbent.
- P is the pressure of the gas.
2. Adsorption isotherm:
- The relationship between the extent of adsorption and pressure is described by adsorption isotherms. Generally, adsorption increases with an increase in pressure, but this relationship can be influenced by temperature.
3. Direct Proportionality:
- Adsorption is directly proportional to pressure P at a constant temperature. This means that as pressure increases, the extent of adsorption xm also increases.
4. Effect of Temperature:
- Adsorption is inversely proportional to temperature. Lower temperatures favor adsorption, while higher temperatures tend to decrease it.
5. Analyzing the Graphs:
- We need to identify which graph correctly represents the relationship between xm and P while considering the effect of temperature.
- The correct graph should show that as pressure P increases, xm also increases, but it should also reflect that this relationship is valid at lower temperatures.
6. Conclusion:
- After analyzing the given graphs, the second graph is the correct one because it shows an increase in xm with an increase in pressure P, while also implying a decrease in temperature, which aligns with the principles of adsorption.
Final Answer:
The correct graph between xm vs P is the second graph.
- x represents the amount of adsorbate (the substance being adsorbed).
- m is the mass of the adsorbent (the substance on which adsorption occurs).
- xm represents the extent of adsorption, which is the amount of adsorbate per unit mass of adsorbent.
- P is the pressure of the gas.
- The relationship between the extent of adsorption and pressure is described by adsorption isotherms. Generally, adsorption increases with an increase in pressure, but this relationship can be influenced by temperature.
- Adsorption is directly proportional to pressure P at a constant temperature. This means that as pressure increases, the extent of adsorption xm also increases.
- Adsorption is inversely proportional to temperature. Lower temperatures favor adsorption, while higher temperatures tend to decrease it.
- We need to identify which graph correctly represents the relationship between xm and P while considering the effect of temperature.
- The correct graph should show that as pressure P increases, xm also increases, but it should also reflect that this relationship is valid at lower temperatures.
- After analyzing the given graphs, the second graph is the correct one because it shows an increase in xm with an increase in pressure P, while also implying a decrease in temperature, which aligns with the principles of adsorption.
The correct graph between xm vs P is the second graph.
Similar Questions
Knowledge Check
Which of the following graph is correct
A_2019_CBT6_E01_019_O01.png) B
B_2019_CBT6_E01_019_O02.png) C
C_2019_CBT6_E01_019_O03.png) D
D_2019_CBT6_E01_019_O04.png)
Which of the following graph is correct?
A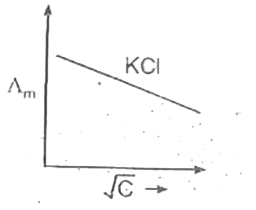 B
B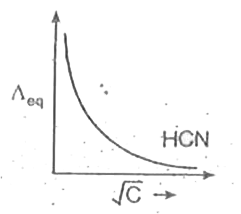 C
C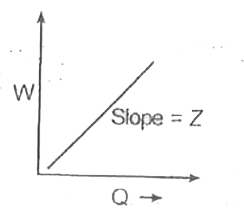 DAll of these
Which of the following graphs are correct ?
A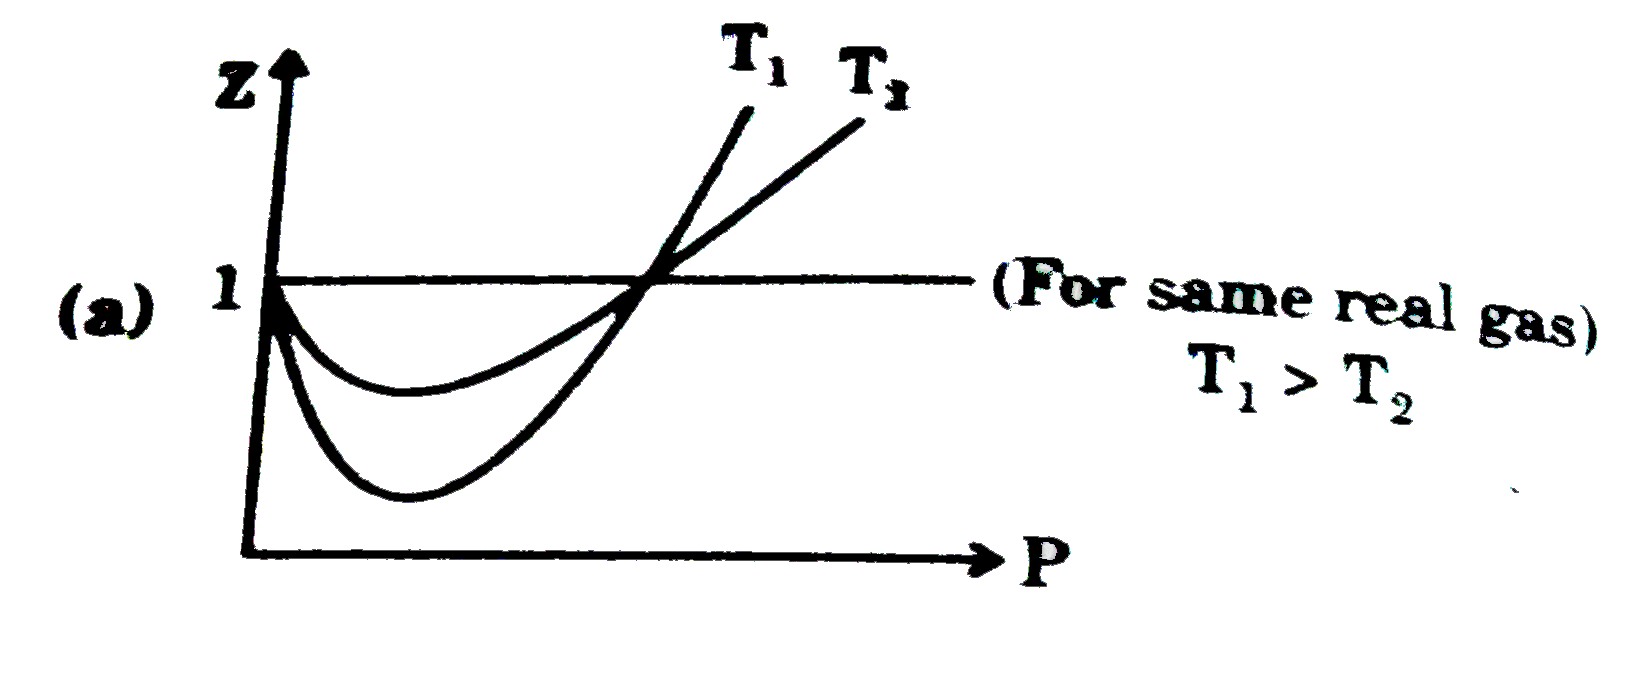 B
B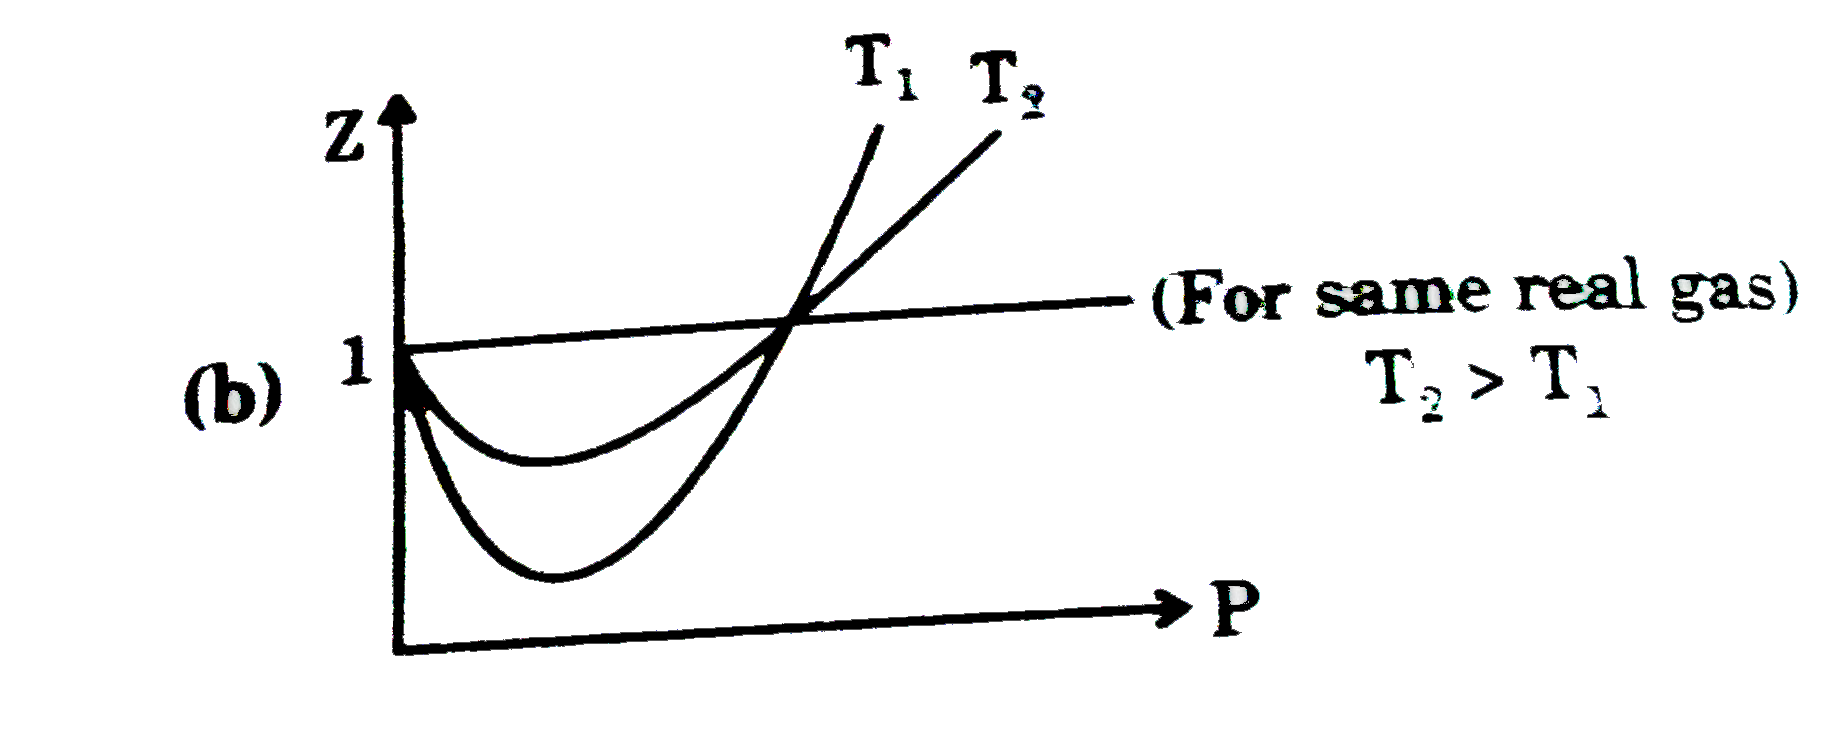 C
C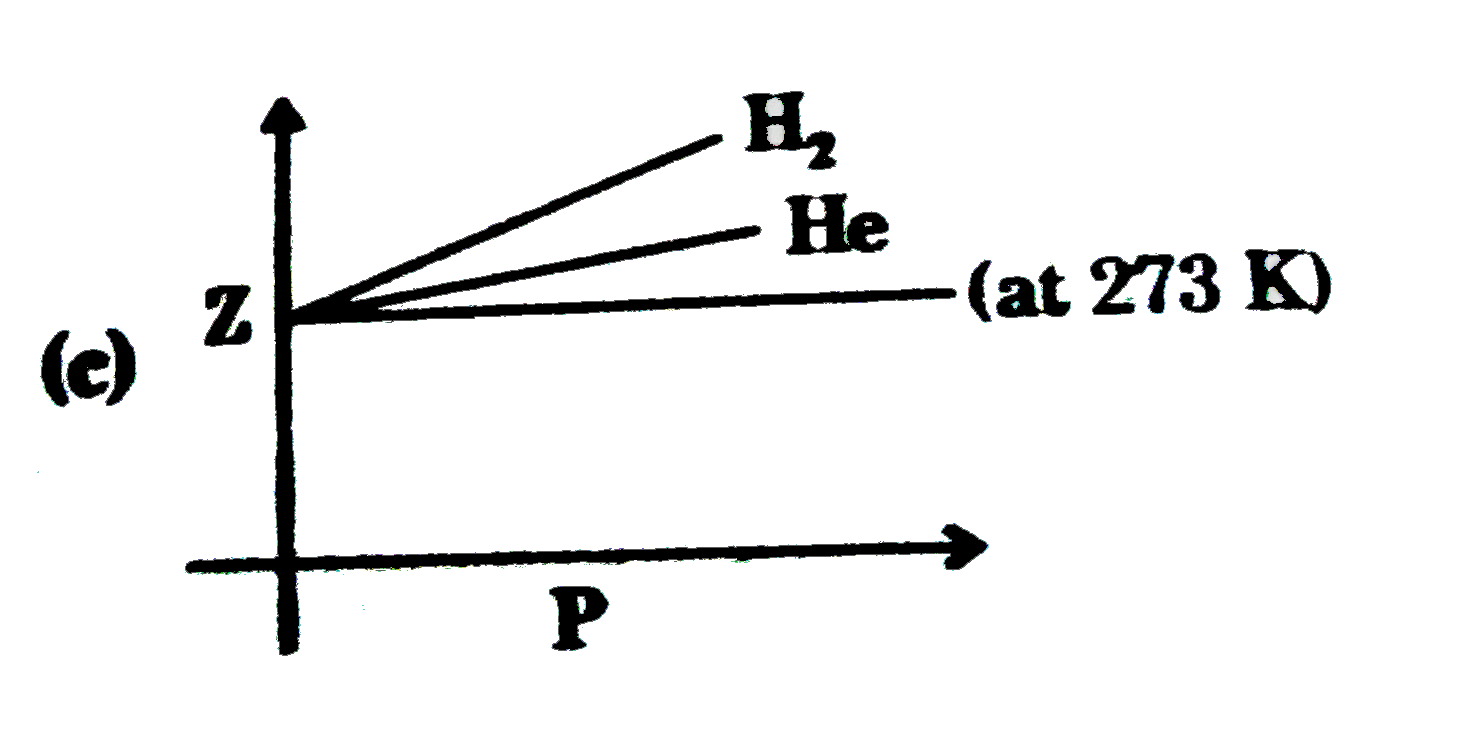 D
D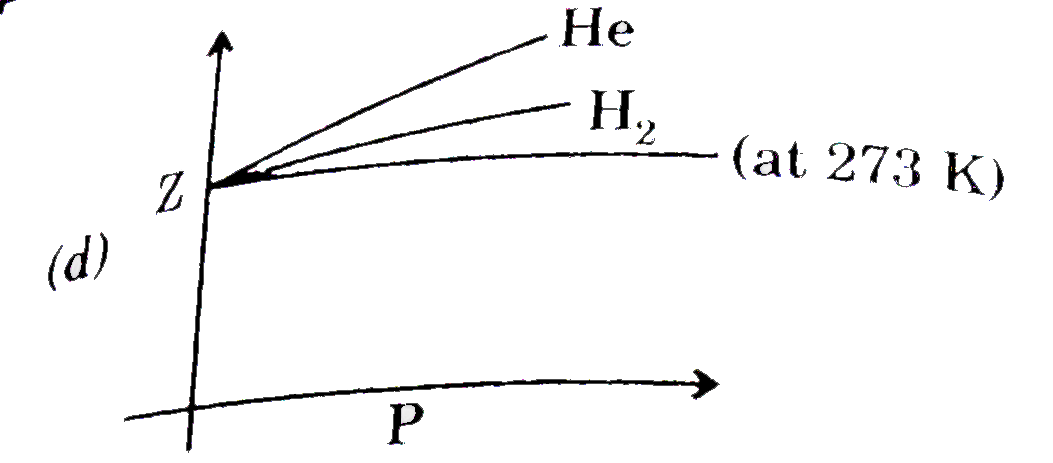
Which one of the following graphs between molar conductivity (Am) versus √C is correct?
View SolutionWhich of the following graph ploltted between P and V is INCORRECT ?
View SolutionGraph between velocity and displacement is shown in the following figure:
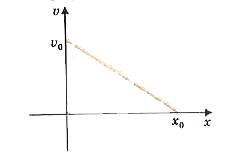
Which of the following graphes represents the correct variation of acceleration with displacement
View SolutionWhich of the following graphs is/are correct.
View SolutionWhich of the following is correct graph between Probability density sπ2(r) vs radial distance of electron (r) form nucleus for 3 s ?
View Solution

