What will be the slope of a logP Vs logT graph plotted at constant volume?
As per Gay Lusaac’s law P=kT or logP=logT+logk . This is a graph of a straight line with slope=1 and intercept=logk .
Similar Questions
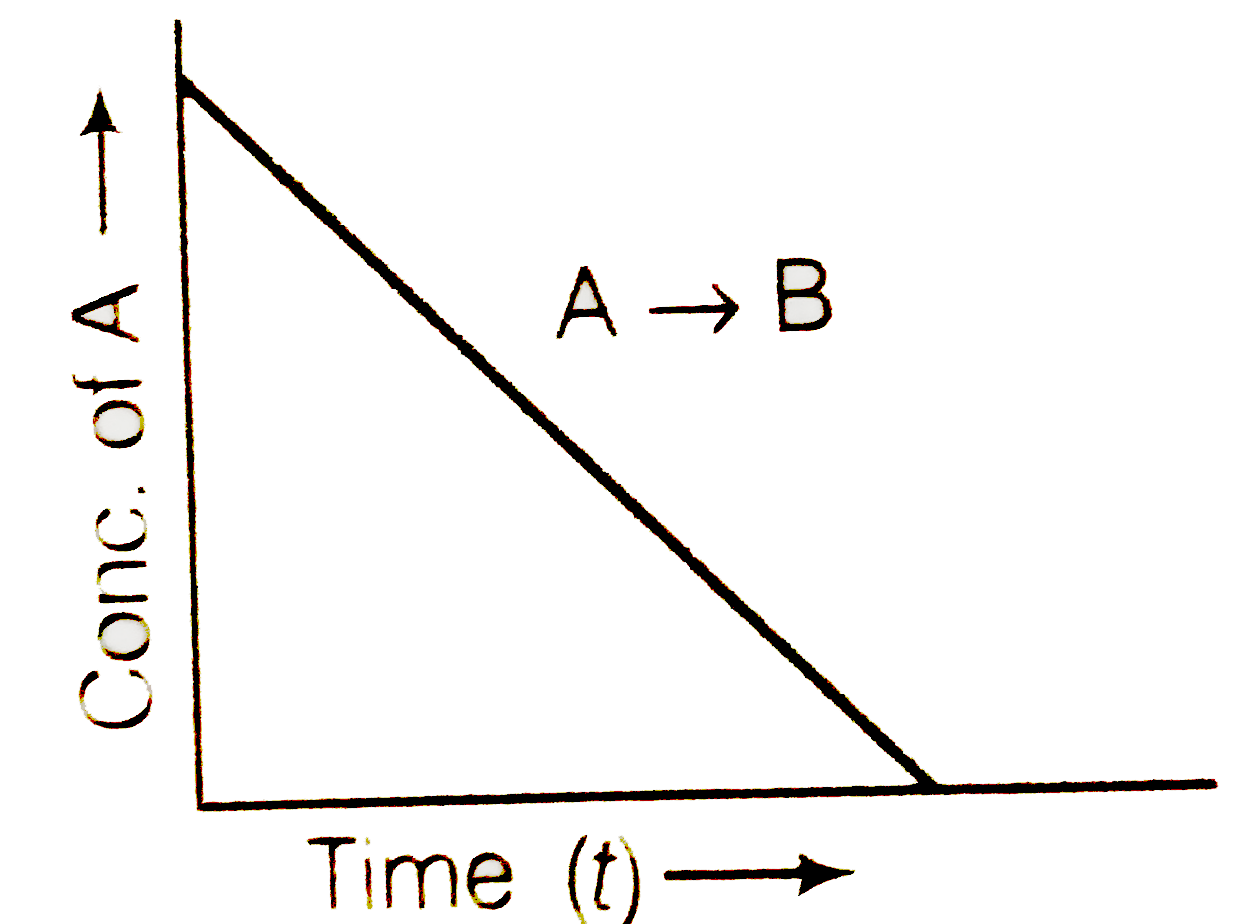
For a general reaction A→B, plot of concentration of A vs time is given in figure. Answer the following questions on the basis of this graph.
(i) what is the order of the reaction?
(ii) What is the slope of the curve ?
(iii) What are the units of rate constant?

View SolutionFor a general reaction A→B, plot of concentration of A vs time is given in figure. Answer the following questions on the basis of this graph.
(i) what is the order of the reaction?
(ii) What is the slope of the curve ?
(iii) What are the units of rate constant?

View Solution
Knowledge Check
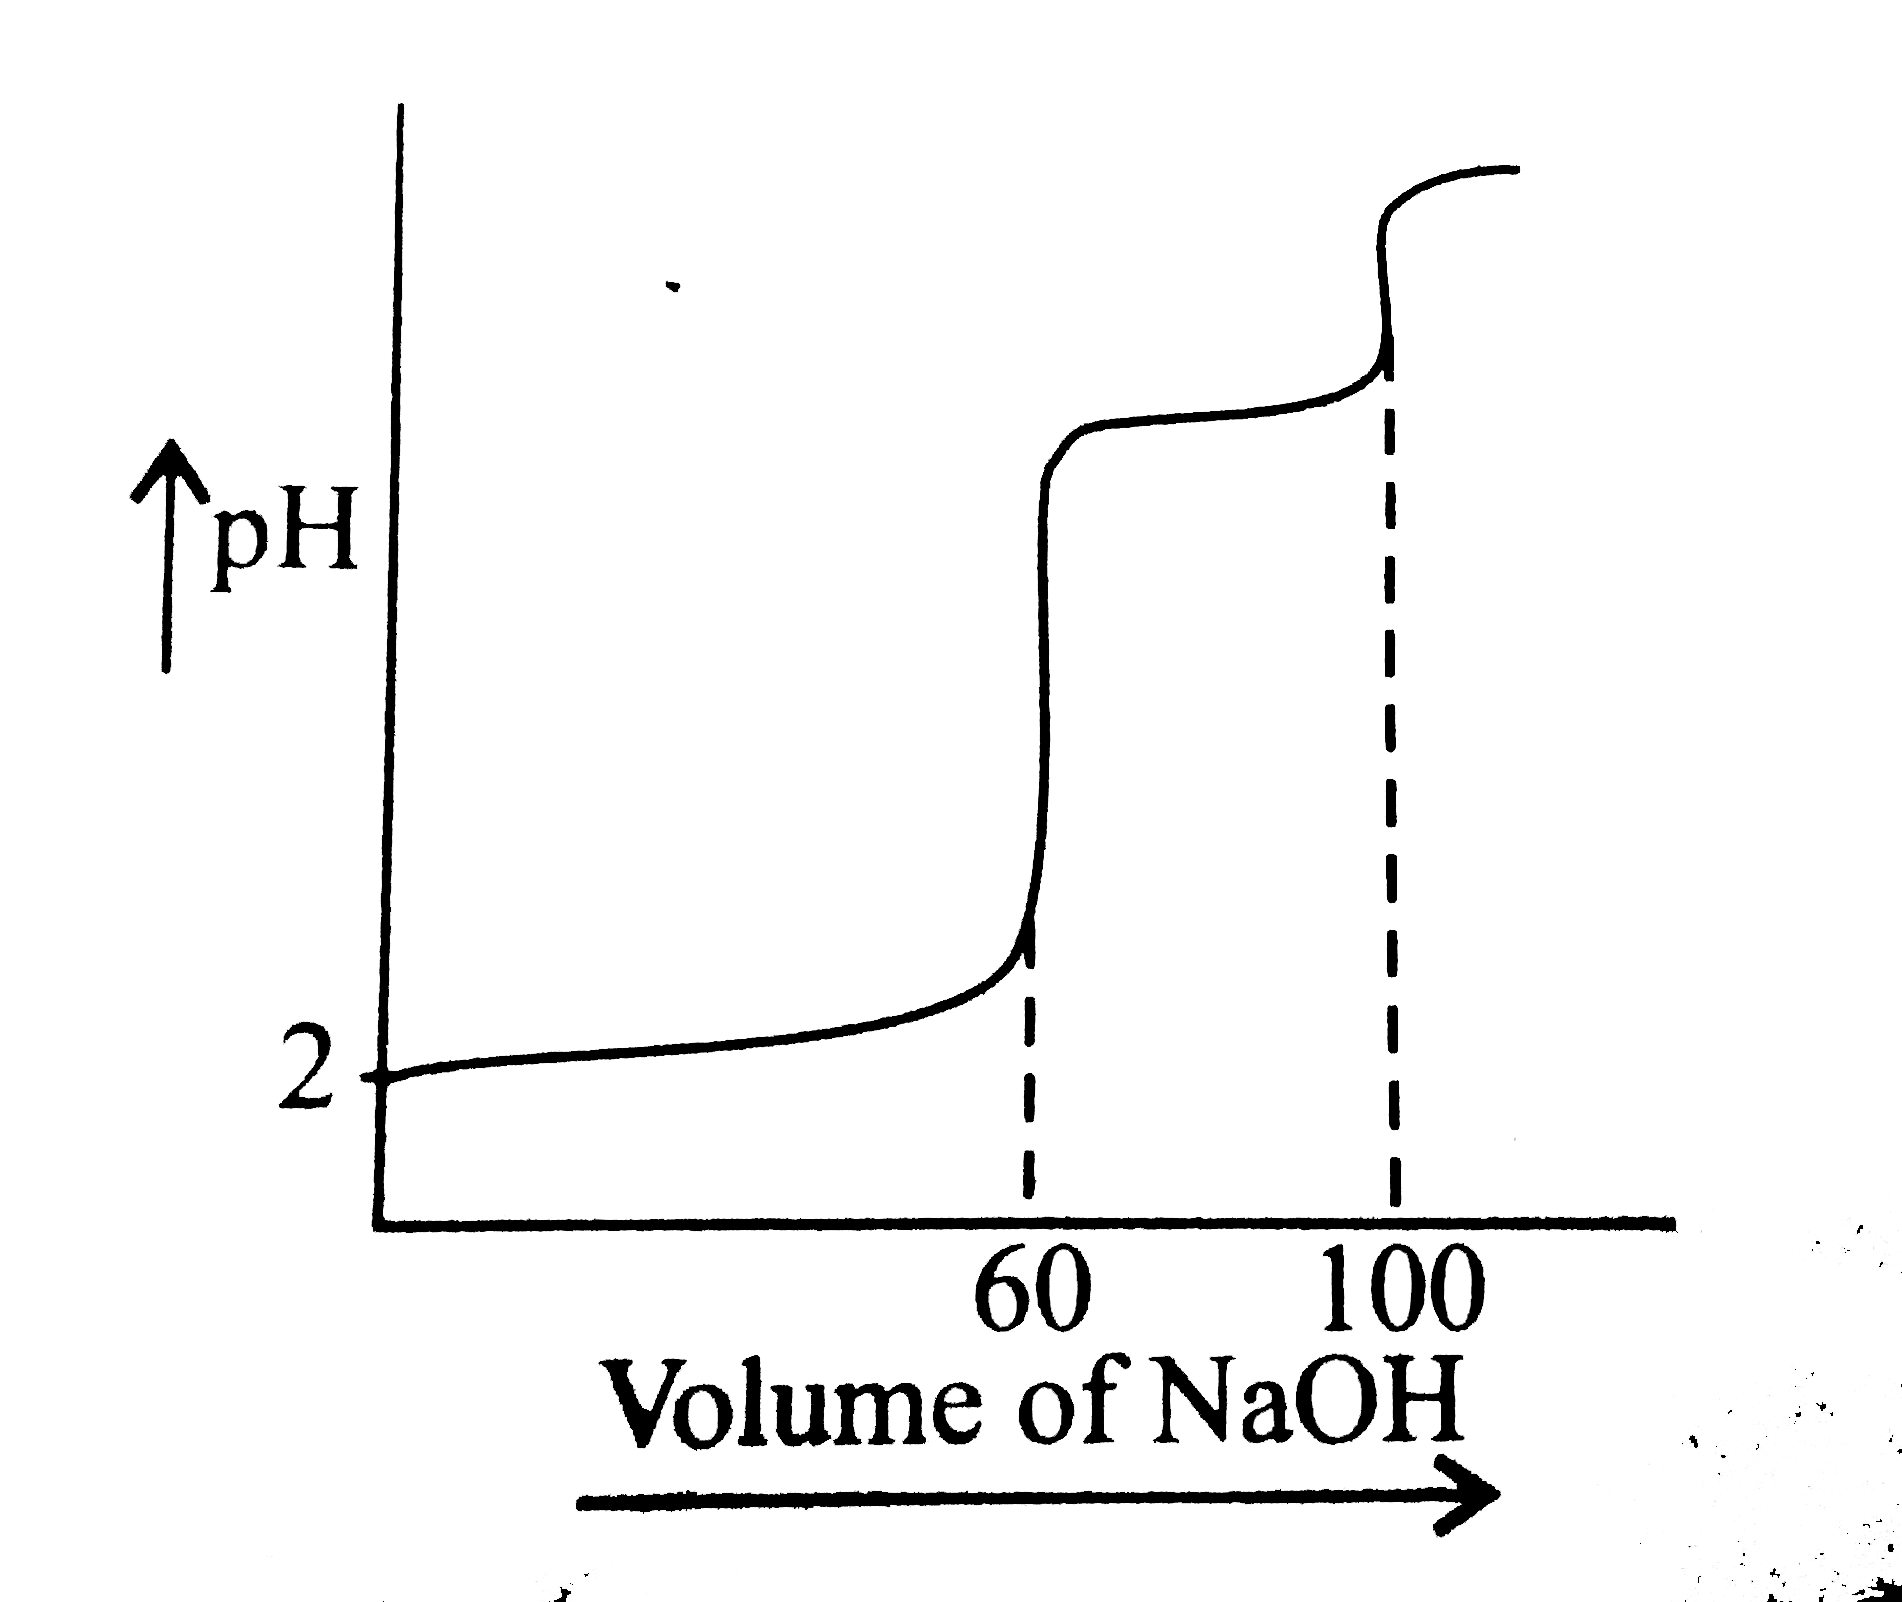
The following graph represents the titration of pH vs volume
 AA diprotic acid.BTwo monoprotic acids with the same Ka but different concentrations.CTwo monoprotic acids with different Ka but the same concentration.DTwo monoprotic acids with differnet Ka and different concentartions.
In a plot of log k vs 1/T, the slope is
A−Ea/2.303BEa/2.303RCEa/2.303D−Ea/2.303RIn a plot of log k vs 1/T, the slope is
A−Ea/2.303BEa/2.303RCEa/2.303D−Ea/2.303R
For a general reaction A→B. plot of concentrating of A vs time is given in fig.
Answer the following questions on the basis of this graph.
a) What is the order of the reaction?
b) What is the slope of the curve?
c) What are the units of rate constant?

View SolutionThe following graph represents the titration of pH vs volume

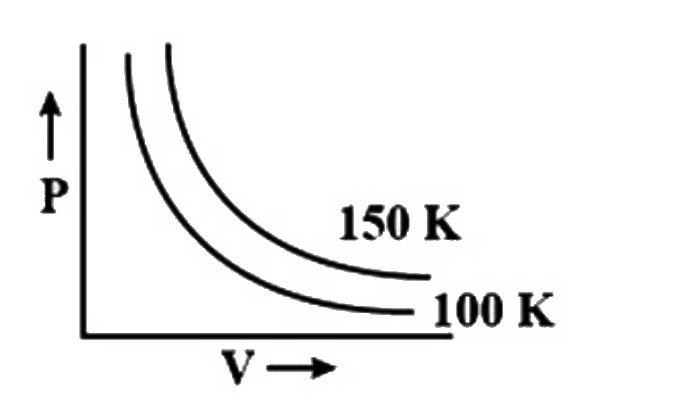
View SolutionA graph is plotted between pressure and volume at different temperature. On the basis of the graph what changes will you observe in the volume if
(i) the pressure is increased at constant temperature
(ii) the temperature is decreased at constant pressure

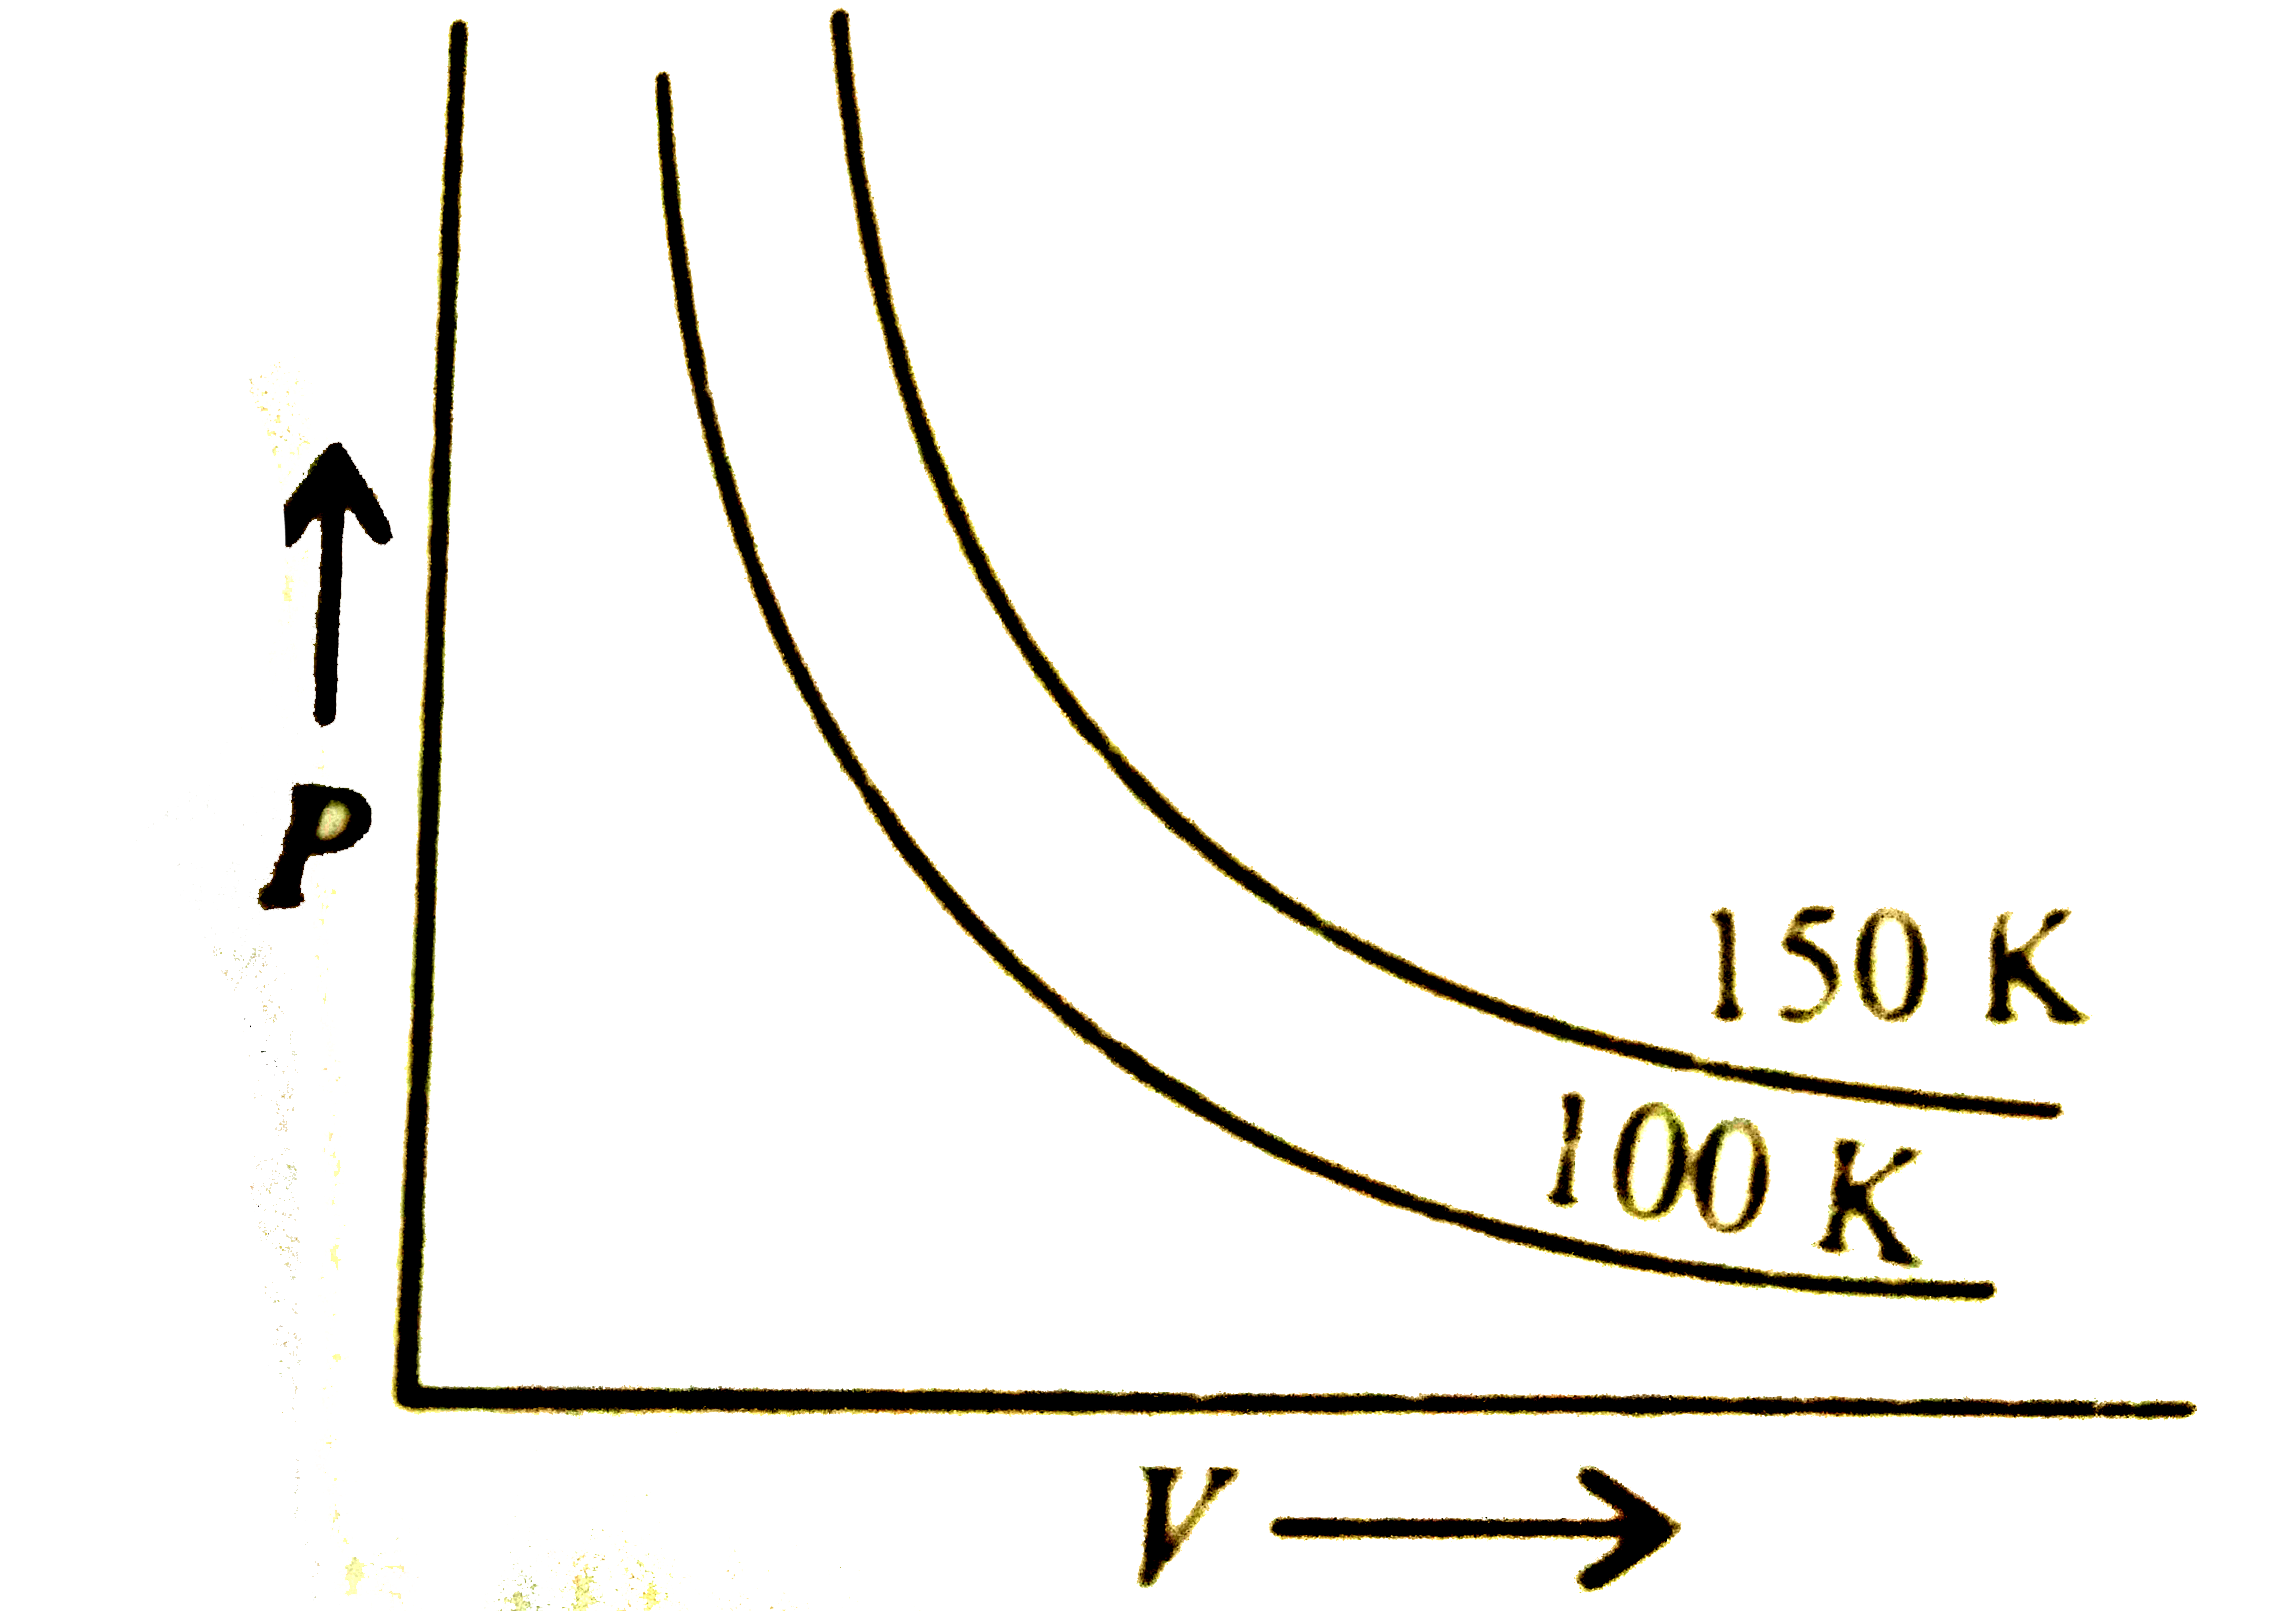
View SolutionA graph is plotted between pressure and volume at different temperatures . On the basis of the graph what changes will you observe in the volume if
(i) the pressure is increased at constant temperature .
(ii) the temperature is decreased at constant pressure .

View SolutionIn a plot of log k vs 1/T, the slope is
View Solution
