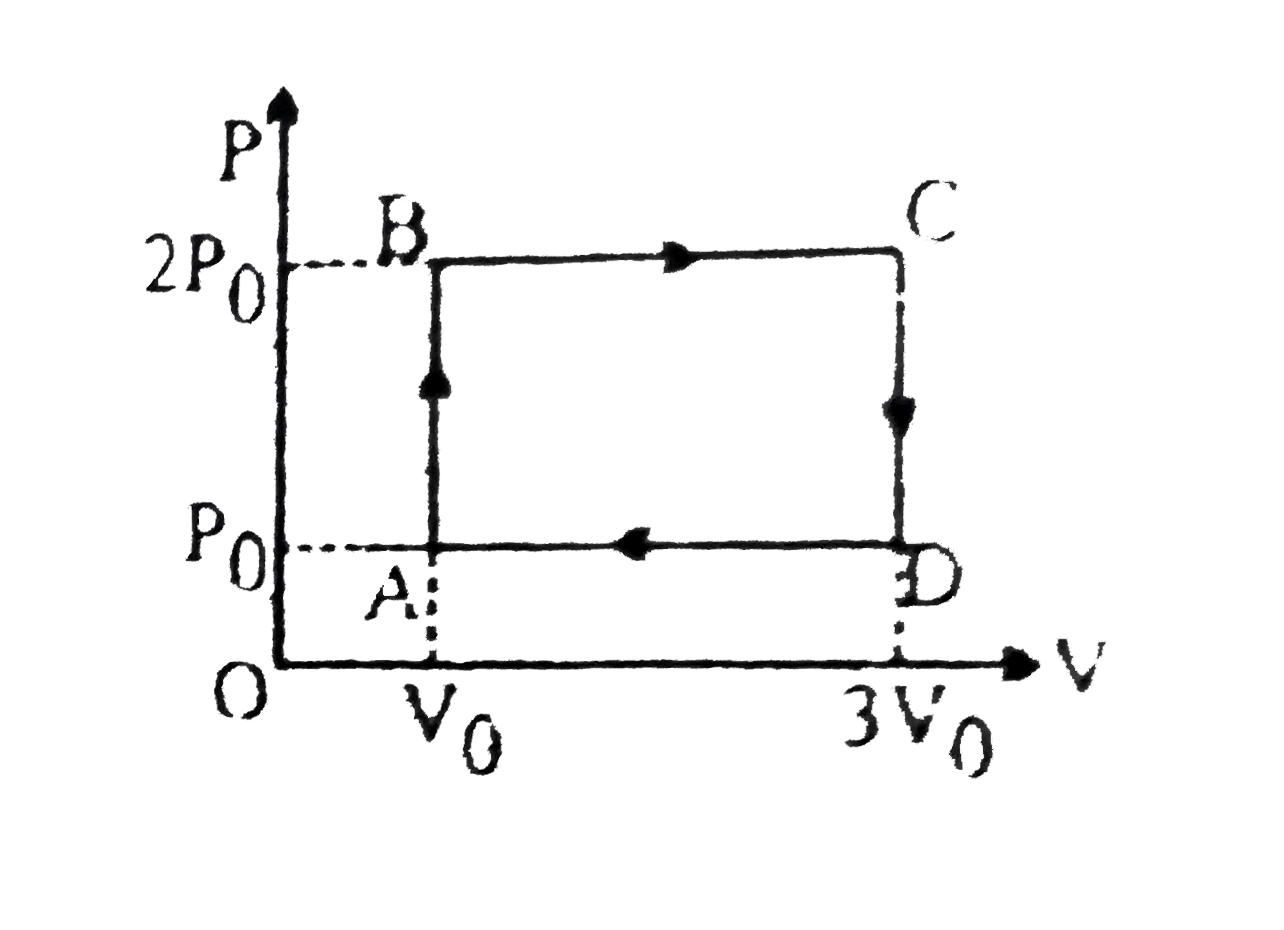
The diagram shows a P - V graph of a thermodynamic behaviour of an ideal gas. Find out from this graph.
Work done in complete cycle A→B→C→D→A.
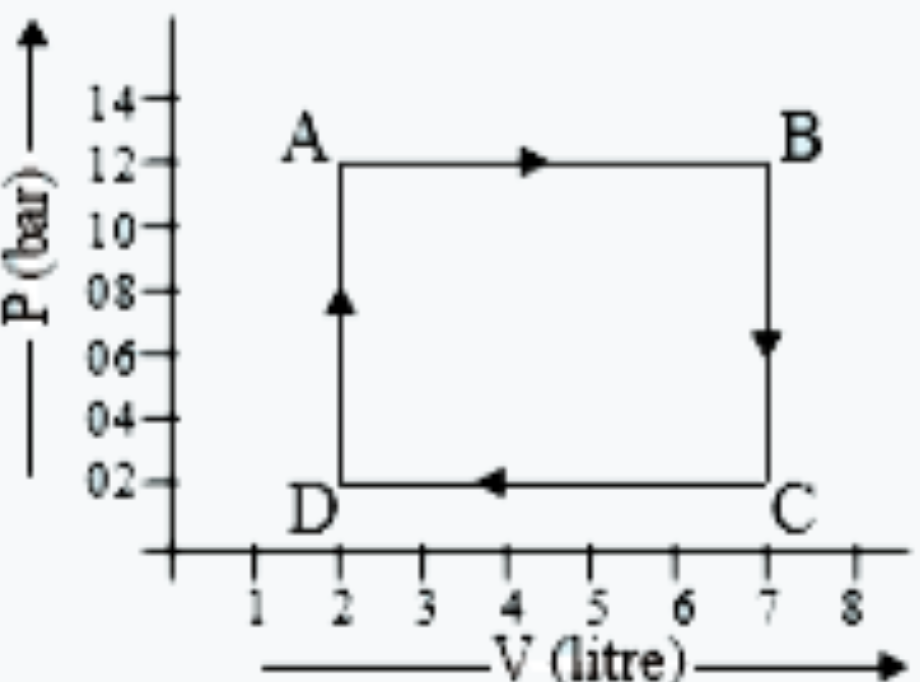
Net work done in the whole cycle =−6000+1000=−5000J.
i.e., net work is done by the gas.
Similar Questions
The diagram shows a P - V graph of a thermodynamic behaviour of an ideal gas. Find out from this graph.
Work done in process A→B,B→C,C→D and D→A.
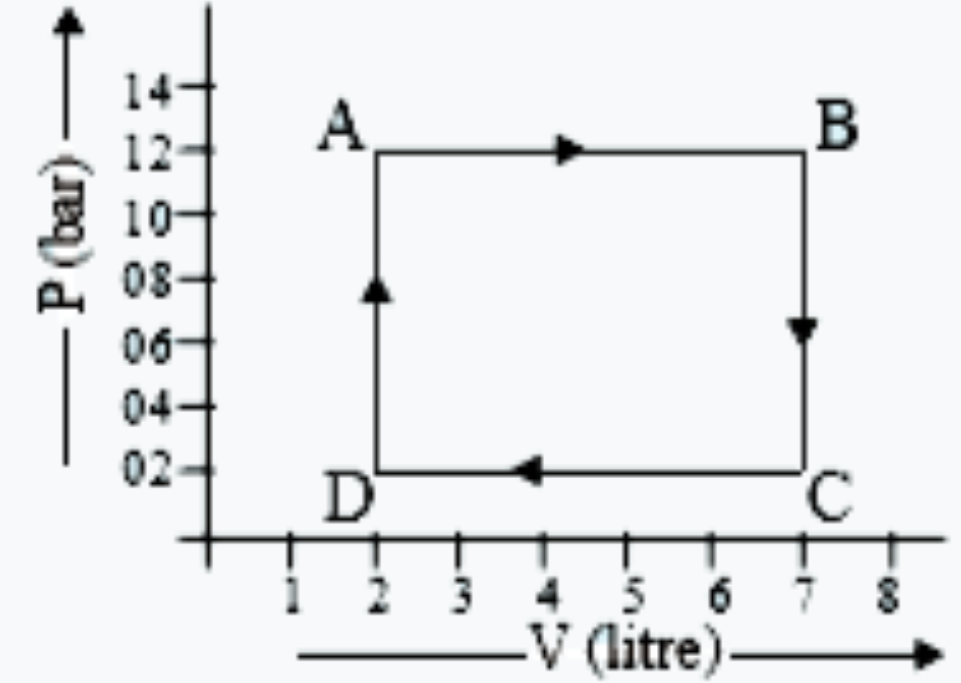
View SolutionThe diagram shows a PV graph of a thermodynamic behavious of an ideal gas. Find out from this graph (i) work done in the process A→B,B→C,C→DandD→A, (ii) work done in the complete cycle
A→B→C→D→A.
View Solution
Knowledge Check
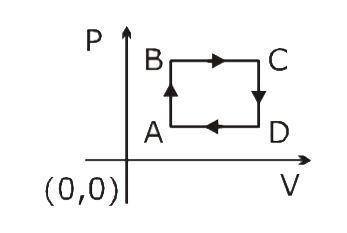
The figure shows P - V diagram of a thermodynamic cycle
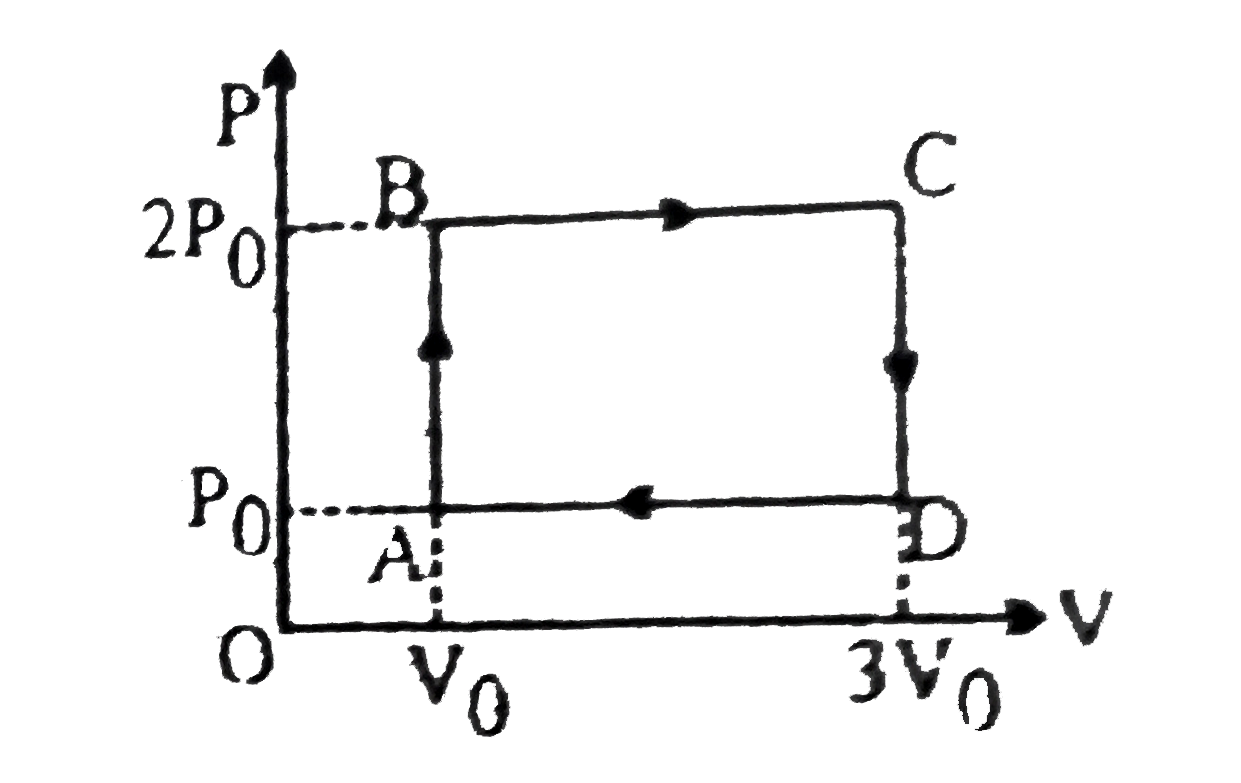
The work done in the cycle isA2P0V0B3P0V0CP0V0D6P0V0graph of an ideal gas is as shown in figure.
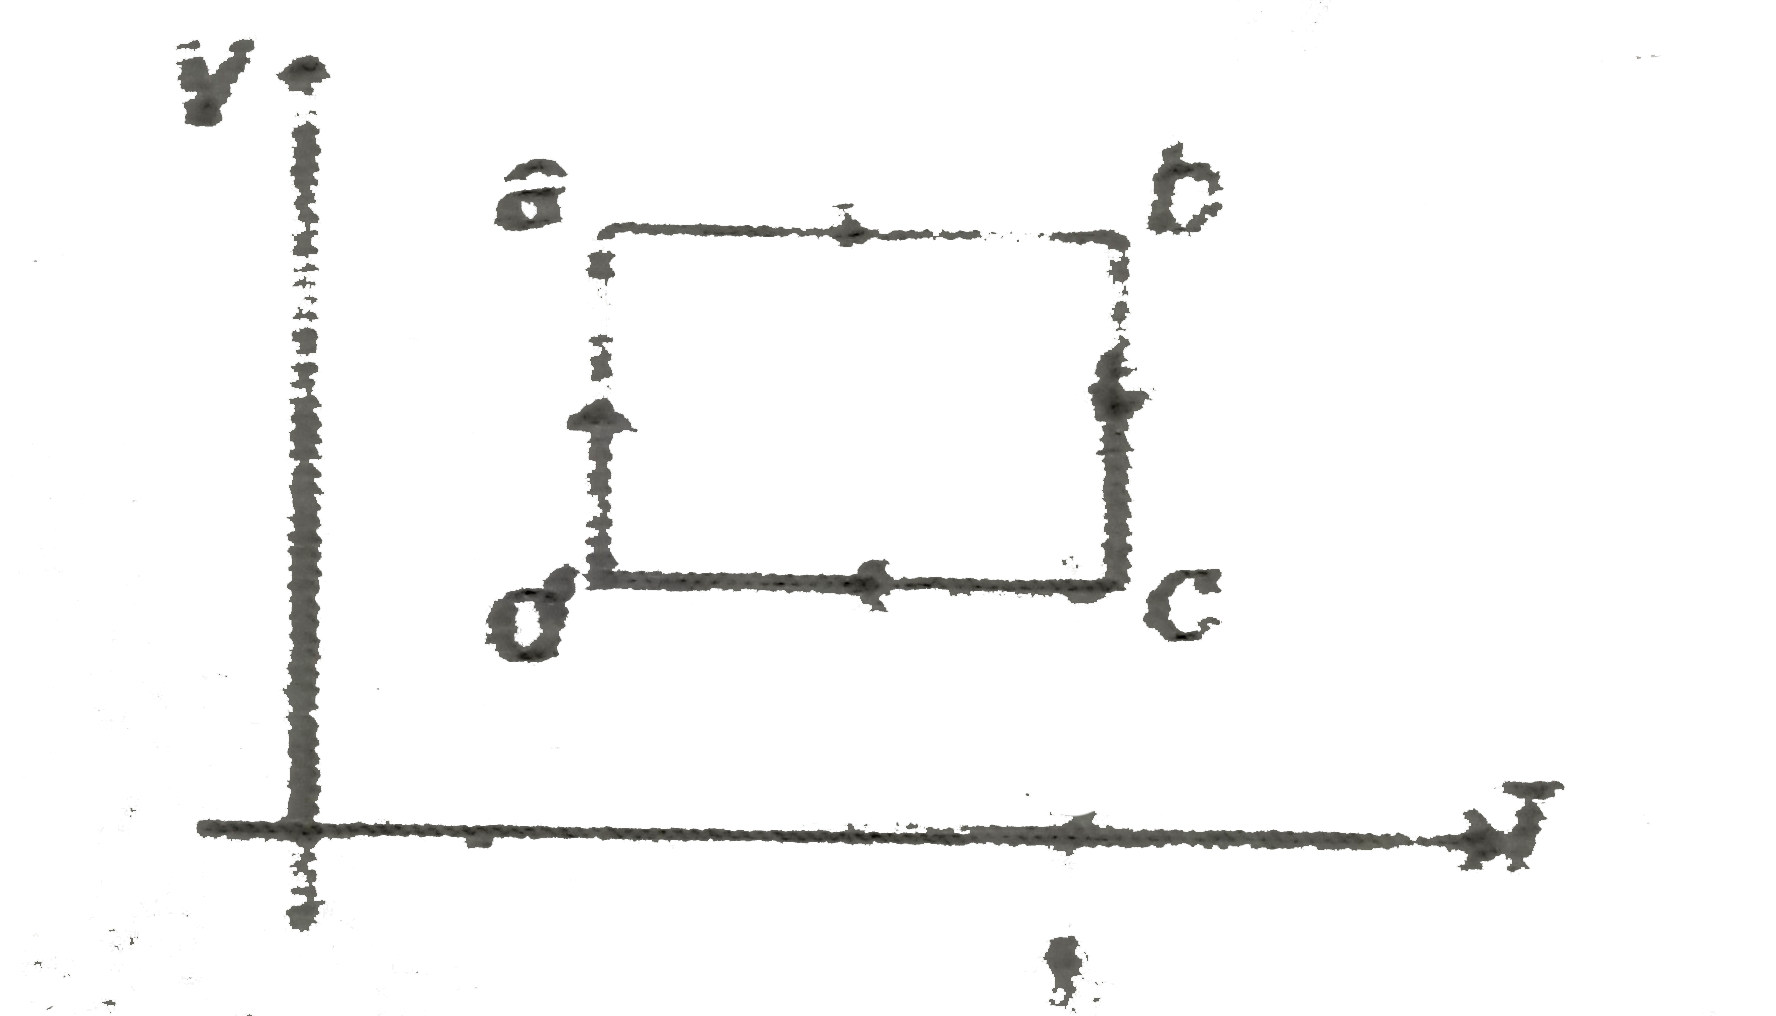
Work done by the gas in complete cyclic process about isAzeroBpositiveCnegativeDData is insufficientThe figure shows P - V diagram of a thermodynamic cycle
Choose the correct V - T diagram for the given cyclic process.A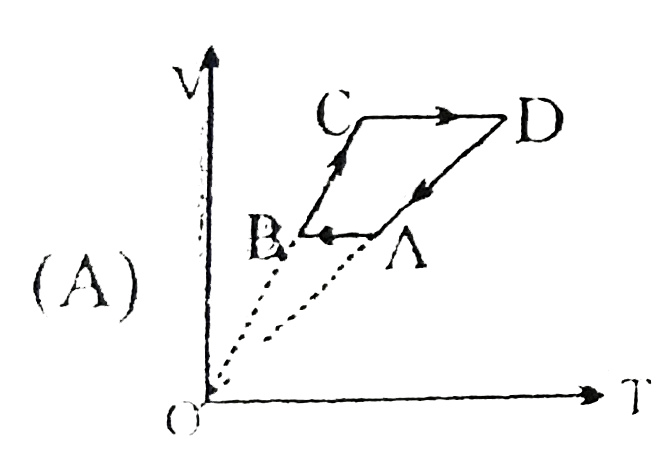 B
B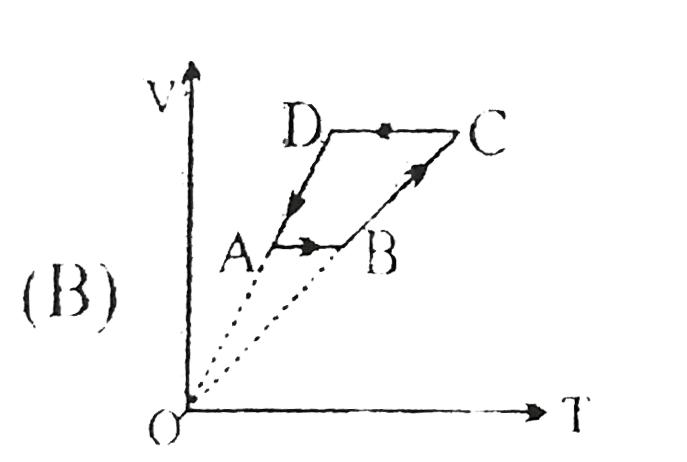 C
C Dnone of these
The figure shows P-V diagram of a thermodynamic cycle. Which corresponding curve is correct?
View Solution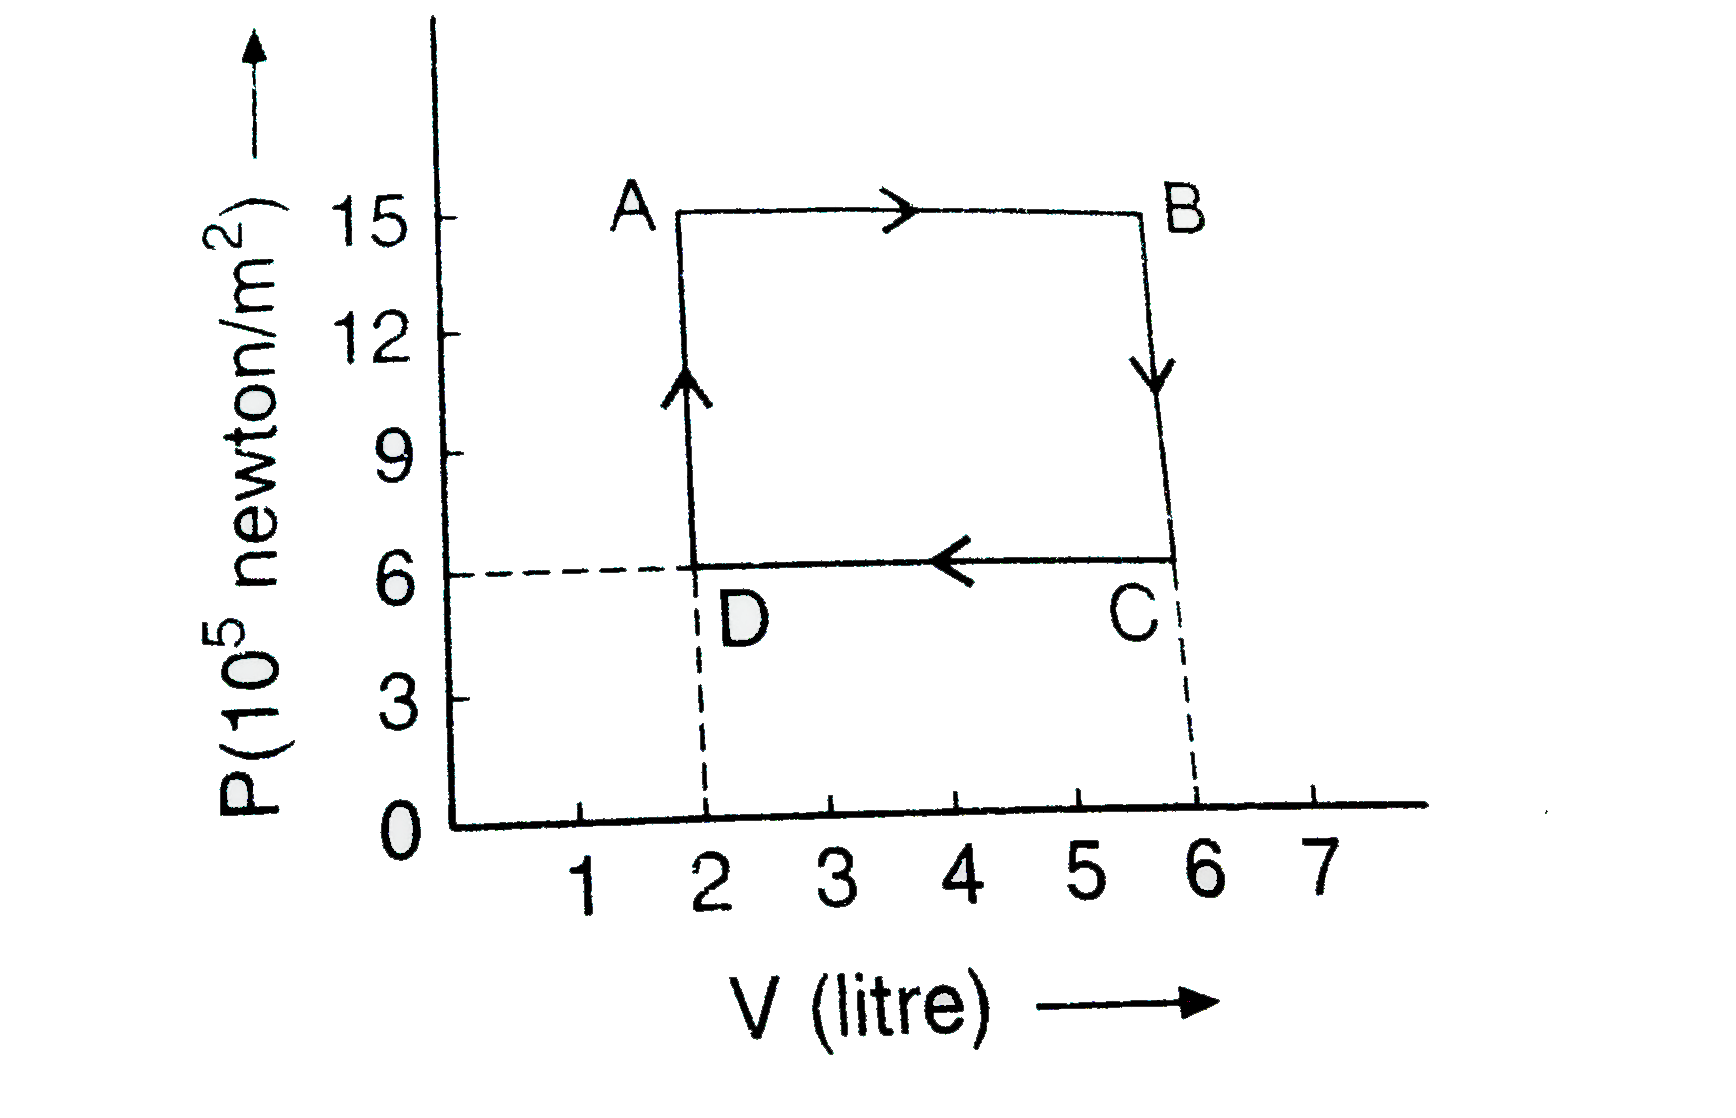
In the adjoining diagram, the p-V graph of an ideal gas is shown. Find out from the graph (i) work done in taking the gas
From the state A→B (ii) Work done in taking the gas from B→C (iii) Work done in a complete cycle. (1 litre=10−3m3)
View SolutionThe figure shows P - V diagram of a thermodynamic cycle
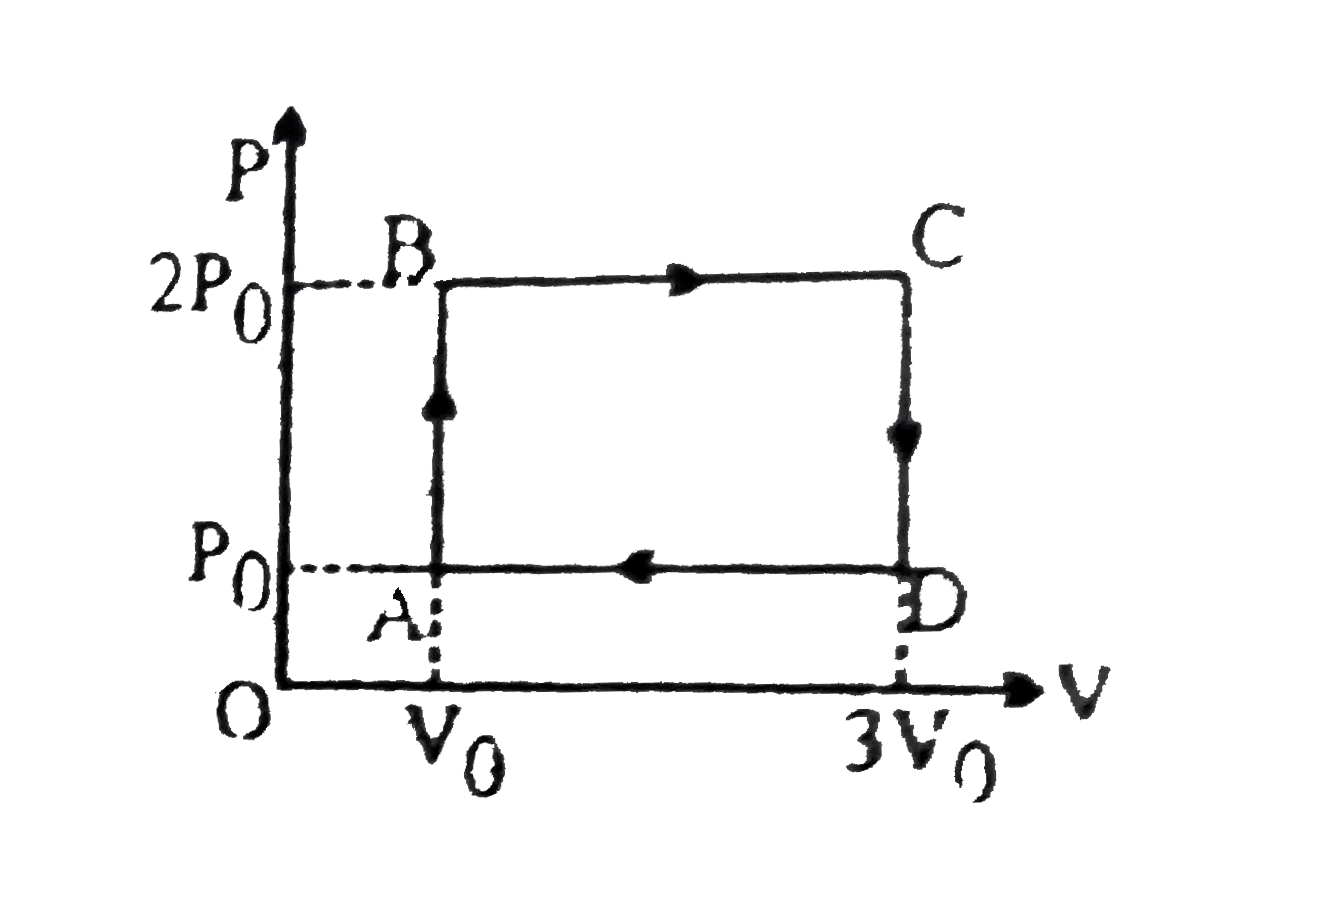
Choose the correct V - T diagram for the given cyclic process.
View SolutionP-V diagram of an ideal gas is as shown in figure. Work done by the gas in the process ABCD is
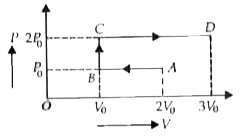
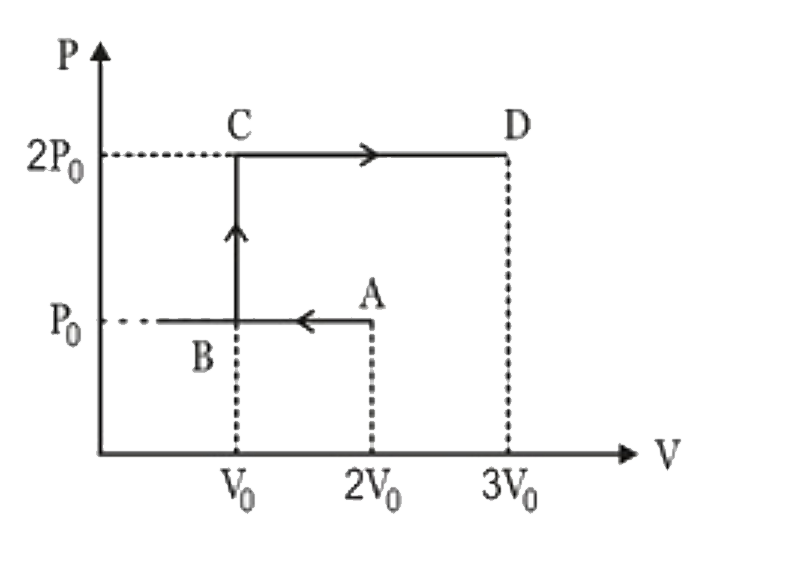
View SolutionP – V graph of an ideal gas is as shown in the diagram . Work done by the gas in the process ABCD is
View Solution
