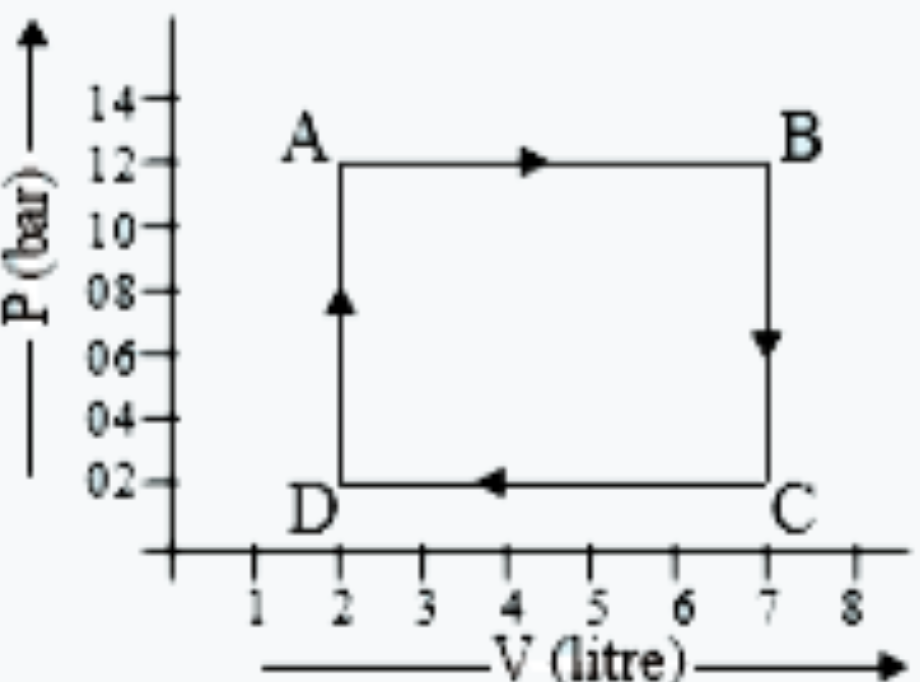
The diagram shows a PV graph of a thermodynamic behavious of an ideal gas. Find out from this graph (i) work done in the process A→B,B→C,C→DandD→A, (ii) work done in the complete cycle
A→B→C→D→A.
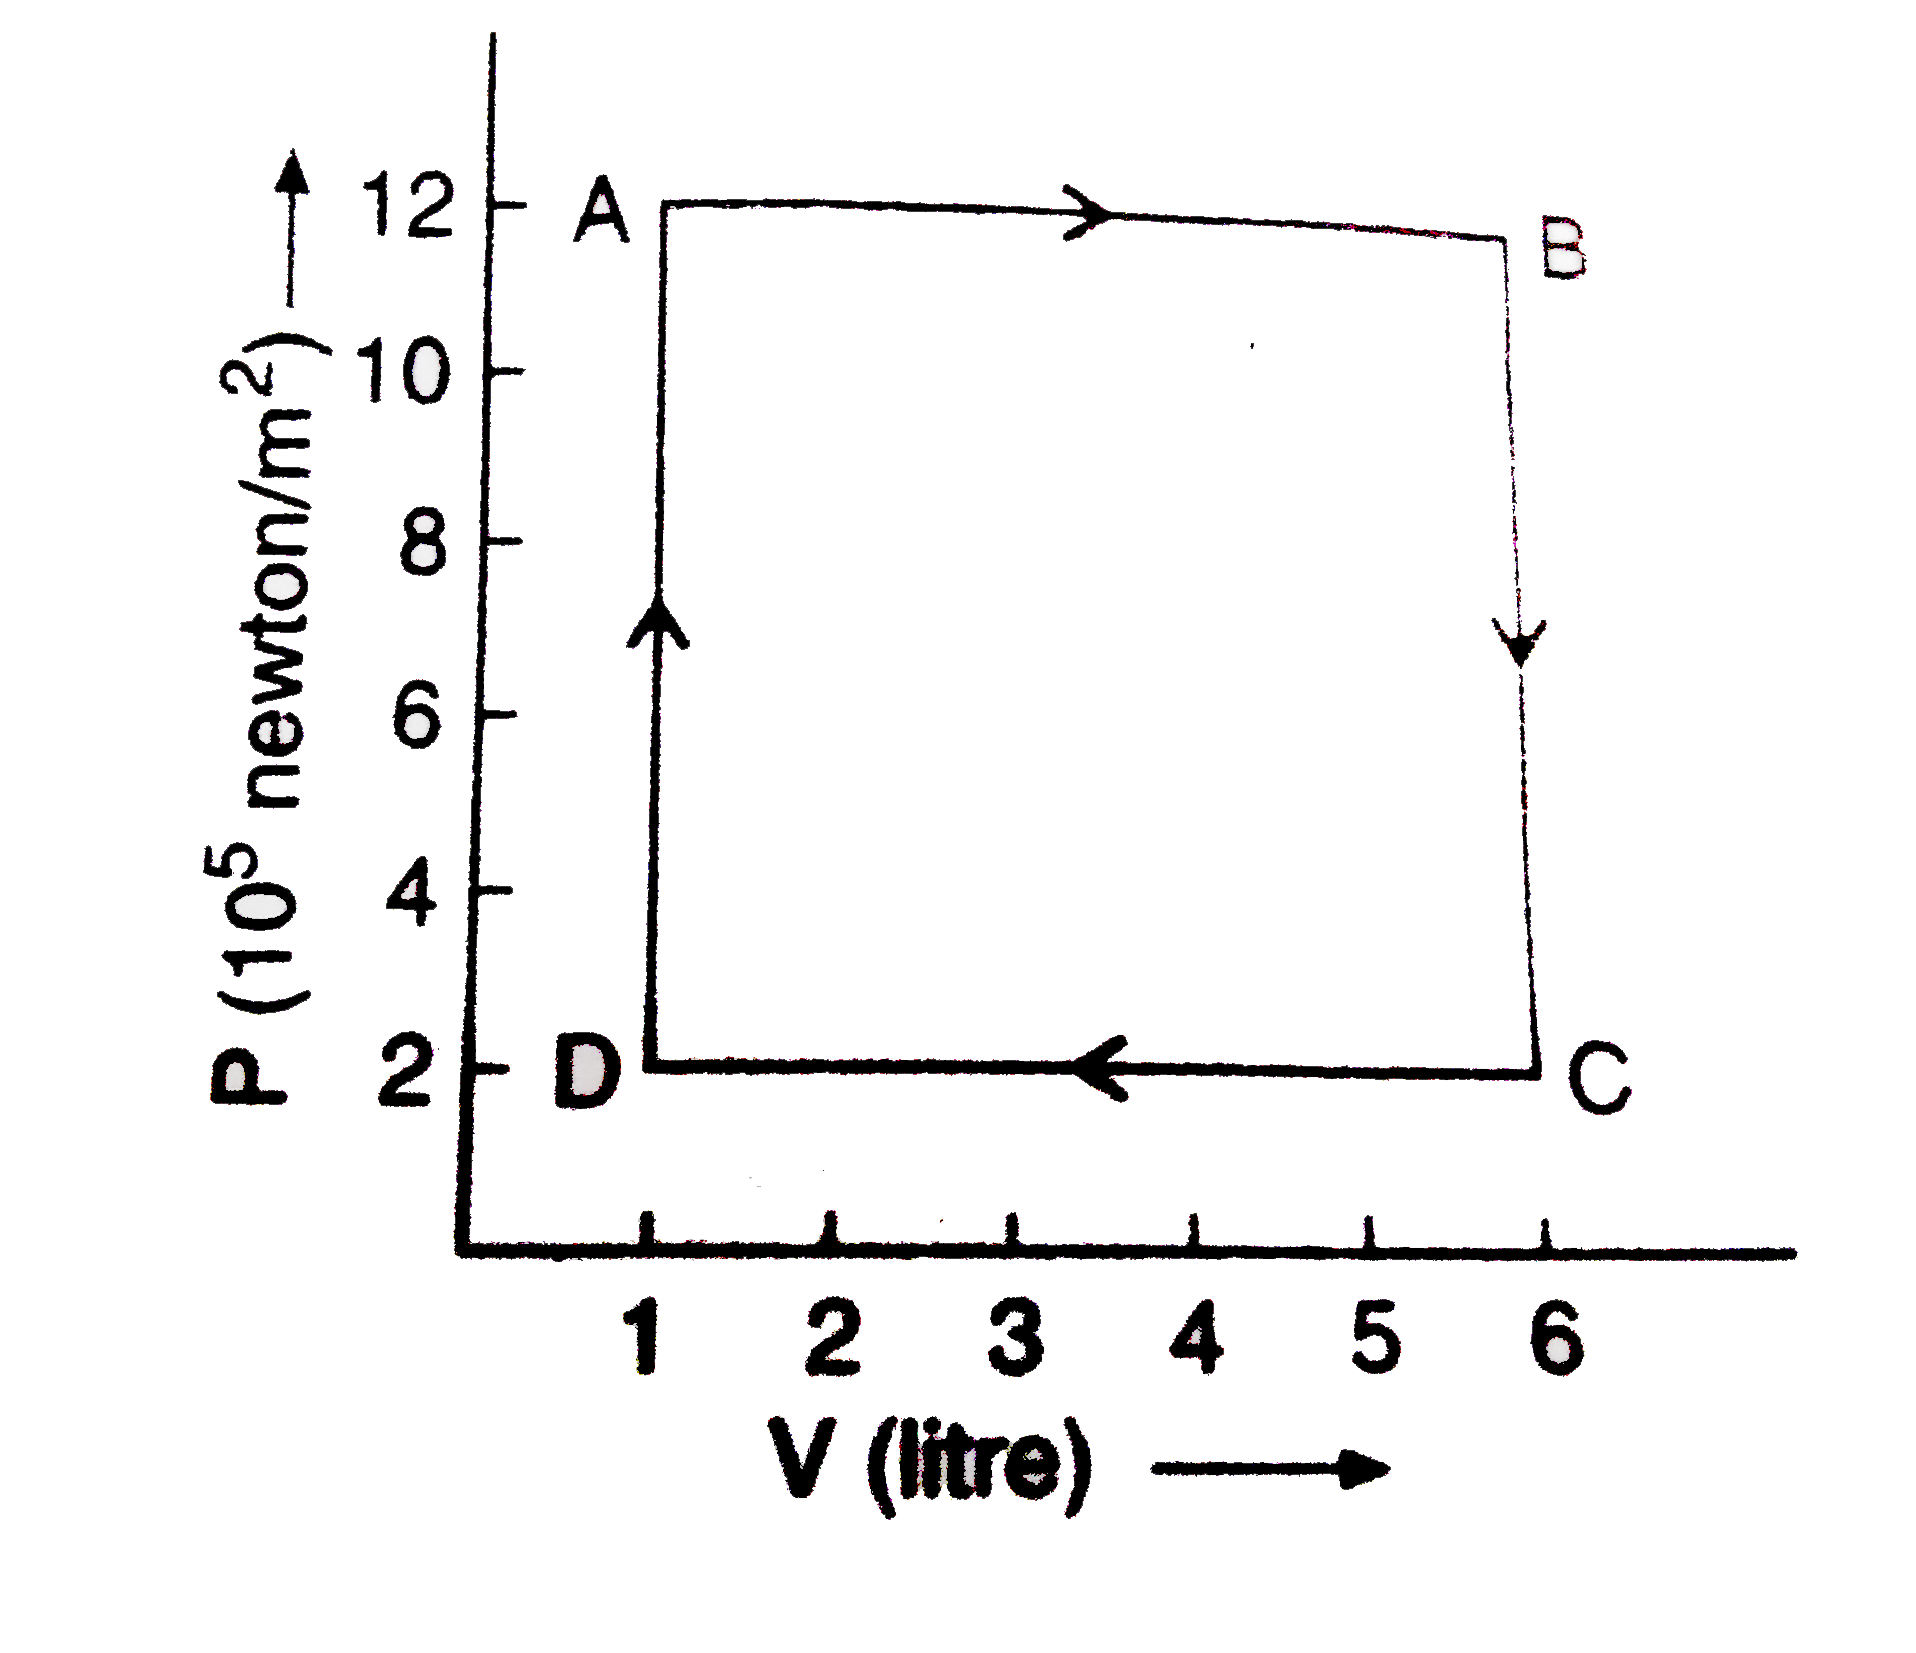
(i) Work done in the process A→B (the process is expansion, hence work is done by the gas)
=−P×dV=−12×105×5×10−3
=−6000J
Work done in the process B→C is zero as volume remains constant.
Work done in the process C→D (the process is concentration, hence work is done on the gas)
=P×dV=2×105×5×10−3
=P×dV=2×105×5×10−3
=1000J
(ii) Work done in the process D→A is zero as vlume remains constant.
Net ork done in the whole cycle =−6000+1000=−5000J
i.e., net work is done by the gas.
Topper's Solved these Questions
- Chemical Thermodynamics and ThermochemistryBOOK - OP TANDONCHAPTER - Chemical Thermodynamics and ThermochemistryEXERCISE - Solved Example
74 Videos
- Chemical Thermodynamics and ThermochemistryBOOK - OP TANDONCHAPTER - Chemical Thermodynamics and ThermochemistryEXERCISE - Illustrations of Objective Questions
58 Videos
- CHEMICAL KINETICSBOOK - OP TANDONCHAPTER - CHEMICAL KINETICSEXERCISE - LINKED COMPRESHENSION TYPE QUESTIONS ( SECTION-VI)
4 Videos
- CLASSIFICATION AND NOMENCLATURE OF ORGANIC COMPOUNDS BOOK - OP TANDONCHAPTER - CLASSIFICATION AND NOMENCLATURE OF ORGANIC COMPOUNDS EXERCISE - INTEGER
2 Videos
Similar Questions
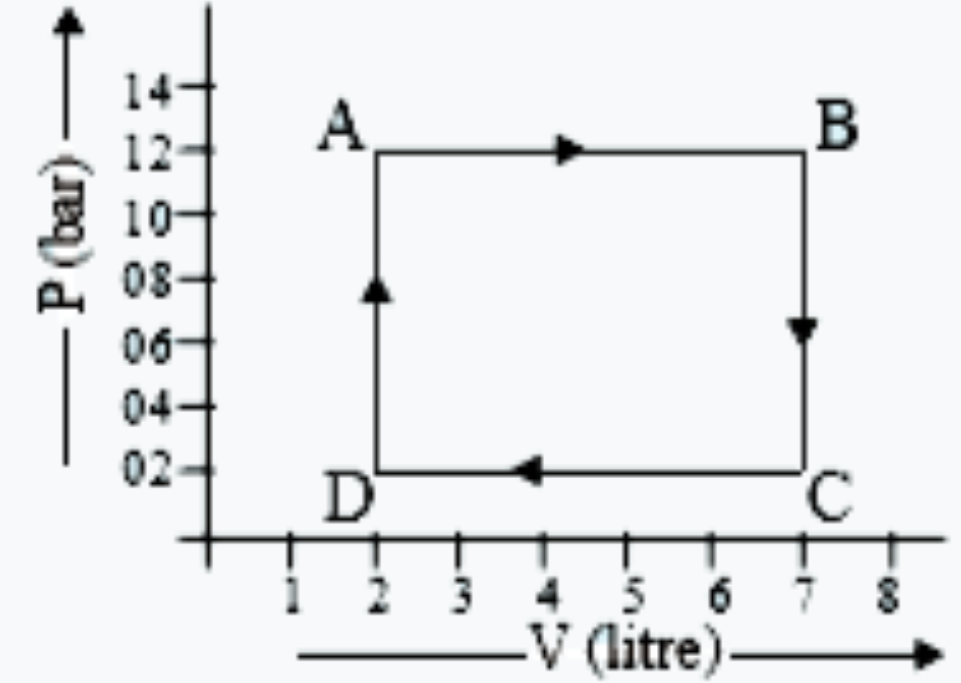
The diagram shows a P - V graph of a thermodynamic behaviour of an ideal gas. Find out from this graph.
Work done in process A→B,B→C,C→D and D→A.
View SolutionThe diagram shows a P - V graph of a thermodynamic behaviour of an ideal gas. Find out from this graph.
Work done in process A→B,B→C,C→D and D→A.

View Solution
Knowledge Check
The figure shows P - V diagram of a thermodynamic cycle
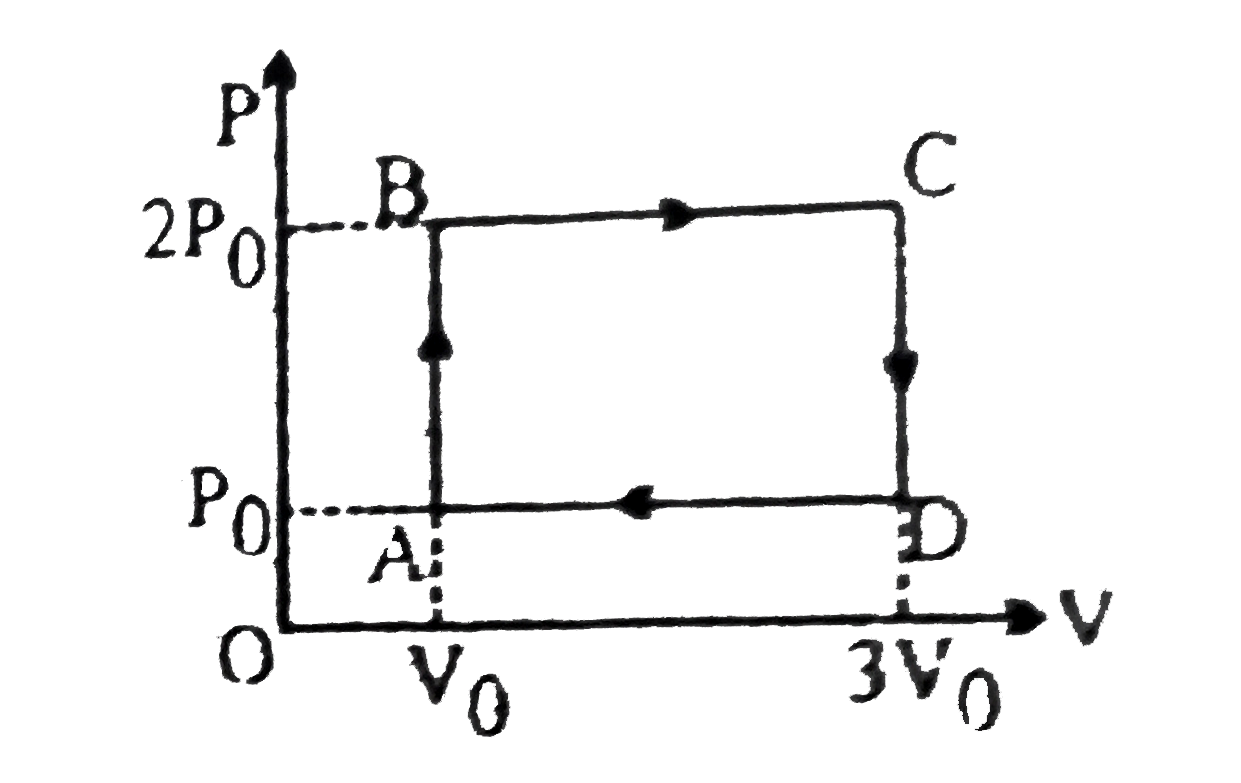
The work done in the cycle isA2P0V0B3P0V0CP0V0D6P0V0P – V graph of an ideal gas is as shown in the diagram . Work done by the gas in the process ABCD is
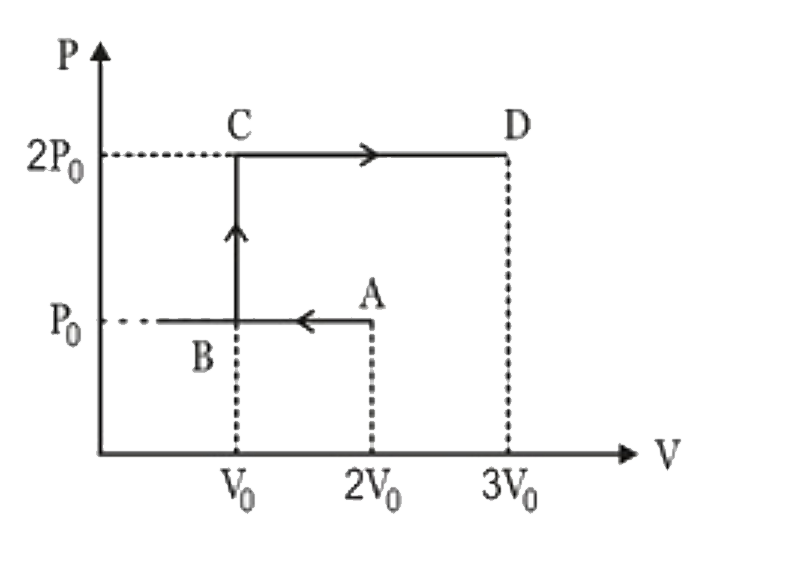 A4P0V0B2P0V0C3P0V0DP0V0
The diagram shows a P - V graph of a thermodynamic behaviour of an ideal gas. Find out from this graph.
Work done in complete cycle A→B→C→D→A.
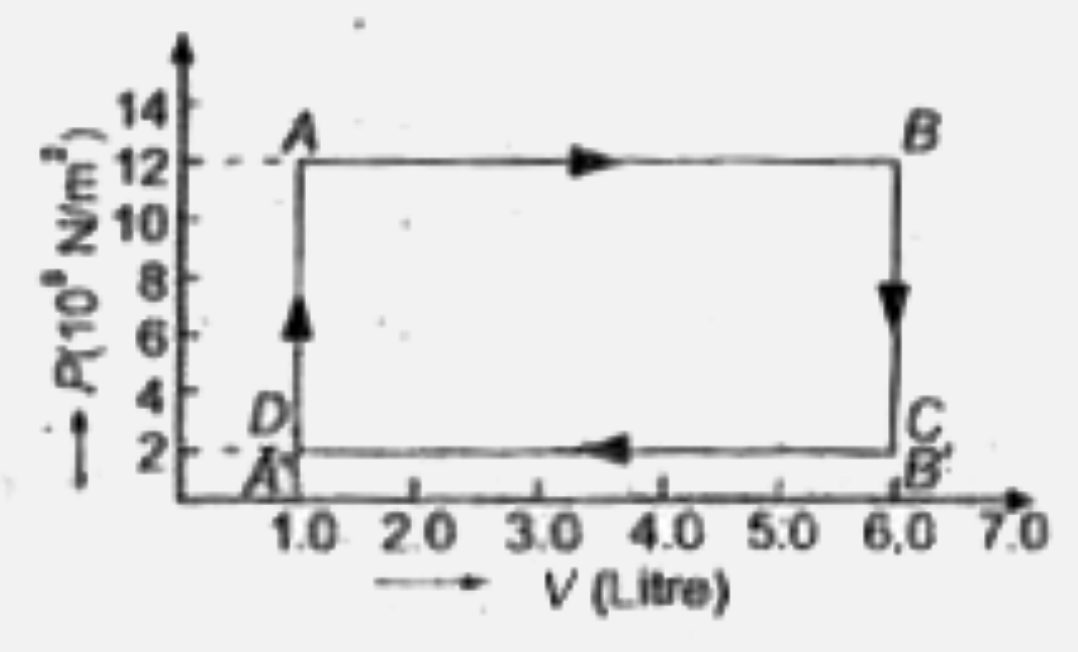
View SolutionThe figure shows a P.V graph of the thermodynamic behavious of an ideal gas. Find out form this graph (i) work done by the gas in the process A→B,B→C,C→DandD→A. (ii) work done by the gas in complete cycle A→B→C→D→A.
View Solution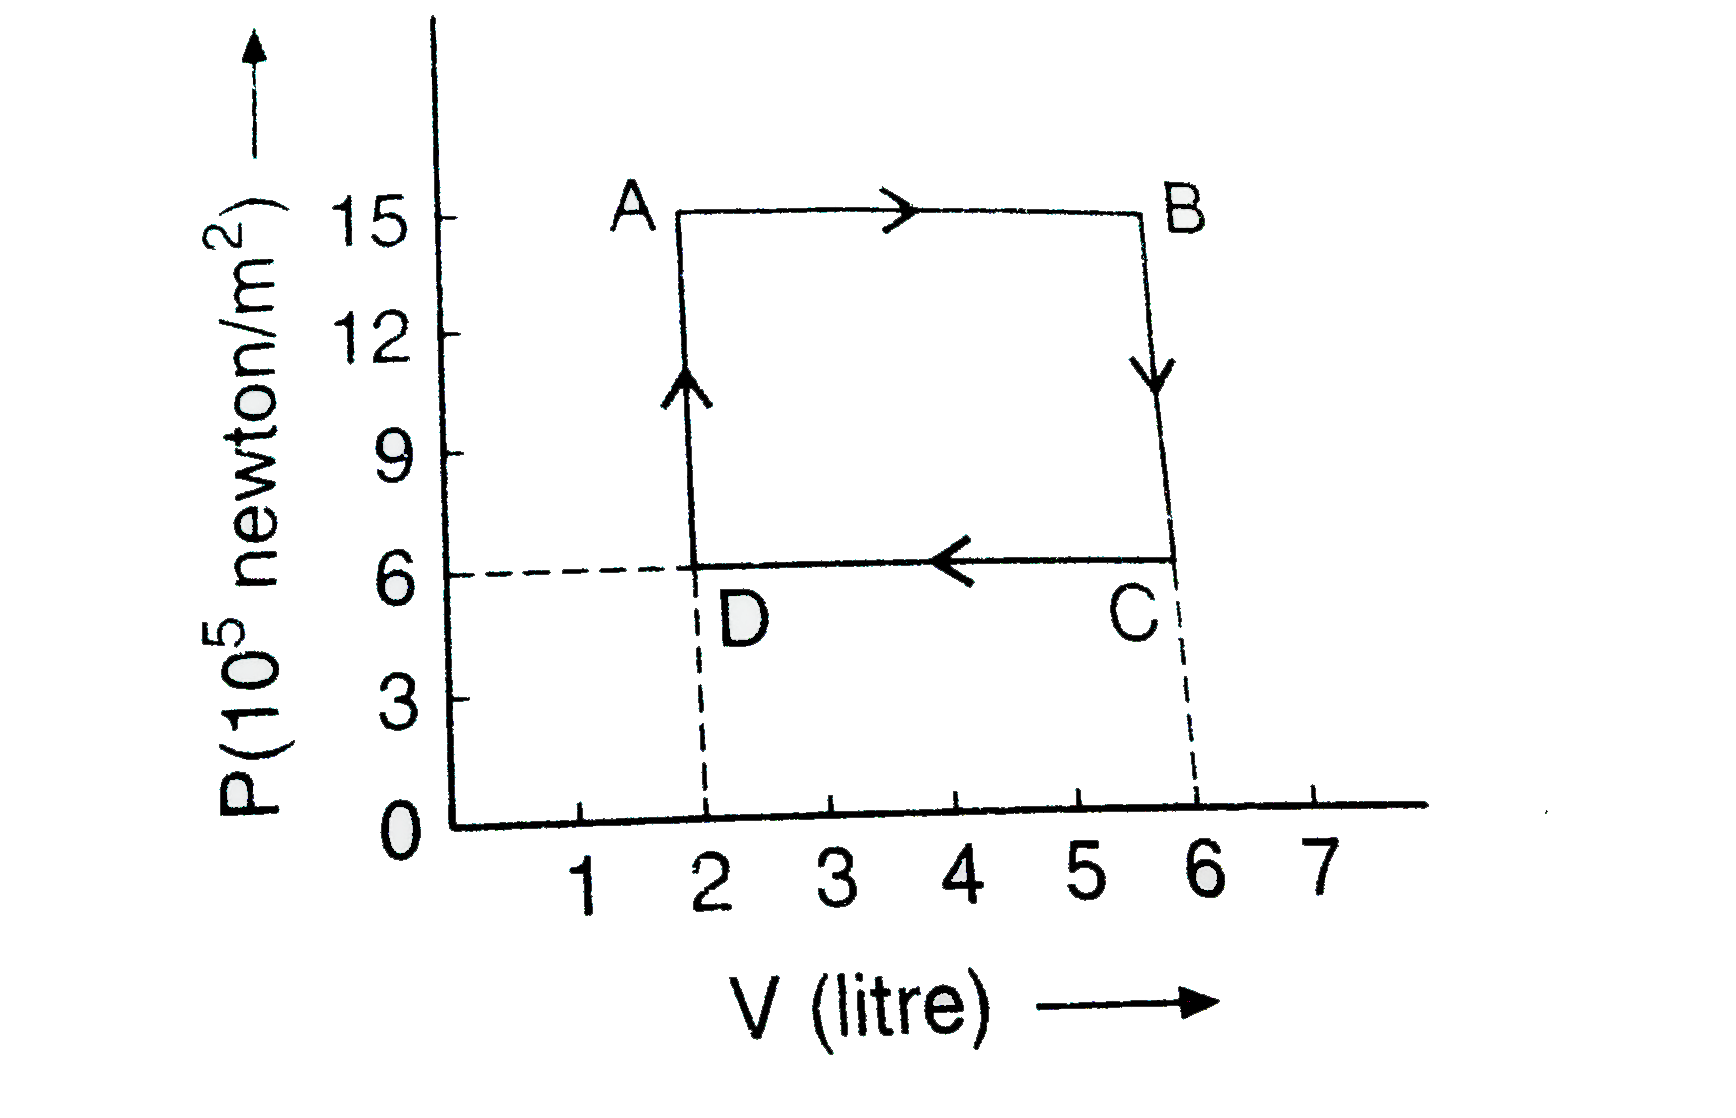
In the adjoining diagram, the p-V graph of an ideal gas is shown. Find out from the graph (i) work done in taking the gas
From the state A→B (ii) Work done in taking the gas from B→C (iii) Work done in a complete cycle. (1 litre=10−3m3)
View SolutionP – V graph of an ideal gas is as shown in the diagram . Work done by the gas in the process ABCD is

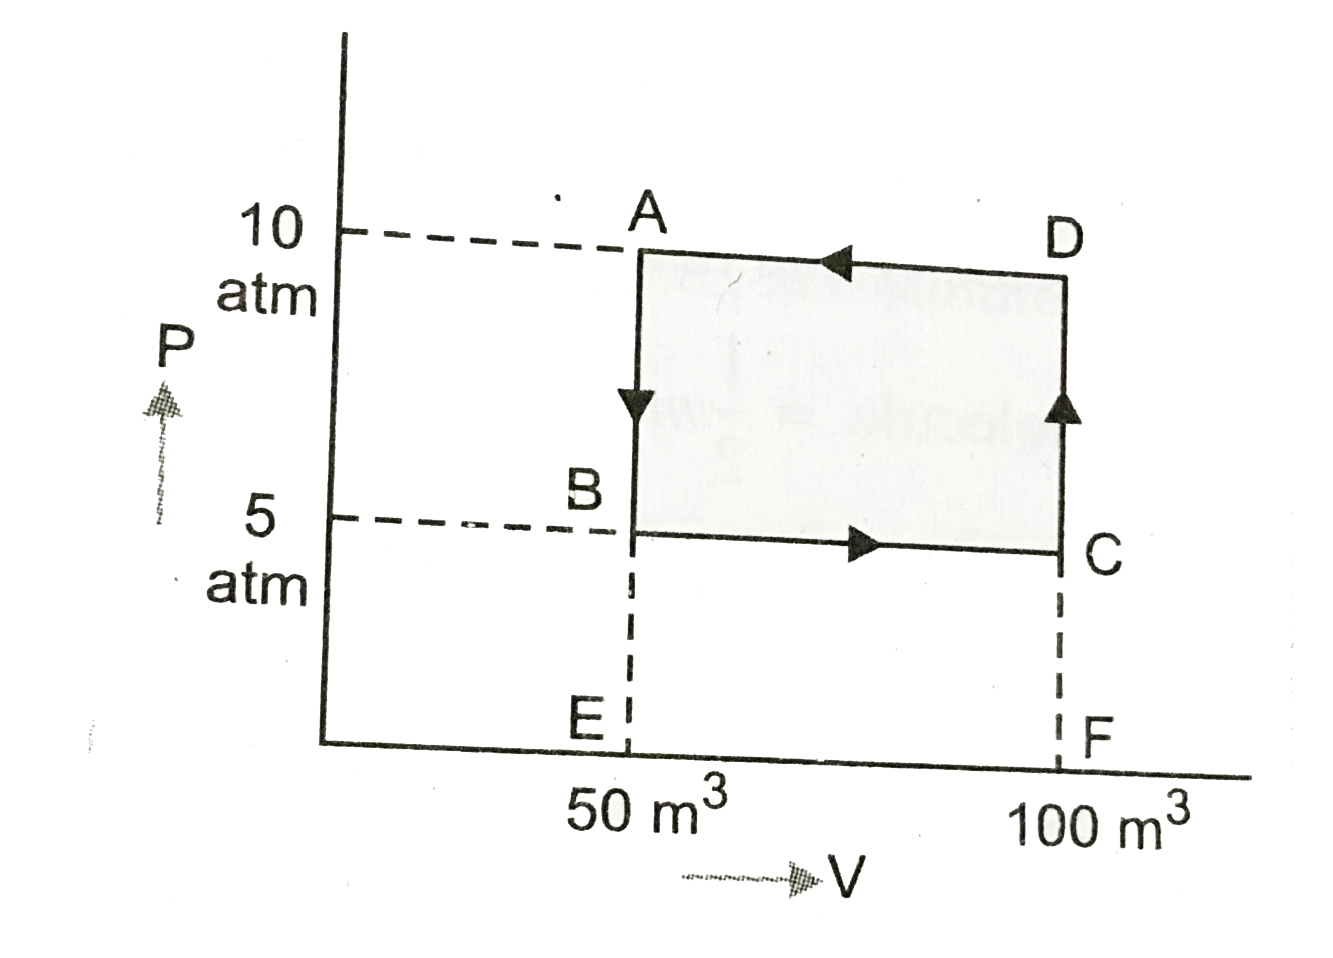
View SolutionOne mole of an ideal gas is taken through the cyclic process ABCDA, as shown in (figure). Using the graph, calculate
(i) Work done in the processes A→B,B→C,C→DandD→A
(ii) Work done in complete cycle ABCDA
(iii) Heat rejected by the gas in one complete cycle.
View SolutionV-T graph of a process of monoatomic ideal gas is shown in figure.
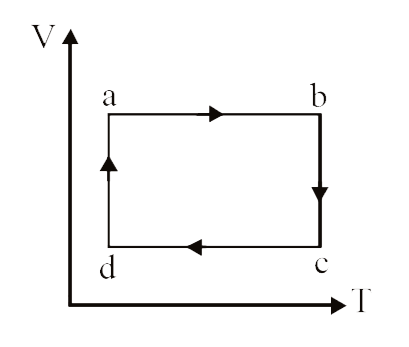
Sum of work done by the gas in process abod is-
View Solution
