The diagram shows a P - V graph of a thermodynamic behaviour of an ideal gas. Find out from this graph.
Work done in process A→B,B→C,C→D and D→A.
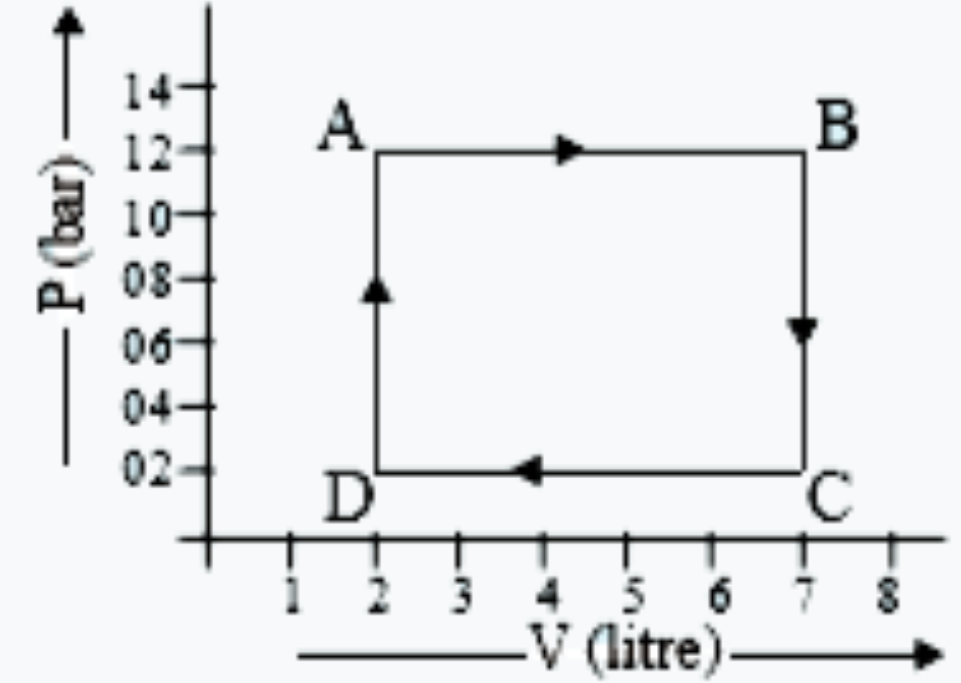
Process A→B.
The process is expansion, hence work is done by the gas.
Here, P = 12 bar =12×105Nm2 or (Pa)
ΔV=7−2=5 litre =5×10⁻³m3
∴W=−PΔV=−12×105×5×10−3=−6000J
negative sign shows that work is done by gas.
Process B→C.
Here, ΔV=0 therefore W = 0.
Process C→D
The process is contraction, hence work is done on system.
Here, P = 2 bar =2×10⁵Nm−2,
ΔV=2−7=−5 litre =−5×10⁻³m3.
∴W=−PΔV=−2×10⁵×−5×10−3=+1000J.
positive sign shows that work is done on gas.
Process D→A.
Here, ΔV=0, therefore, W = 0.
Similar Questions
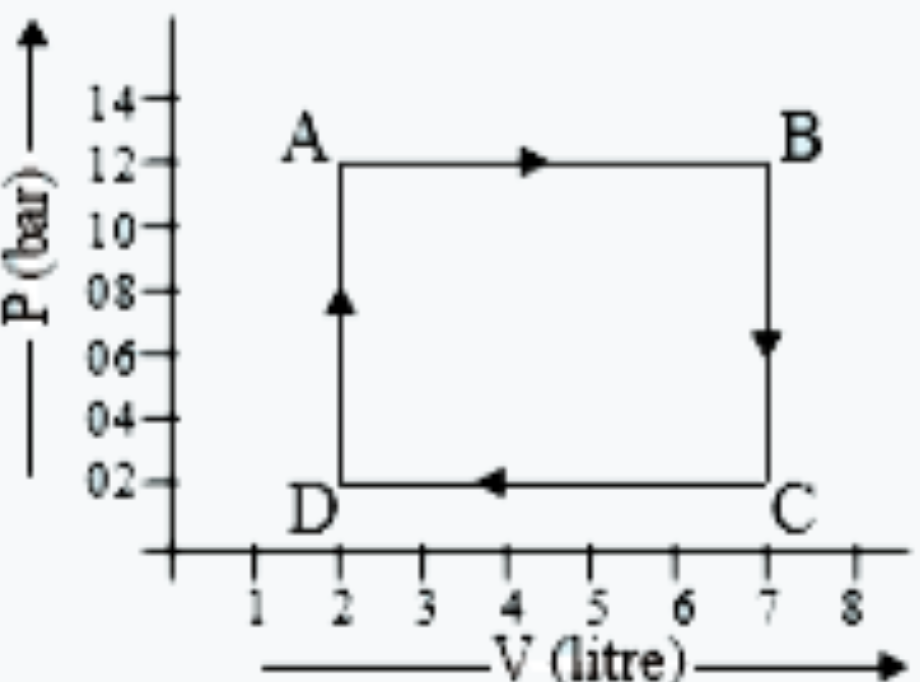
The diagram shows a P - V graph of a thermodynamic behaviour of an ideal gas. Find out from this graph.
Work done in complete cycle A→B→C→D→A.
View SolutionThe diagram shows a PV graph of a thermodynamic behavious of an ideal gas. Find out from this graph (i) work done in the process A→B,B→C,C→DandD→A, (ii) work done in the complete cycle
A→B→C→D→A.
View Solution
Knowledge Check
The figure shows P - V diagram of a thermodynamic cycle
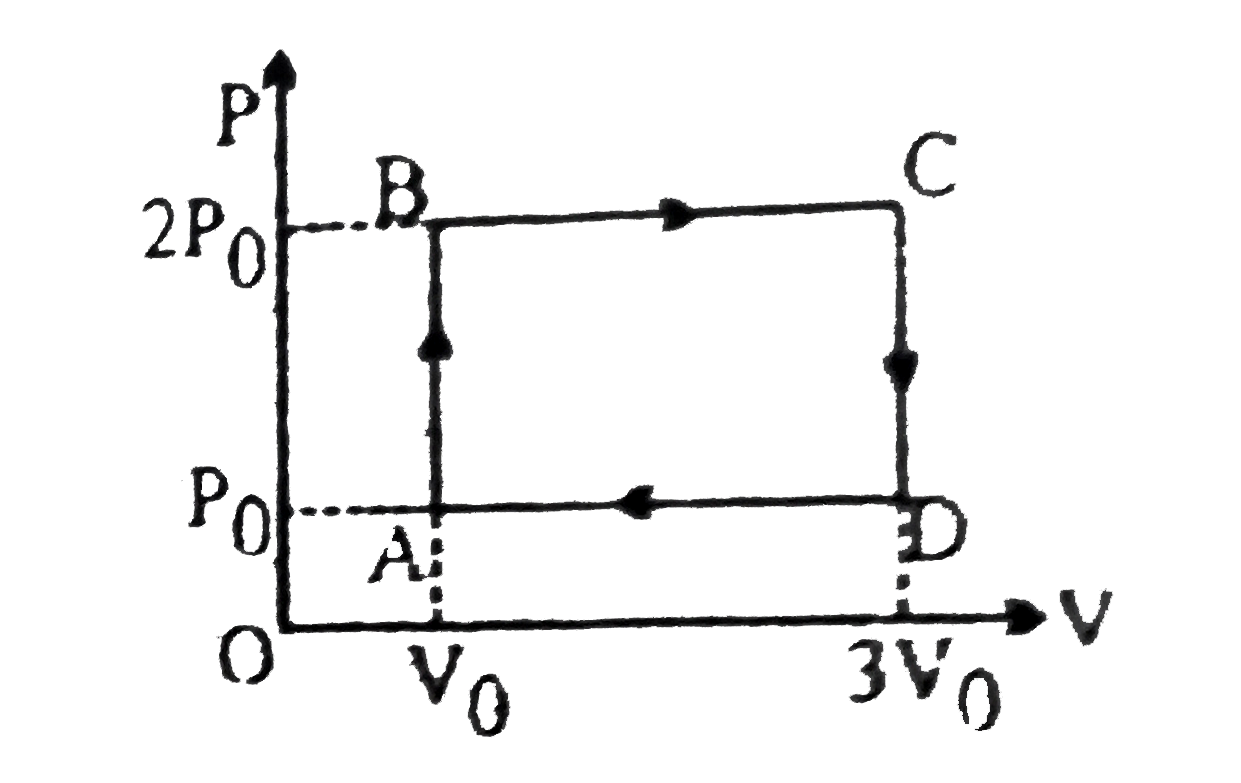
The work done in the cycle isA2P0V0B3P0V0CP0V0D6P0V0P−V diagram of an ideal gas is as shown in figure. Work done by the gas in process ABCD is
 A4P0V0B2P0V0C3P0V0DP0V0
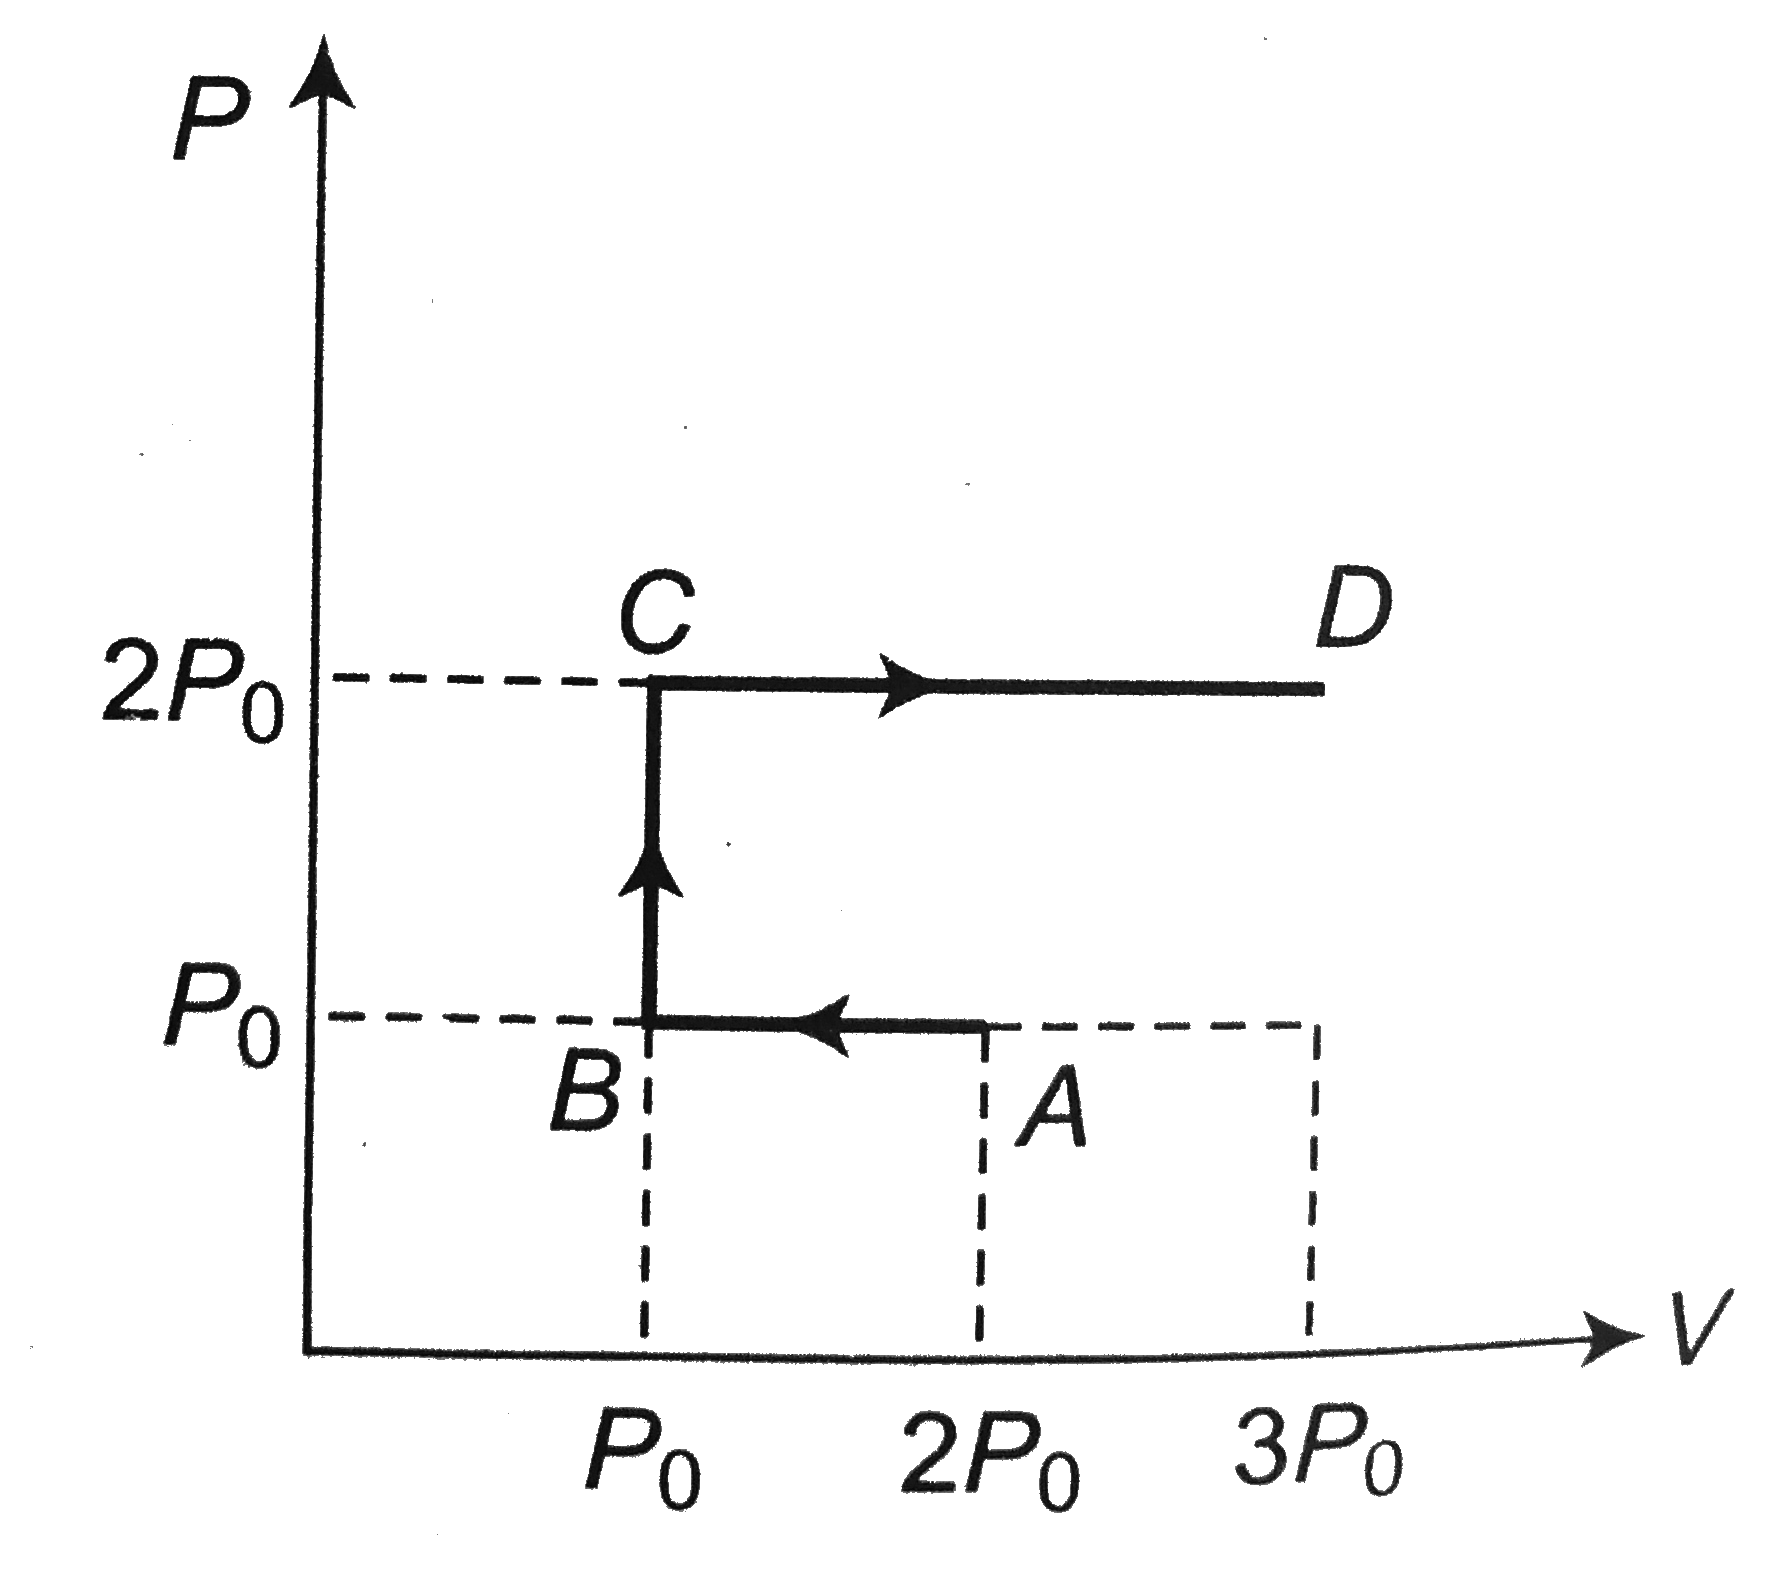
P-V diagram of an ideal gas is as shown in figure. Work done by the gas in the process ABCD is
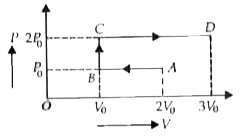 A4P0V0B2P0V0C3P0V0DP0V0
V-T graph of a process of monoatomic ideal gas is shown in figure.
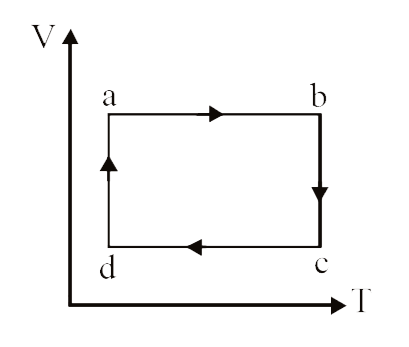
Sum of work done by the gas in process abod is-
View Solution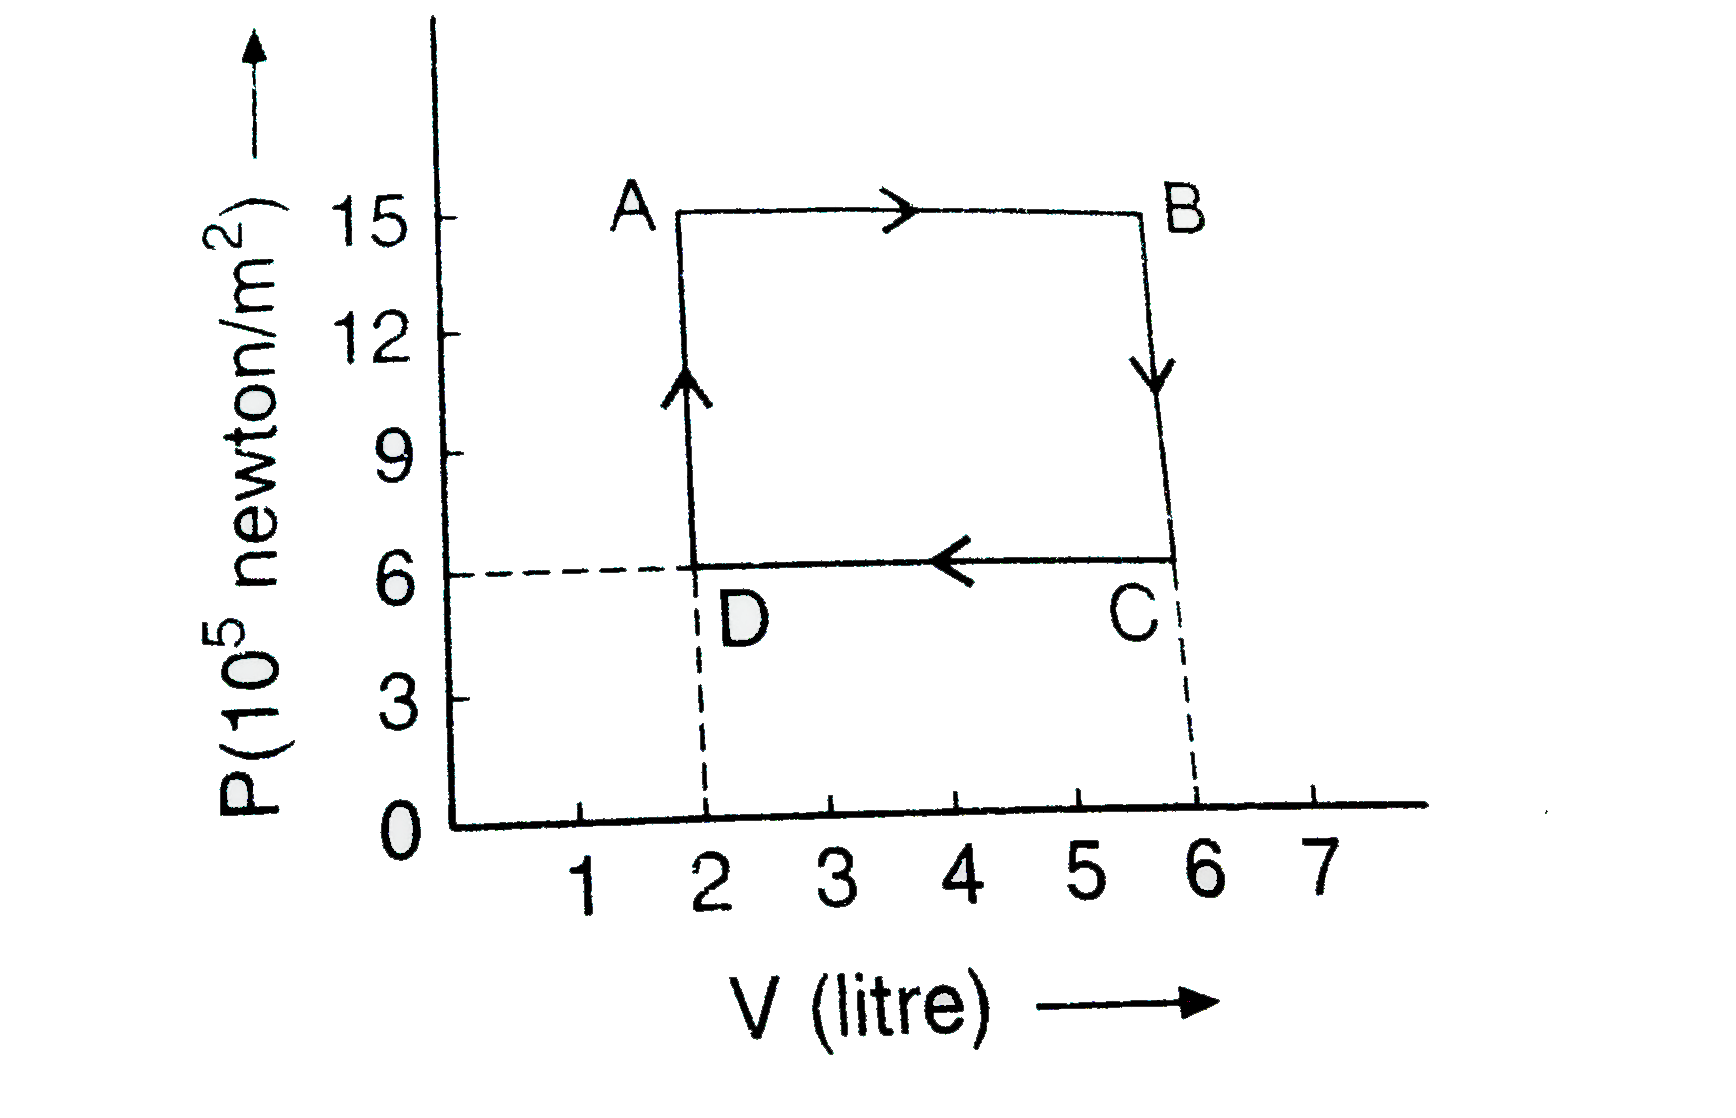
In the adjoining diagram, the p-V graph of an ideal gas is shown. Find out from the graph (i) work done in taking the gas
From the state A→B (ii) Work done in taking the gas from B→C (iii) Work done in a complete cycle. (1 litre=10−3m3)
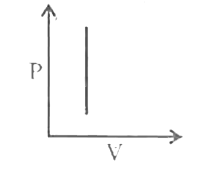
View SolutionThe graph of a thermodynamic process is a straight line parallel to pressure axis in P - V diagram. What is the work done in that process ?
View SolutionP – V graph of an ideal gas is as shown in the diagram . Work done by the gas in the process ABCD is
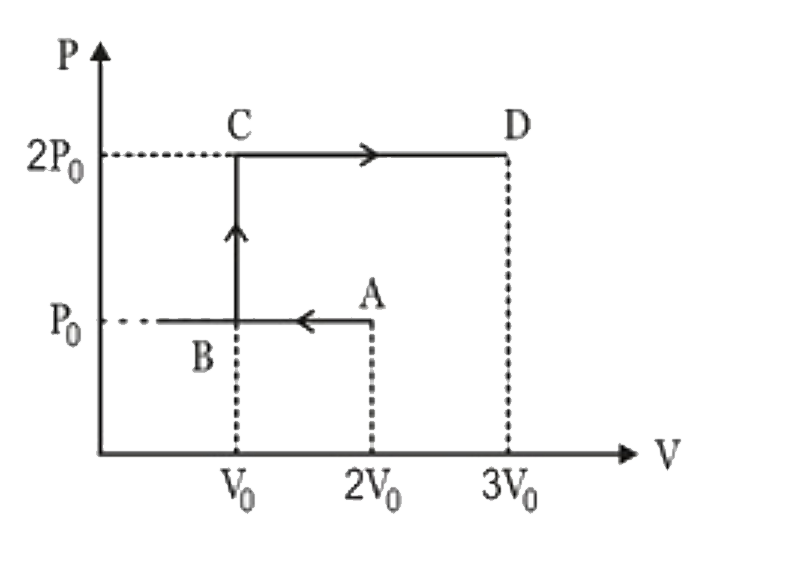
View SolutionP−V diagram of an ideal gas is as shown in figure. Work done by the gas in process ABCD is

View Solution
