Consider a radioactive nucleus A which decays to a stable nucleus C through the following sequence
A→B→C
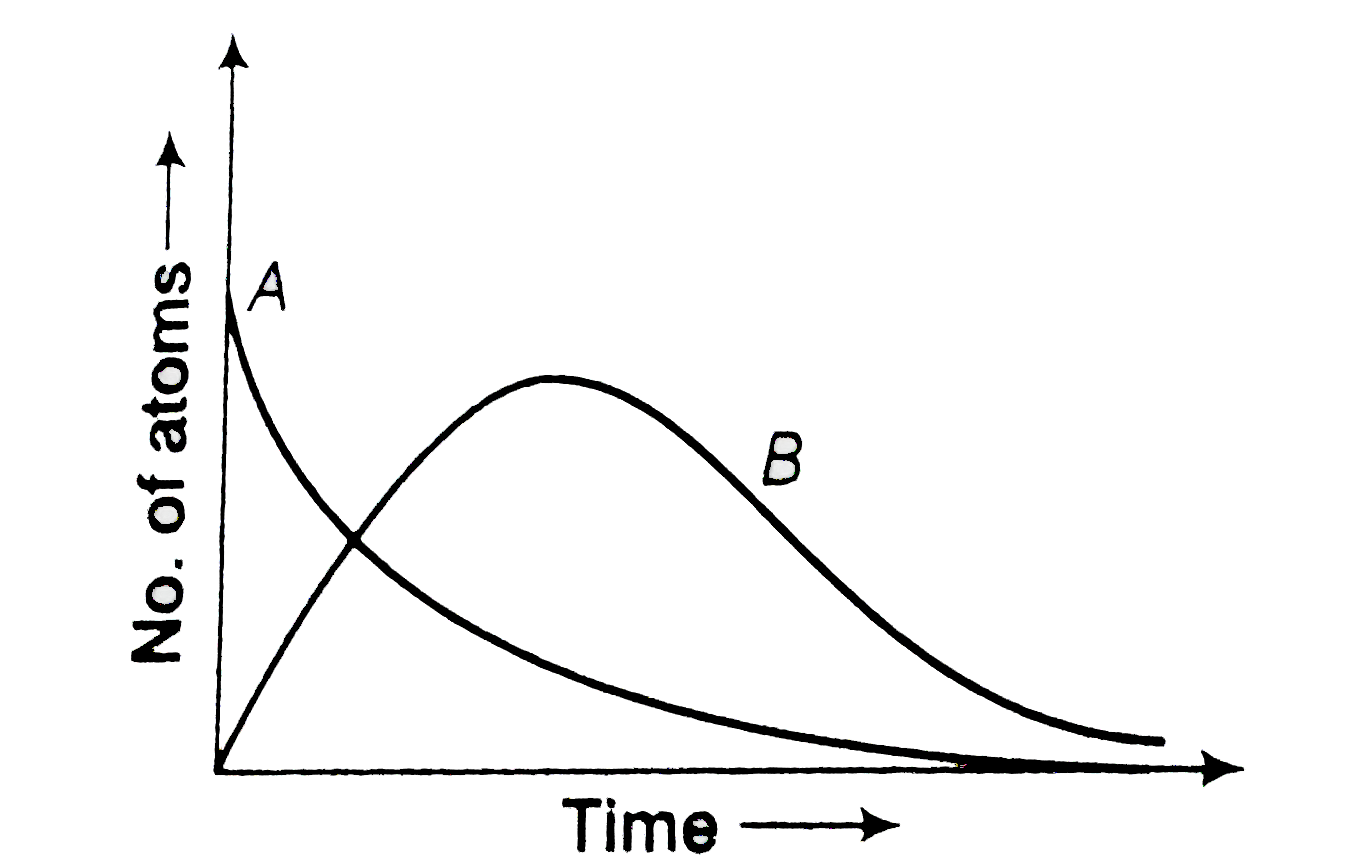
Here B is an intermediate nuclei which is also radioactive. Considering that there are N0 atoms of A initially , plot the praph showing the variation of number of atoms of A and B versus time.
Consider the situation shown in the graph.

At t=0,NA=N0 (maximum) while NB=0. As time increases NA decreases exponentially and the number of atoms of B increases. They becomes (NB) maximum and finally drop to zero exponenetially by radioactive decay law.
Topper's Solved these Questions
Similar Questions
Consider a radioactive nucleus A which decays to a stable nucleus C through the following sequence
A→B→C
Here B is an intermediate nuclei which is also radioactive. Considering that there are N0 atoms of A initially , plot the praph showing the variation of number of atoms of A and B versus time.
View SolutionA radioactive nucleus X undergoes spontaneous decay in the sequence
z X to z-1 B to z-3 C to z-2 D, where Z is the atomic number of element Z. The possible decay particles in the sequence are:
View Solution
Knowledge Check
Which type of radioactive decay produces a daughter nucleus with a higher atomic number?
AαBβ−CγDβ+A radioactive nucleus A with a half life T, decays into a nucleus B. At t = 0, there is no nucleus B. At sometime t, the ratio of the number of B to that of A is 0.3. Then, t is given by :
At=Tlog(1.3)Bt=(T2)log2log1.3Ct=Tlog1.3log2Dt=Tlog(1.3)A radioactive nucleus A with a half life T, decays into a nucleus B. At t = 0, there is no nucleus B. At sometime t, the ratio of the number of B to that of A is 0.3. Then, t is given by :
At = T log (1.3)Bt=Tlog(1.3)Ct=T2log2log1.3Dt=Tlog1.3log2
A sample of a radioactive nucleus A disintegrates to another radioactive nucleus B, which in turn disintegrates to some other stable nucleus C. Plot of a graph showing the variation of number of atoms of nucleus B vesus time is : (Assume that at t = 0, there are no B atoms in the sample)
View SolutionA radioactive isotope X decays into a stable nucleus Y. Draw graphs showing the variation of rate of formation of Y versus time and the variation of population of Y versus time. Initial population of Y is zero.
View SolutionConsider a hypothetical case of a radinuclide A which produces a daughter B which is turn decays to a stable product C. the half life of B is 5 times that of A. take initial population of both B and C to be zero.
(a) Using qualitative arguments only, plot the variation of population of A,B and C with time.
(b) Find the ratio of population of B to that of A at the instant the population of B becomes maximum.
(c) Describe qualitatively how the slope of the graph of population oc C changes with time.
View SolutionA number N0 of atoms of a radio active element are placed inside a closed volume. The radioactive decay constant for the nucleus of this element is λ1. The daughter nucleus that form as a result of the decay process are assumed to be radioactive too with a radioactive decay constant λ2. Determine the time variation of the number of such nucleus. Consider two limiting cases λ1>>λ2 and λ1<<λ2.
View SolutionA radioactive nucleus A with a half life T, decays into nucleus B. At t=0, there is no nucleus B. At somewhat t, the ratio of the number of B to that of A is 0.3 . Then, t is given by
View Solution