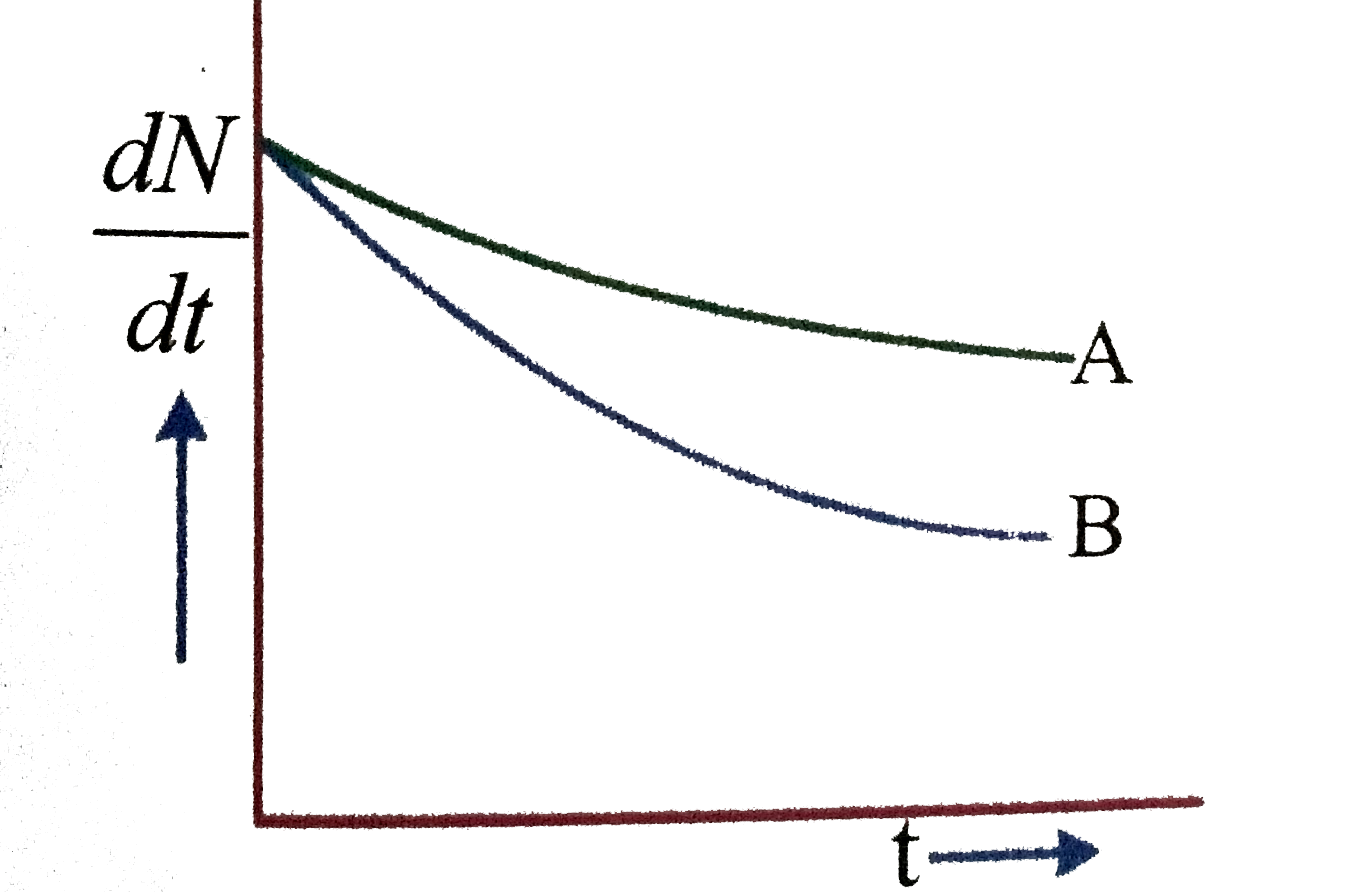
Which sample A or B shown in figure has shorter mean-life ?
Video Solution
Text Solution
from the given figure we can say that
at t=0.(dNdt)A−(dNdt)B
⇒ (N0)A=(N0)B
Considering any instant t by drawing a line perpendicular to time axis we find that
(dNdt)A>(dNdt)B ,ltBrgt ⇒ λANA>λBNB
∴ NA>NB (rate of decay of B is slower)
∴ λB>λA ,
∴ λB>λA
⇒ τA>τB [∴Average lifeτ=1λ]
|
Topper's Solved these Questions
Similar Questions
Knowledge Check
Which sample contains greater number of nuclei ?
a 5.00−μCi sample of .240Pu (half-life 6560y)
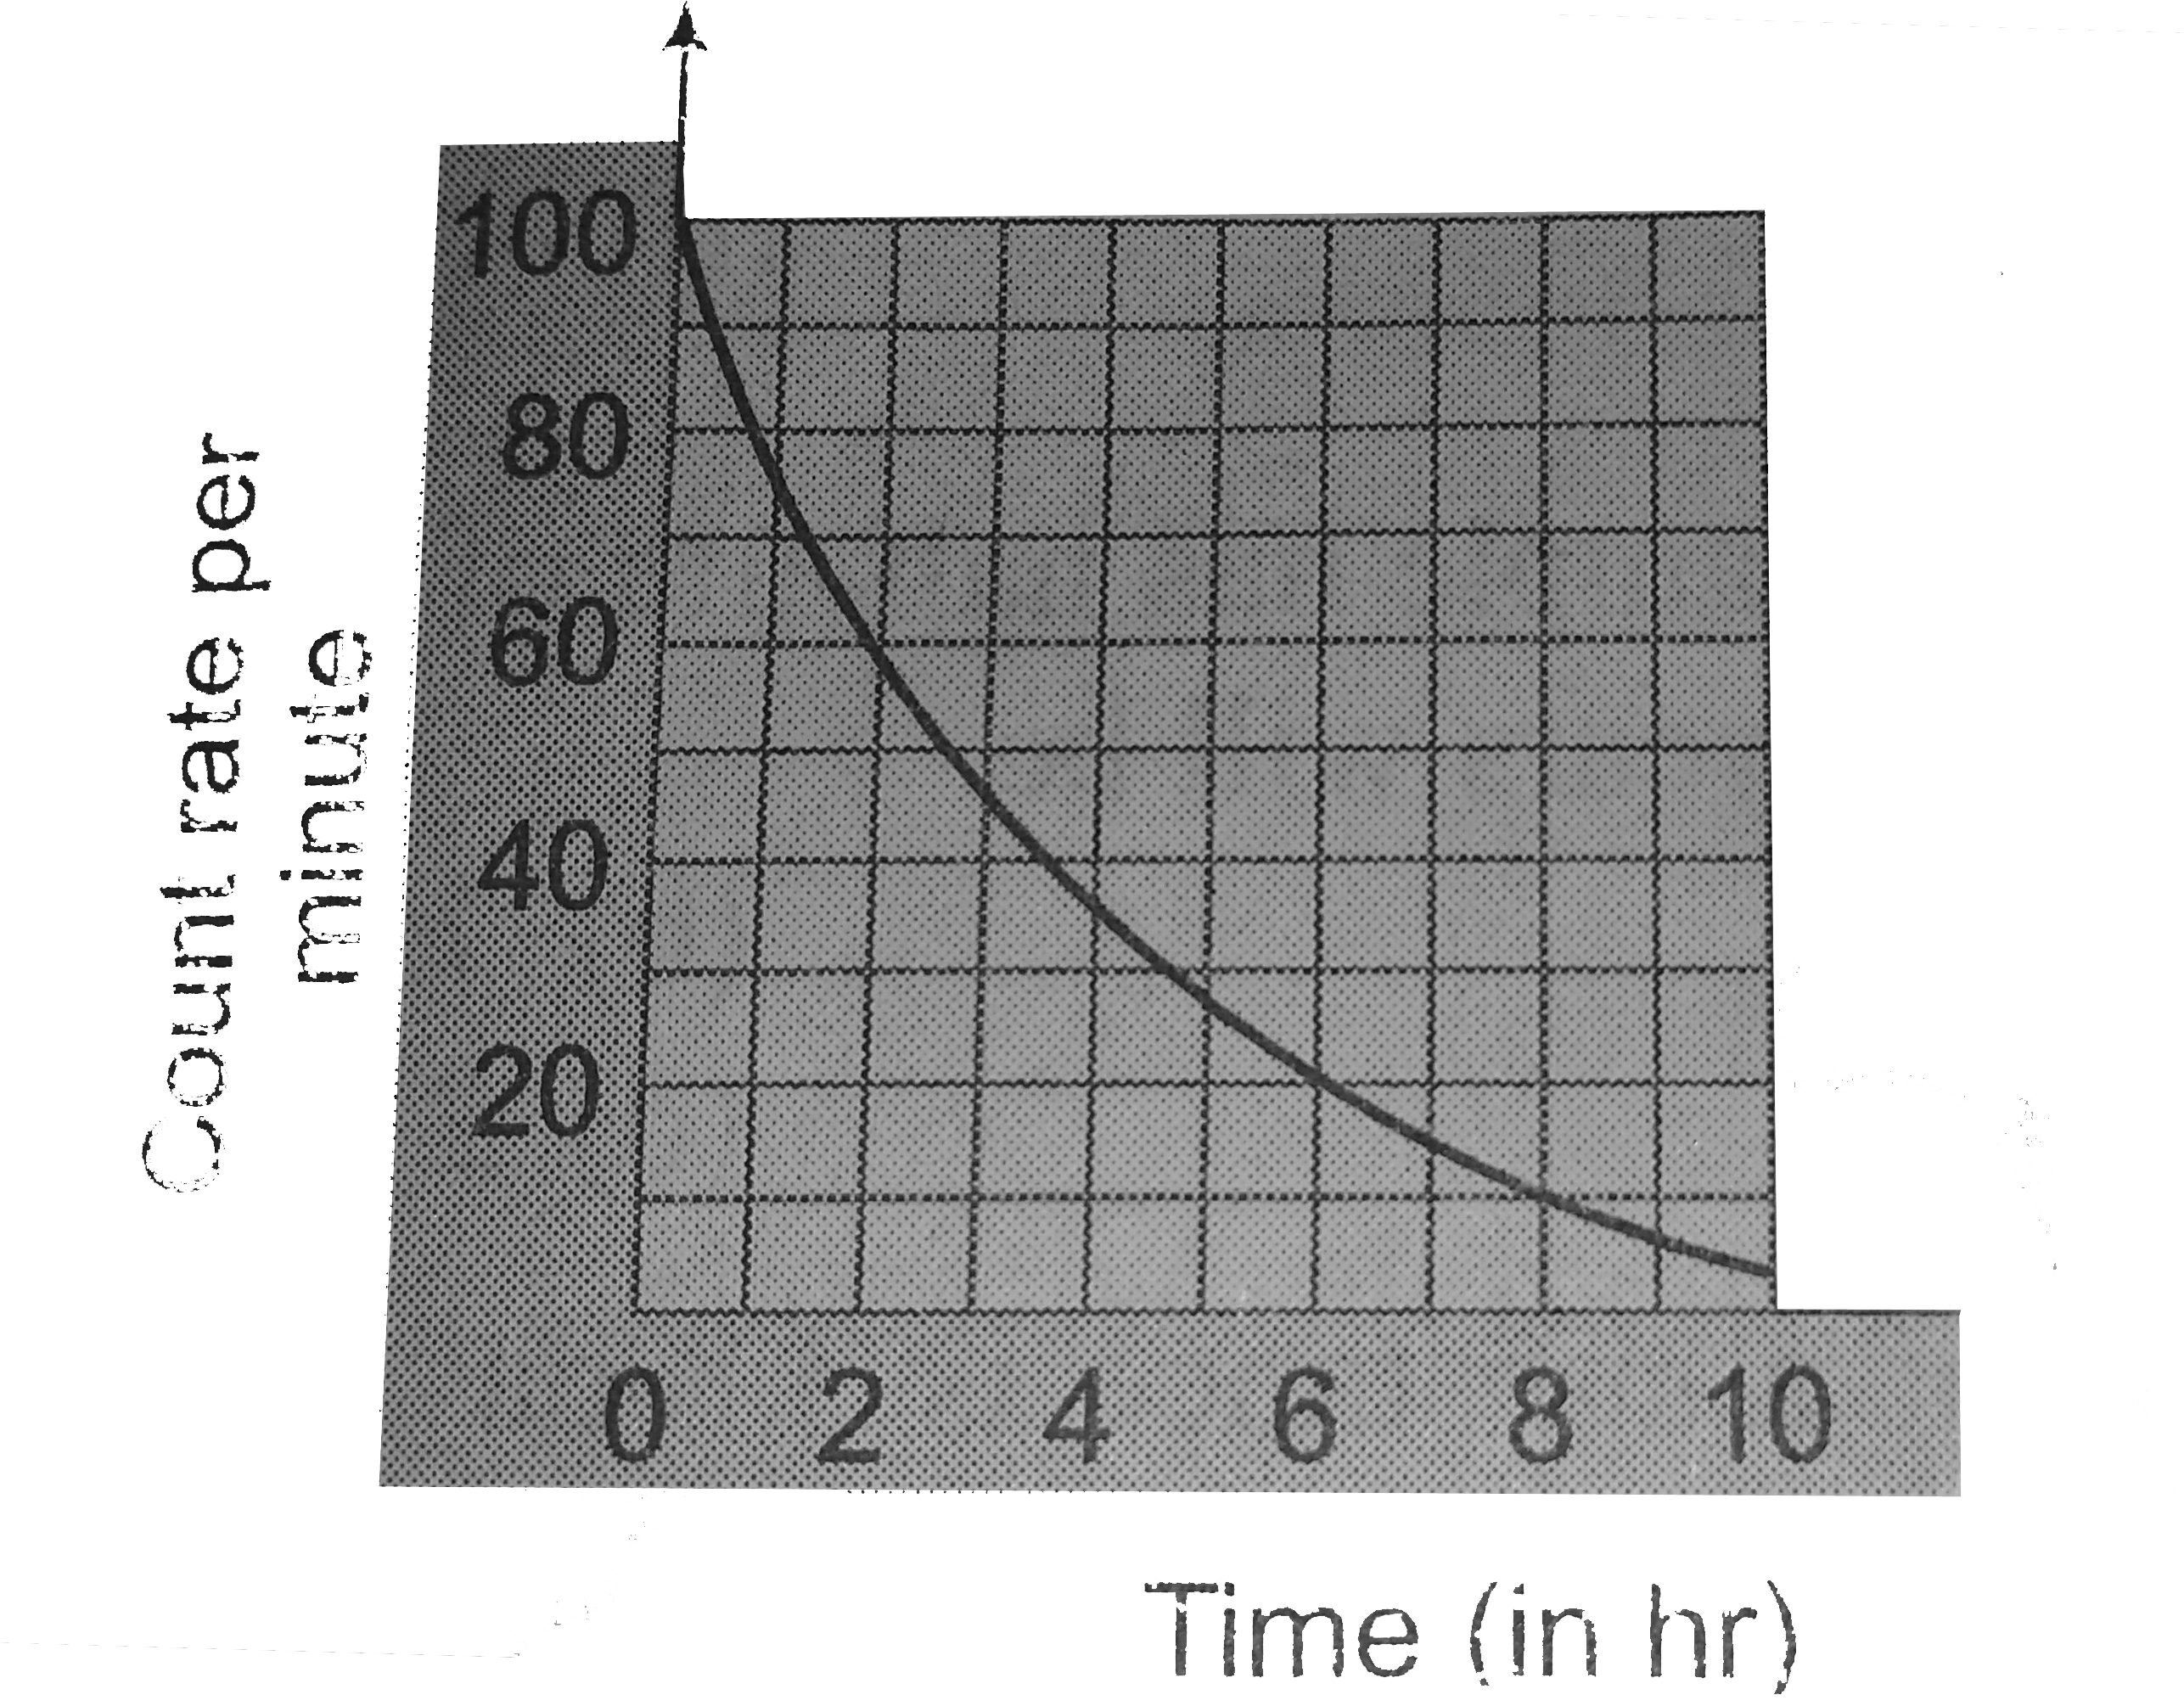
or a4.45−μCi sample of .243Am (half-life 7370y).A.240PuB.243AmCEqual in bothDNone of theseThe count rate of 10g of radioactive material was measured at different times and times has been shown in the figure. The half-life of material and the total counts (approximately) in the first half life period, respectively are.
 .A4h,9000B3h,14000C3h,235D3h,50
What percentage of the atoms in a sample will remain undecayed in a time equal to mean life ?
A1B0.63C0.5D0.37
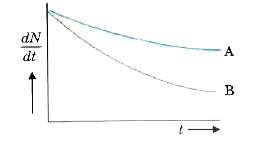
Which sample, A or B, shown in the following figure has shorter mean life?
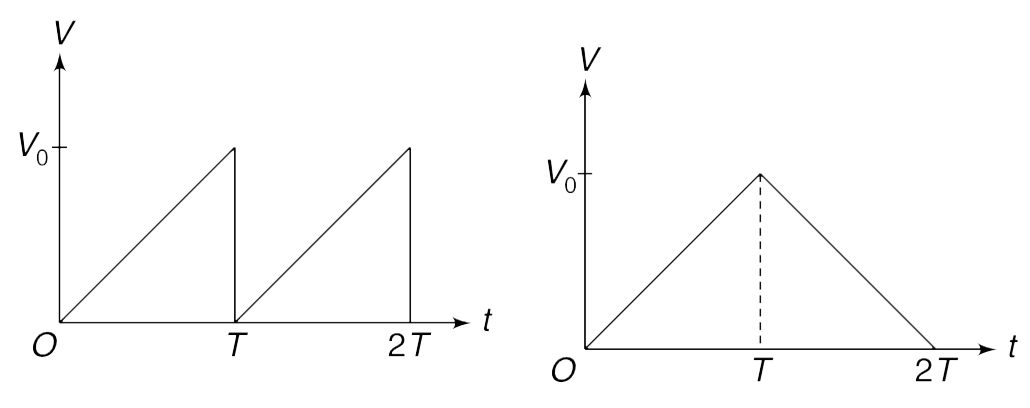
View SolutionWhich of the two waveforms shown in Figure has a higher average value?
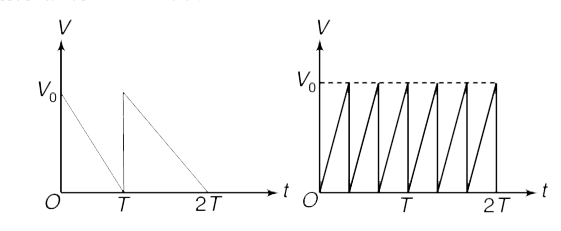
View SolutionWhich of the two waveforms shown in Figure has a higher rms value?
View SolutionWhich colour of light has the shorter wavelength-red or violet ?
View SolutionThe half-life of a radioactive sample A is same as the mean life of sample B. The number of atoms present initially in both the samples is same.
View Solution
