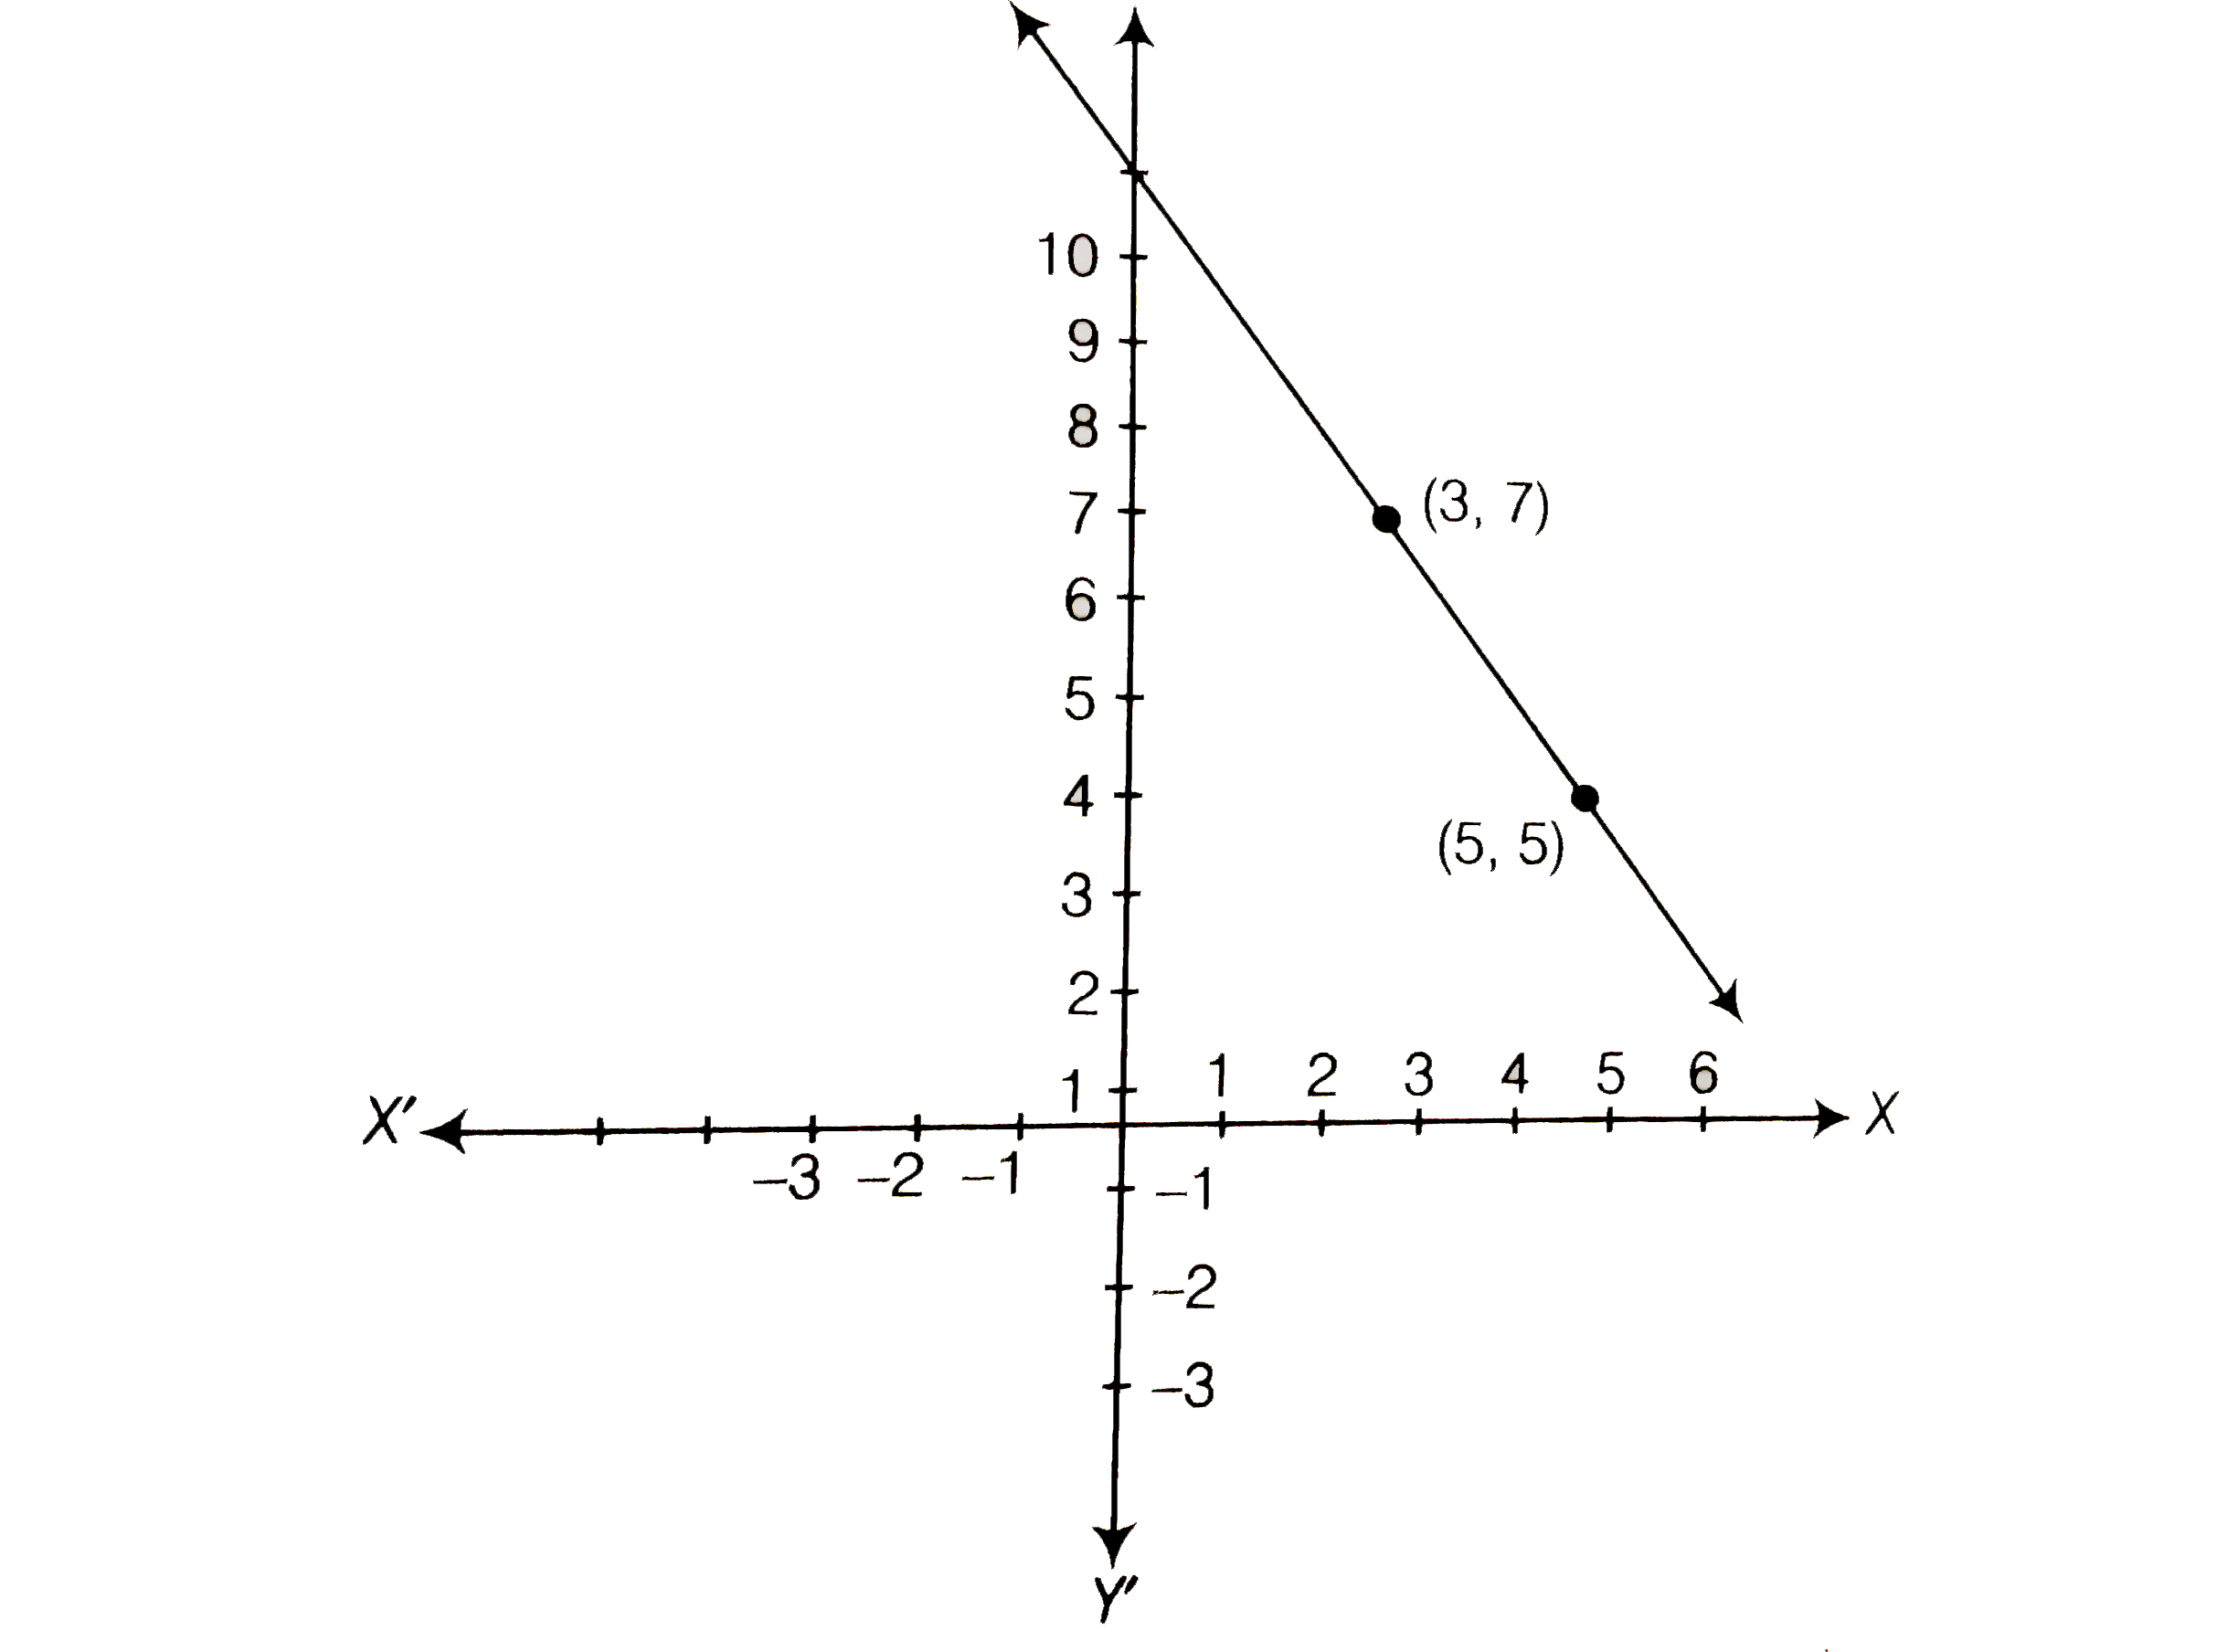
Draw the graph of the linear equation whose solutions are represented by the points having the sum of the coordinates as 10 units.
Video Solution
Text Solution
As per question, the sum of the coordinates is 10 units.
Let x and y be two coordinates, then we get x+y=10.

For x=5, y=5, thereofre, (5, 5) lies on the graph of x+y=10.
For x=3, y= 7, therefore, (3, 7) lies on the graph of x+y=10.
Now, plotting the points (5, 5) and (3, 7) on the graph paper and joining them by a line, we get graph of the linear equation x+y = 10.
|
Topper's Solved these Questions
Similar Questions
Knowledge Check
A graph of linear equation always represents a :
Astraight lineBparabolaCcircleDNone of theseThe graph of the linear equation y=x passes through the point
A(3/2,−3/2)B(0,3/2)C(1,1)D(−12,12)Draw graph for following equations :
Av=v0−atBv=4t−3Cx=4at2Dv=−gt
Draw the graph of the linear equation y-x=2. Find the points of intersection of it with both axes.
View SolutionDraw the graph of following linear equation in two variables x+y=4
View SolutionDraw the linear graph of equation : 4y=8x+2
View SolutionThe graph of the linear equation 2x+5y=10 meets the x-axis at the point
View SolutionThe graph of linear equation y = x passes throgh the point
View Solution