The given graph represents

x∈(−∞,−2)
x∈(−∞,−2]
x∈(−2,∞]
x∈[−2,∞)
The correct Answer is:B
The given graph represents all values less than -2 including -2.
⇒x∈(−∞,−2]
Topper's Solved these Questions
- BOOK - NCERT EXEMPLARCHAPTER - LINEAR INEQUALITIESEXERCISE - Long Answer Type Question6videos
LINEAR INEQUALITIES
- BOOK - NCERT EXEMPLARCHAPTER - LIMITS AND DERIVATIVES EXERCISE - FILLERS4videos
LIMITS AND DERIVATIVES
- BOOK - NCERT EXEMPLARCHAPTER - MATHEMATICAL REASONING EXERCISE - OBJECTIVE TYPE QUESTIONS21videos
MATHEMATICAL REASONING
Similar Questions
Which one of the following given graphs represents the variation of rate constant (k) with temperature (f) for an endothermic reaction ?
View SolutionWhich one of the following given graphs represents the variation of rate constant (k) with temperature (t) for an endothermic reaction ?
View Solution
Knowledge Check
- Question 1 - Select One
Refer to the given graph representing interplay of different hormones (A-D) during menstrual cycle in women and answer the question that follow.
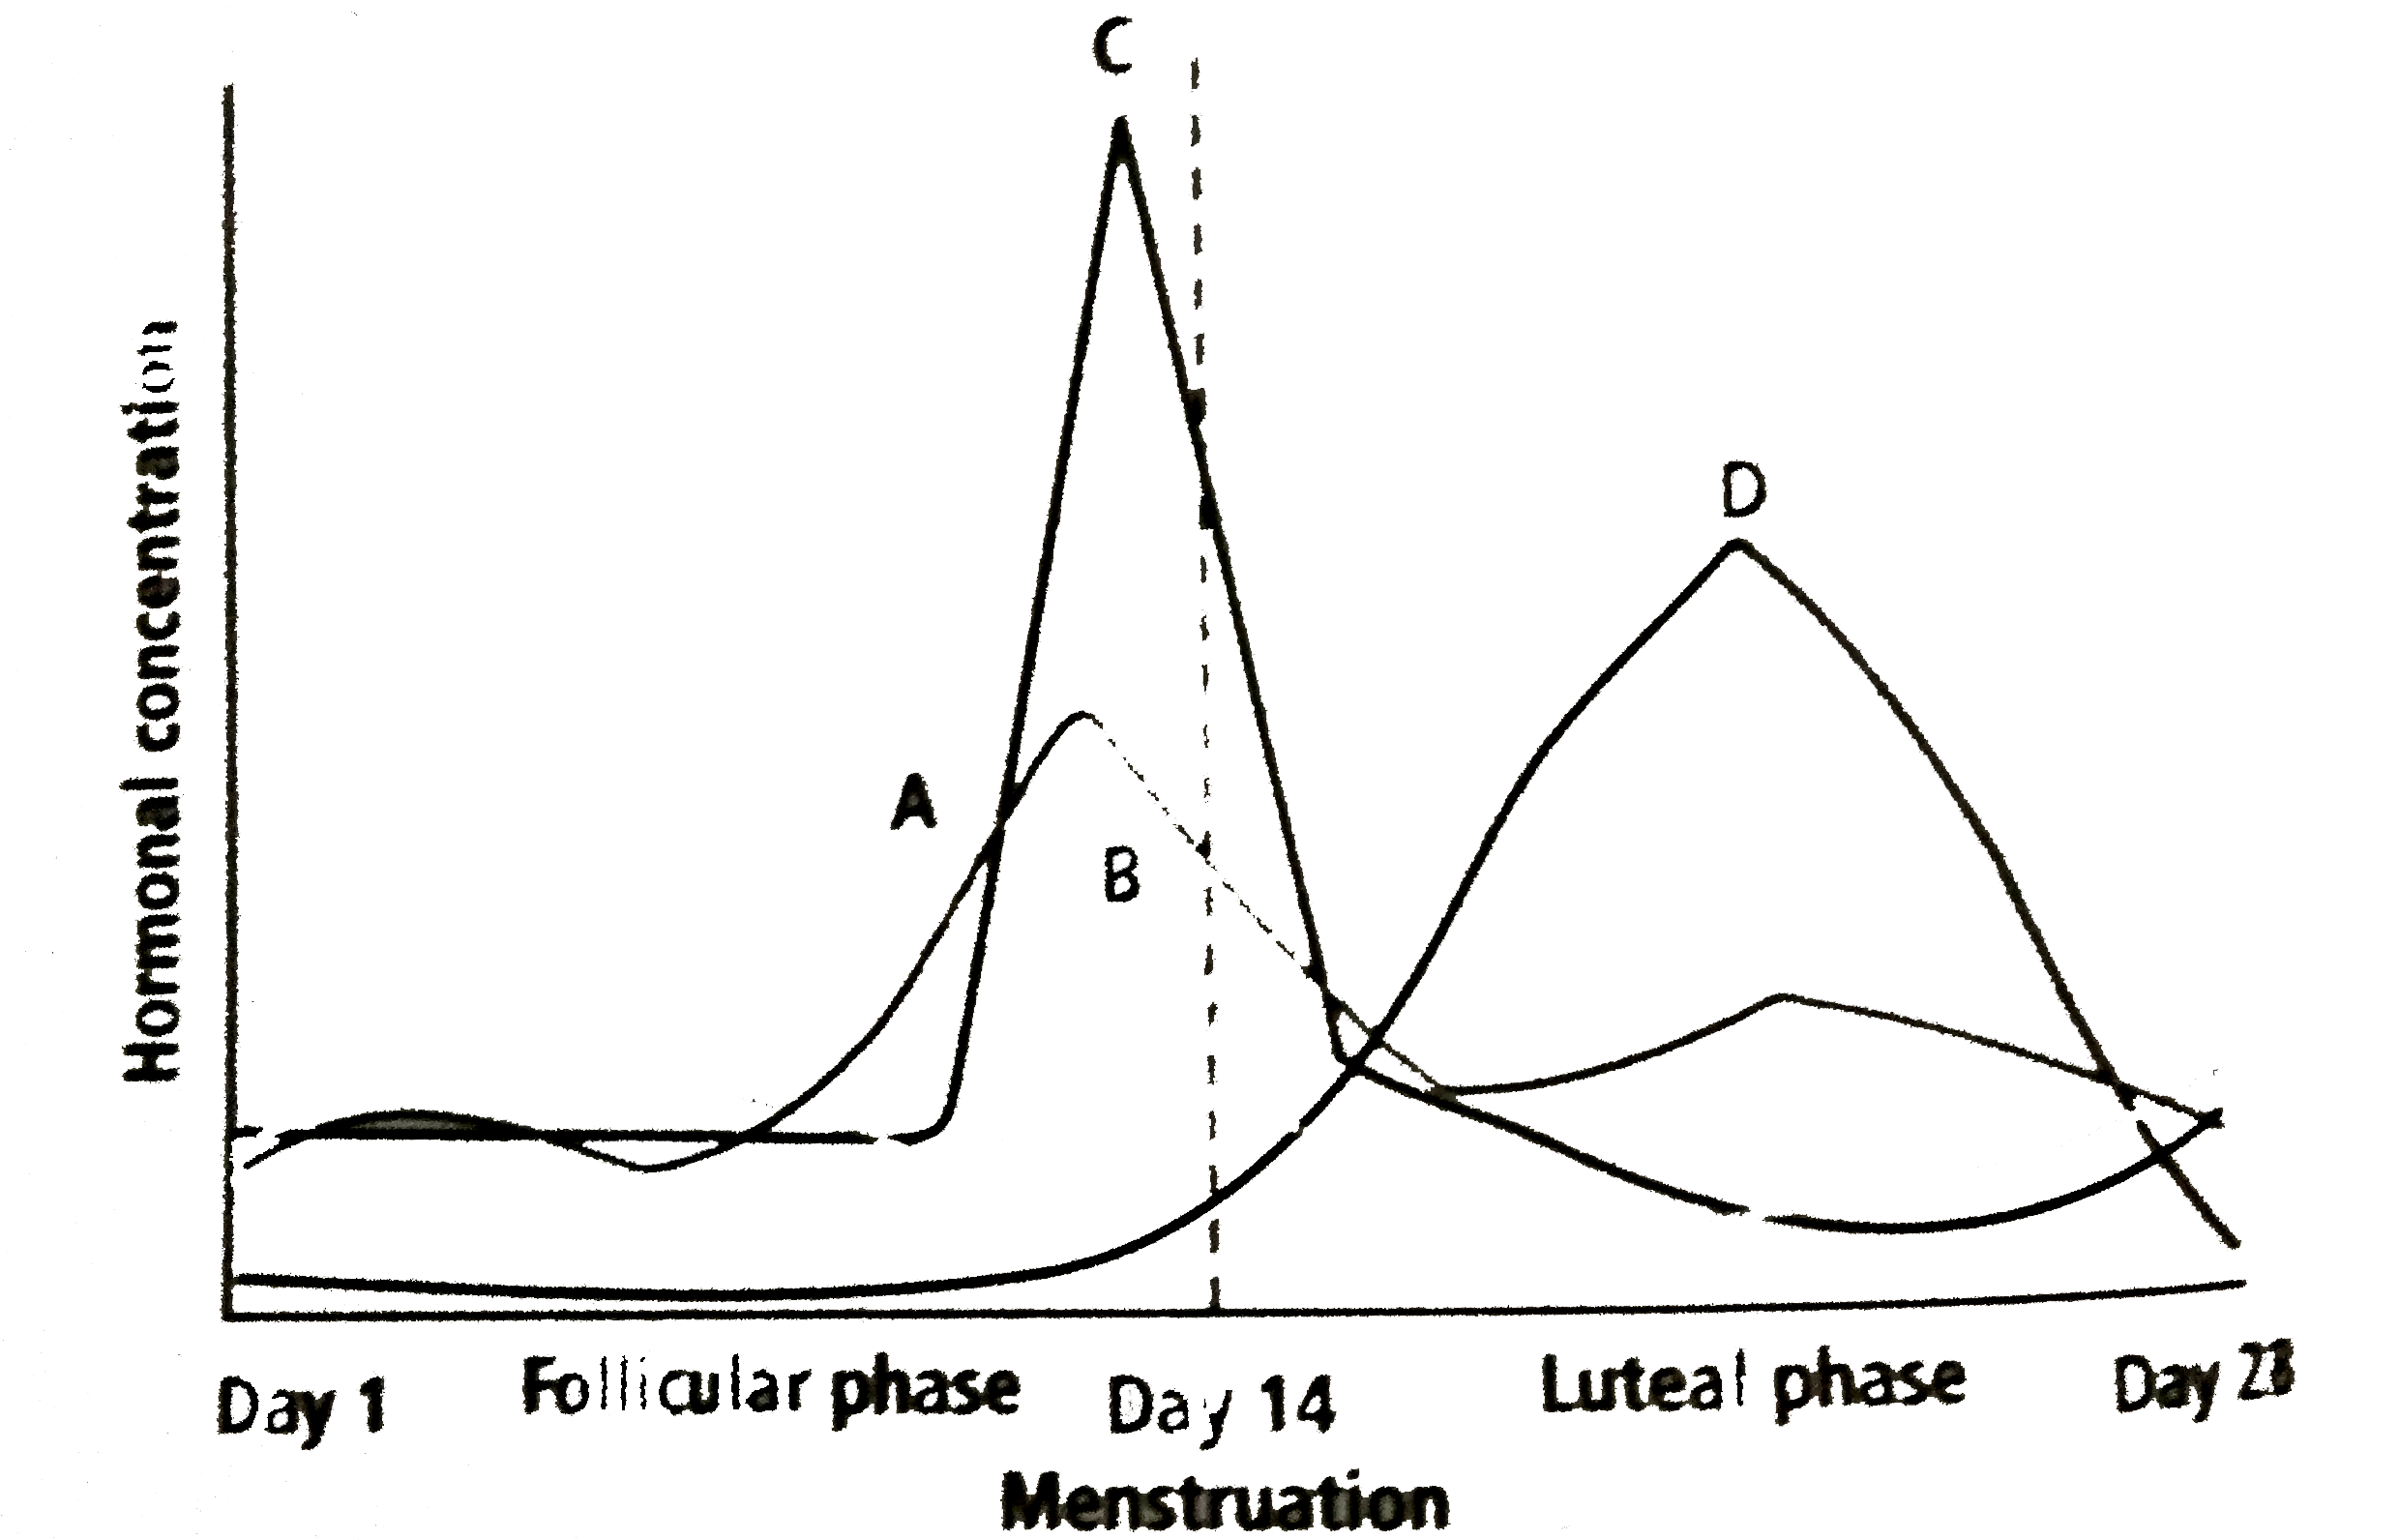
Cessation of secretion of which of these hormones may lead to osteoporosis?AABBCCDD - Question 2 - Select One
Refer to the given graph representing interplay of different hormones (A-D) during menstrual cycle in women and answer the question that follow.
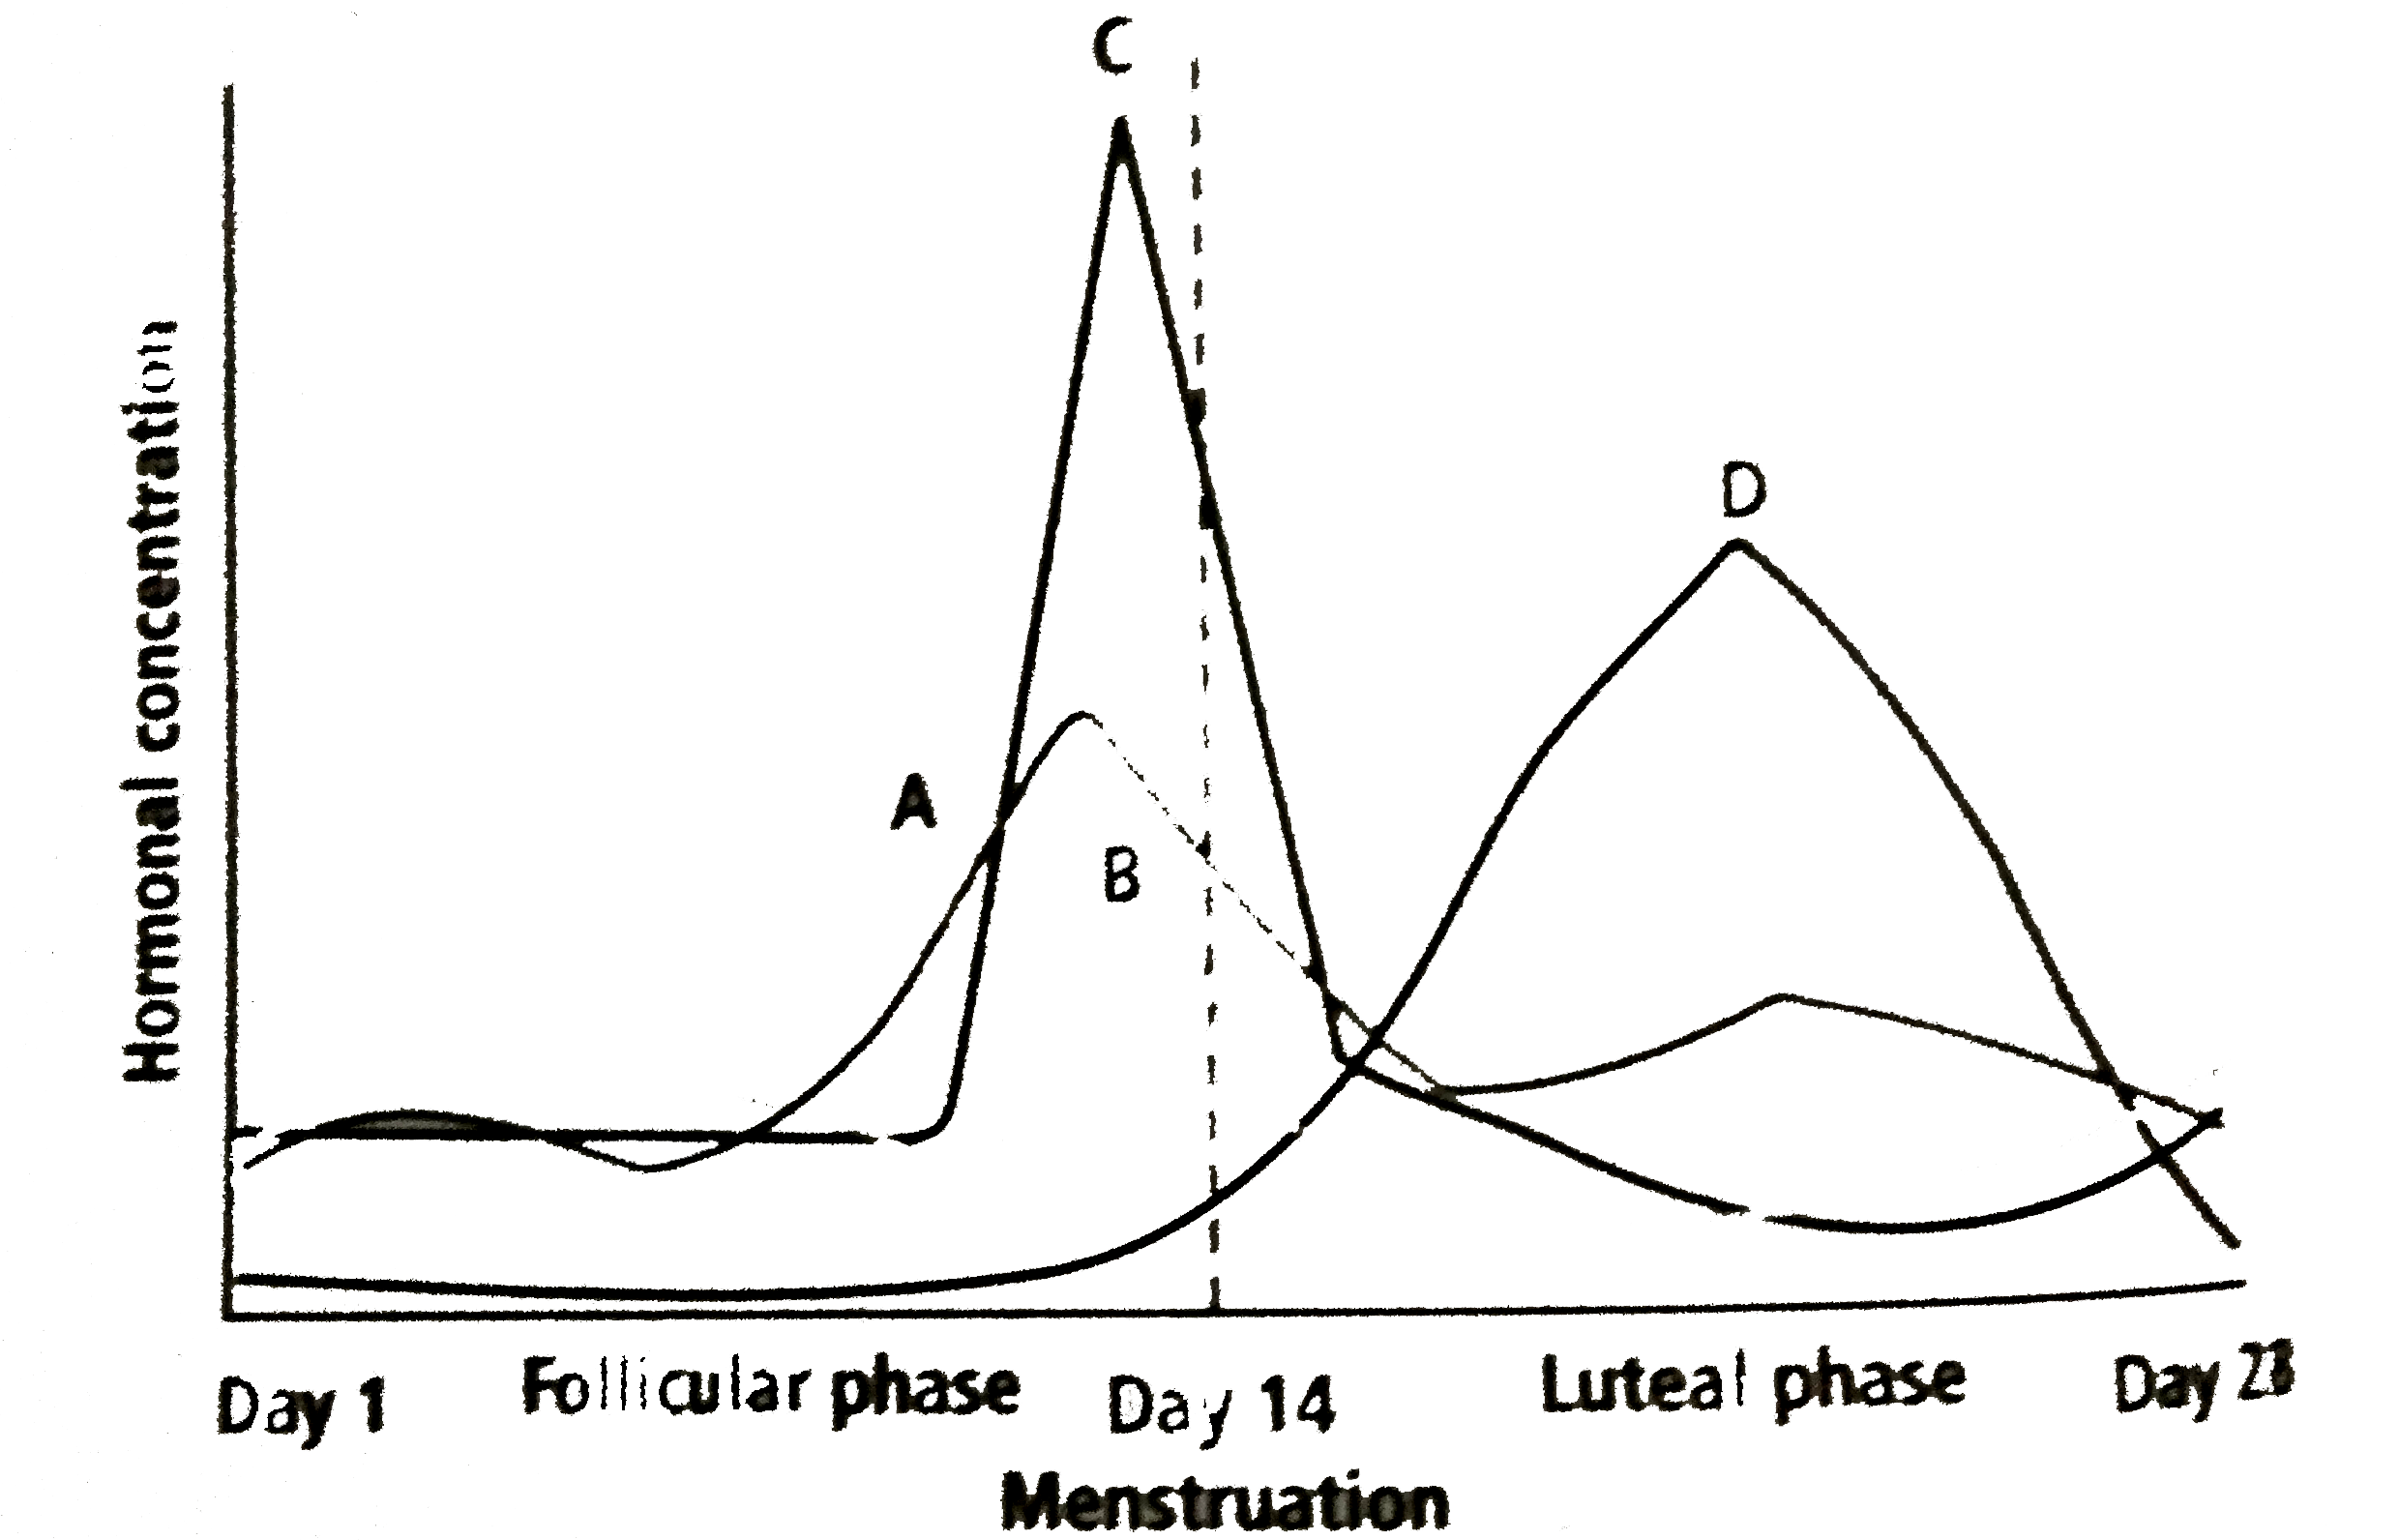 Which hormone (A,B,C or D) is necessary for the final follicular grwoth and ovulation? AABBCCDD
 - Question 3 - Select One
Refer to the given graph representing interplay of different hormones (A-D) during menstrual cycle in women and answer the question that follow.
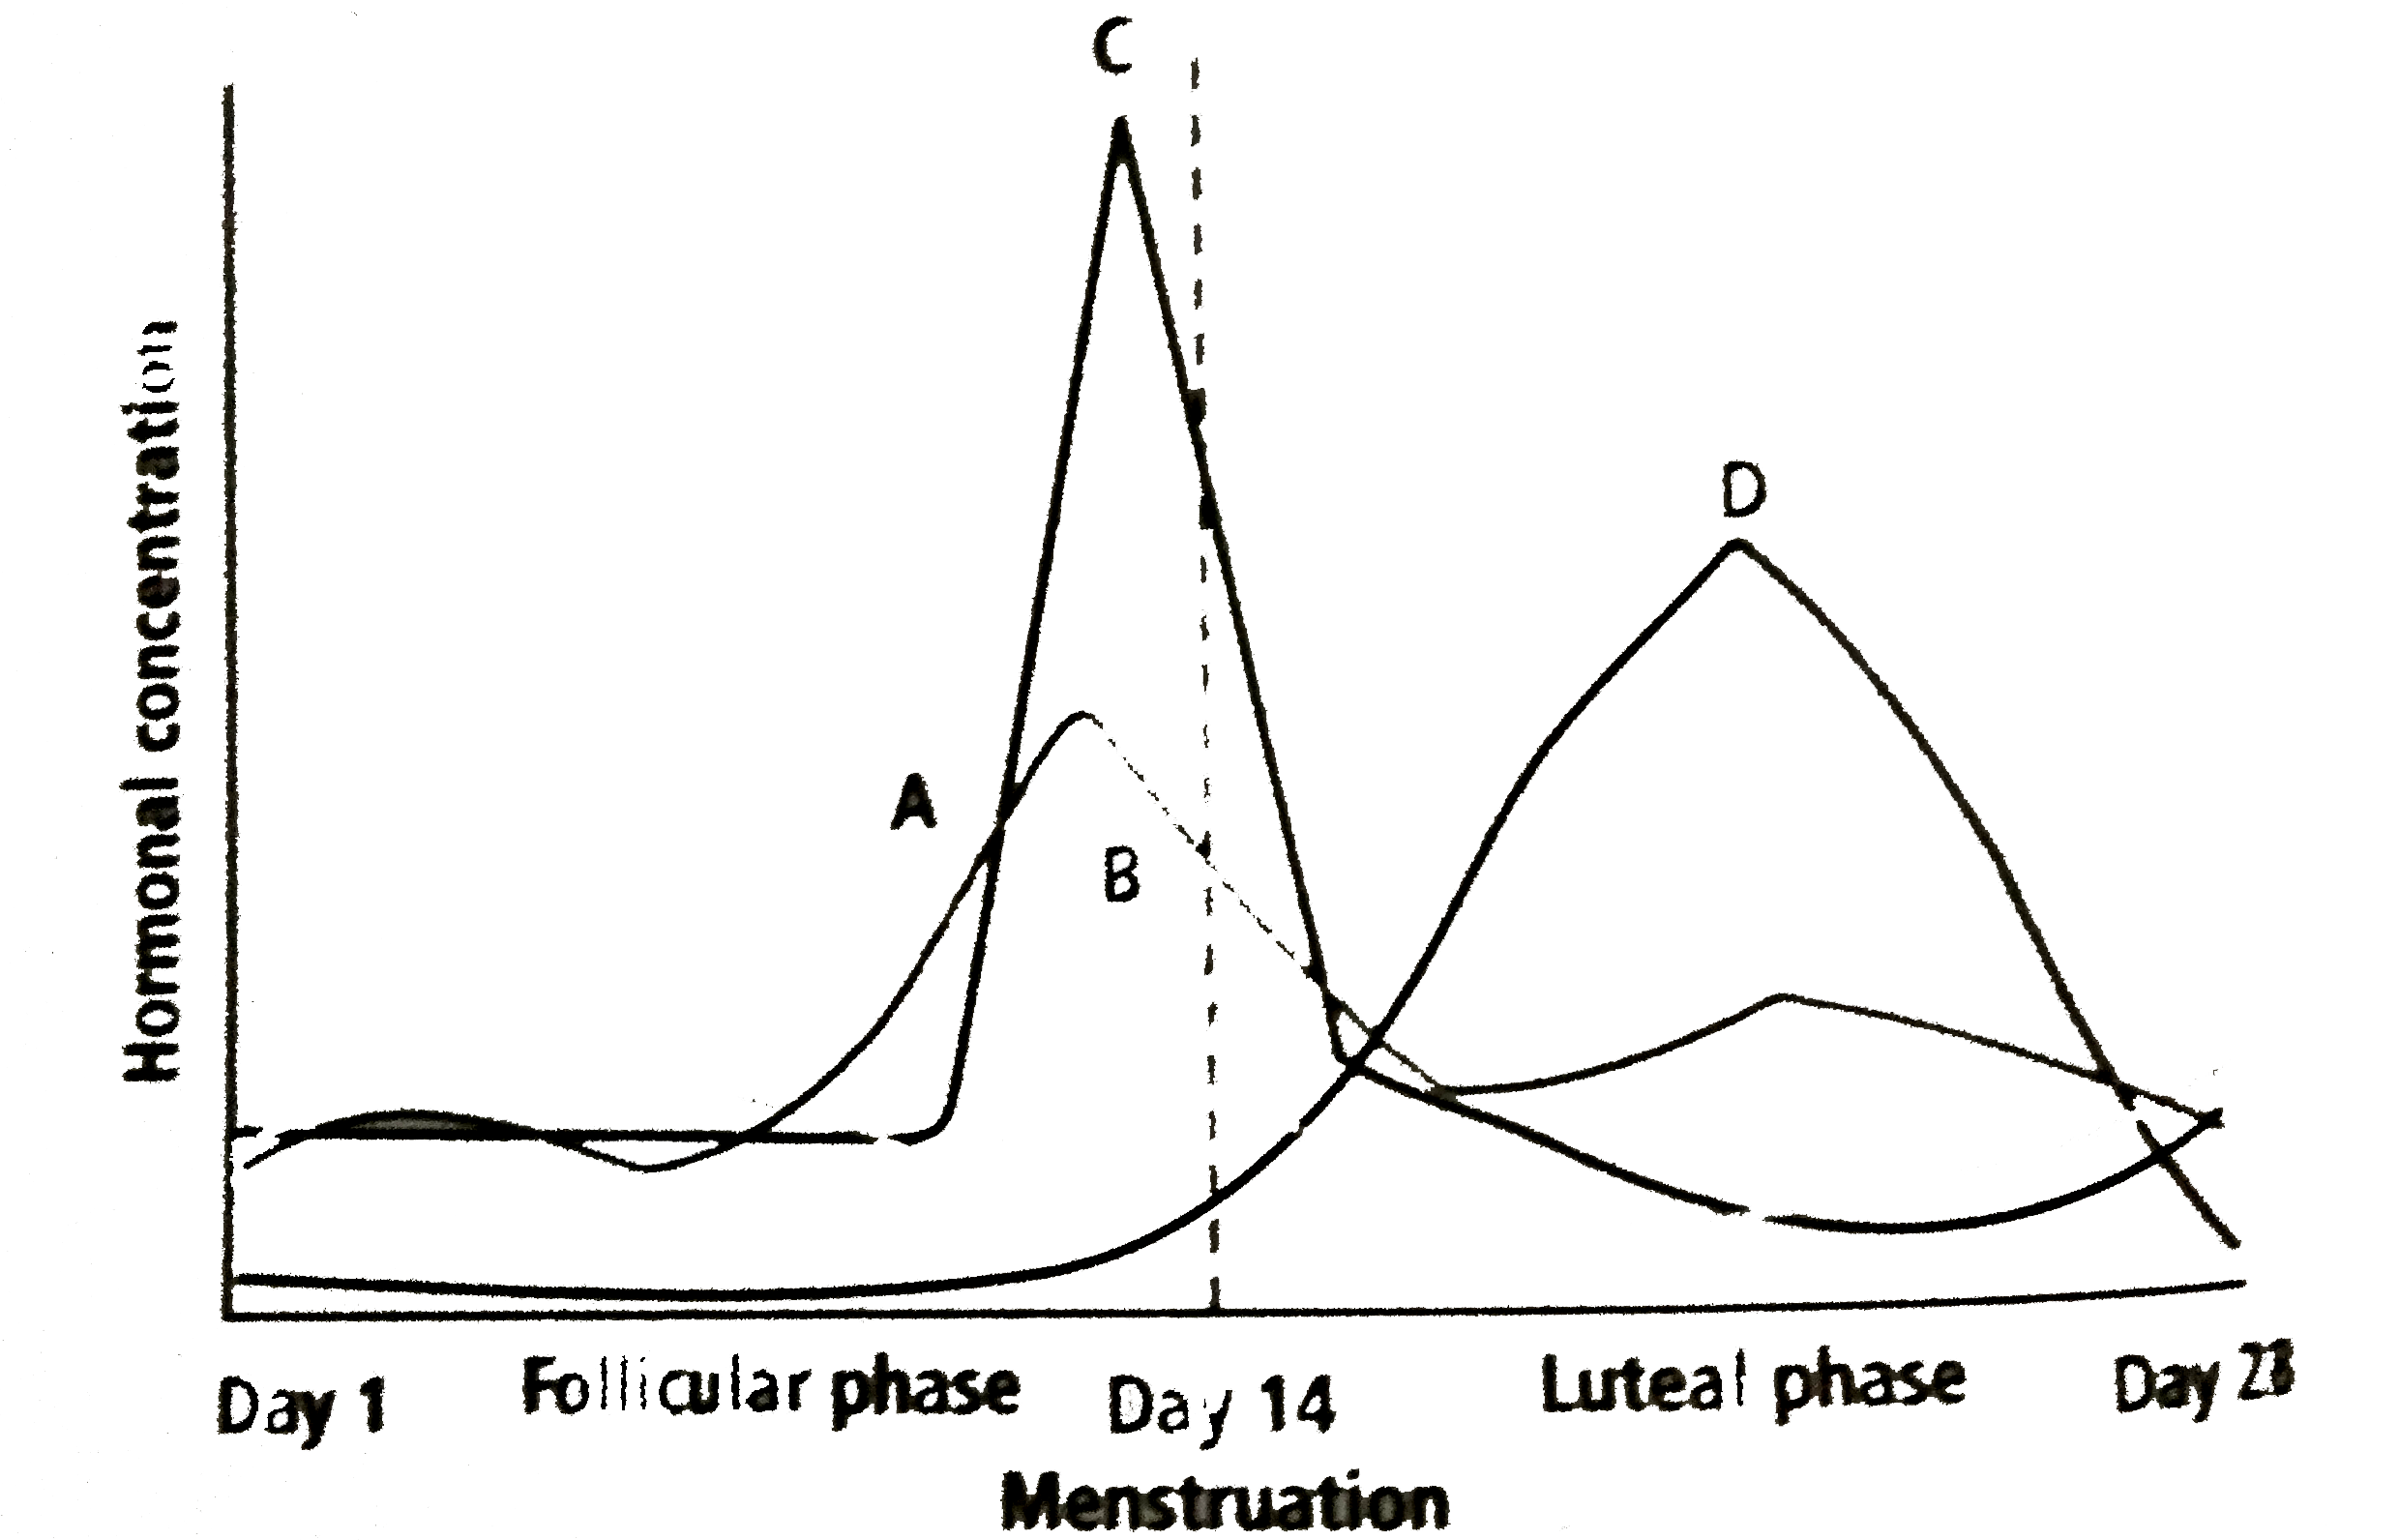
Which hormones are excreted in urine after menopause?AABBCCDBoth b and c
The given bar graph represents the sale of cars in five different states in a month.
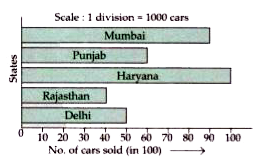
Which state sold maximum number of cars ?View SolutionThe given bar graph represents the sale of cars in five different states in a month.
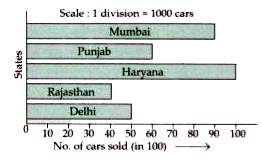
Which state sold 5000 cars ?View SolutionRefer to the given graph representing interplay of different hormones (A-D) during menstrual cycle in women and answer the question that follow.
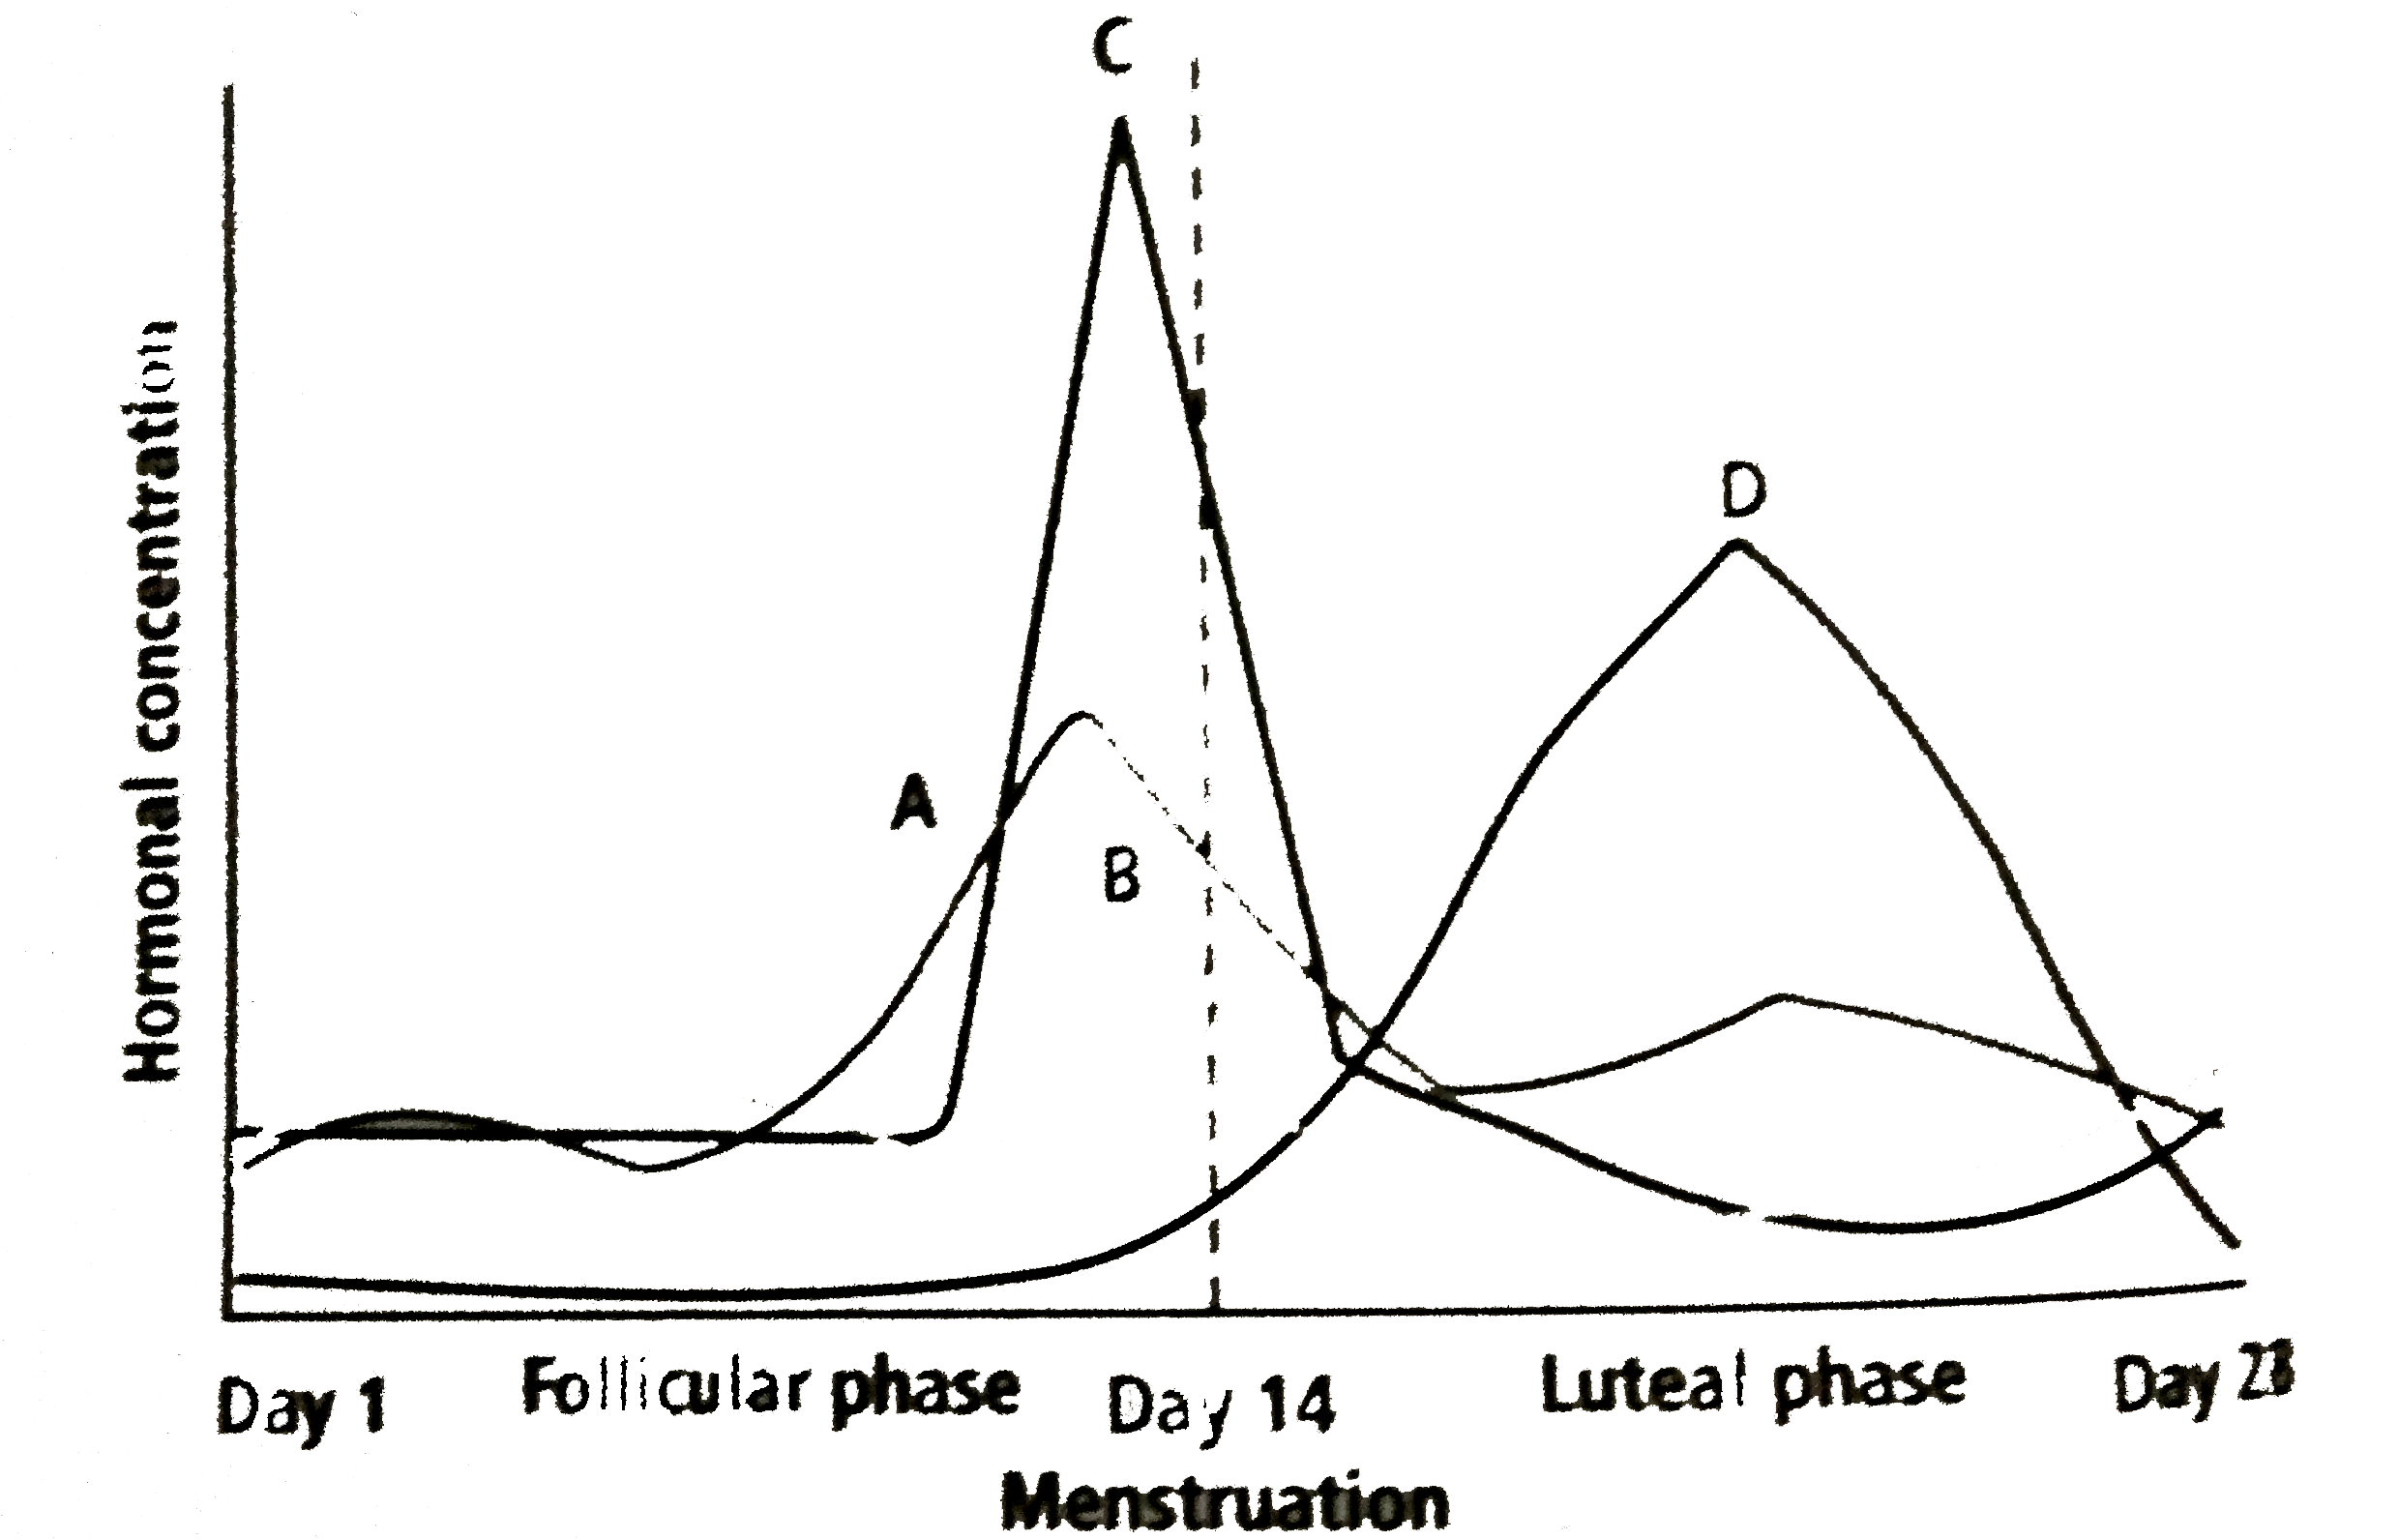
Which hormones is most effective in producing uterine changes during menstrual cycle?View SolutionRefer to the given graph representing two crop fields X and Y that have been treated by different types of materials for nutrient replenishment, keeping other environmental factors same.

Select the incorrect statements regarding these crop fields X and Y.View SolutionThe given bar graph represents the number of boys and girls in five different schools. Study the graph and answer the question that follows
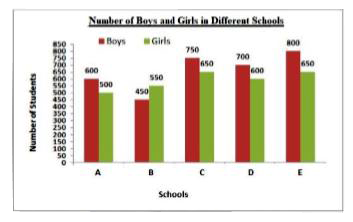
In which school is the percentage of girls the lowest ?View Solution

