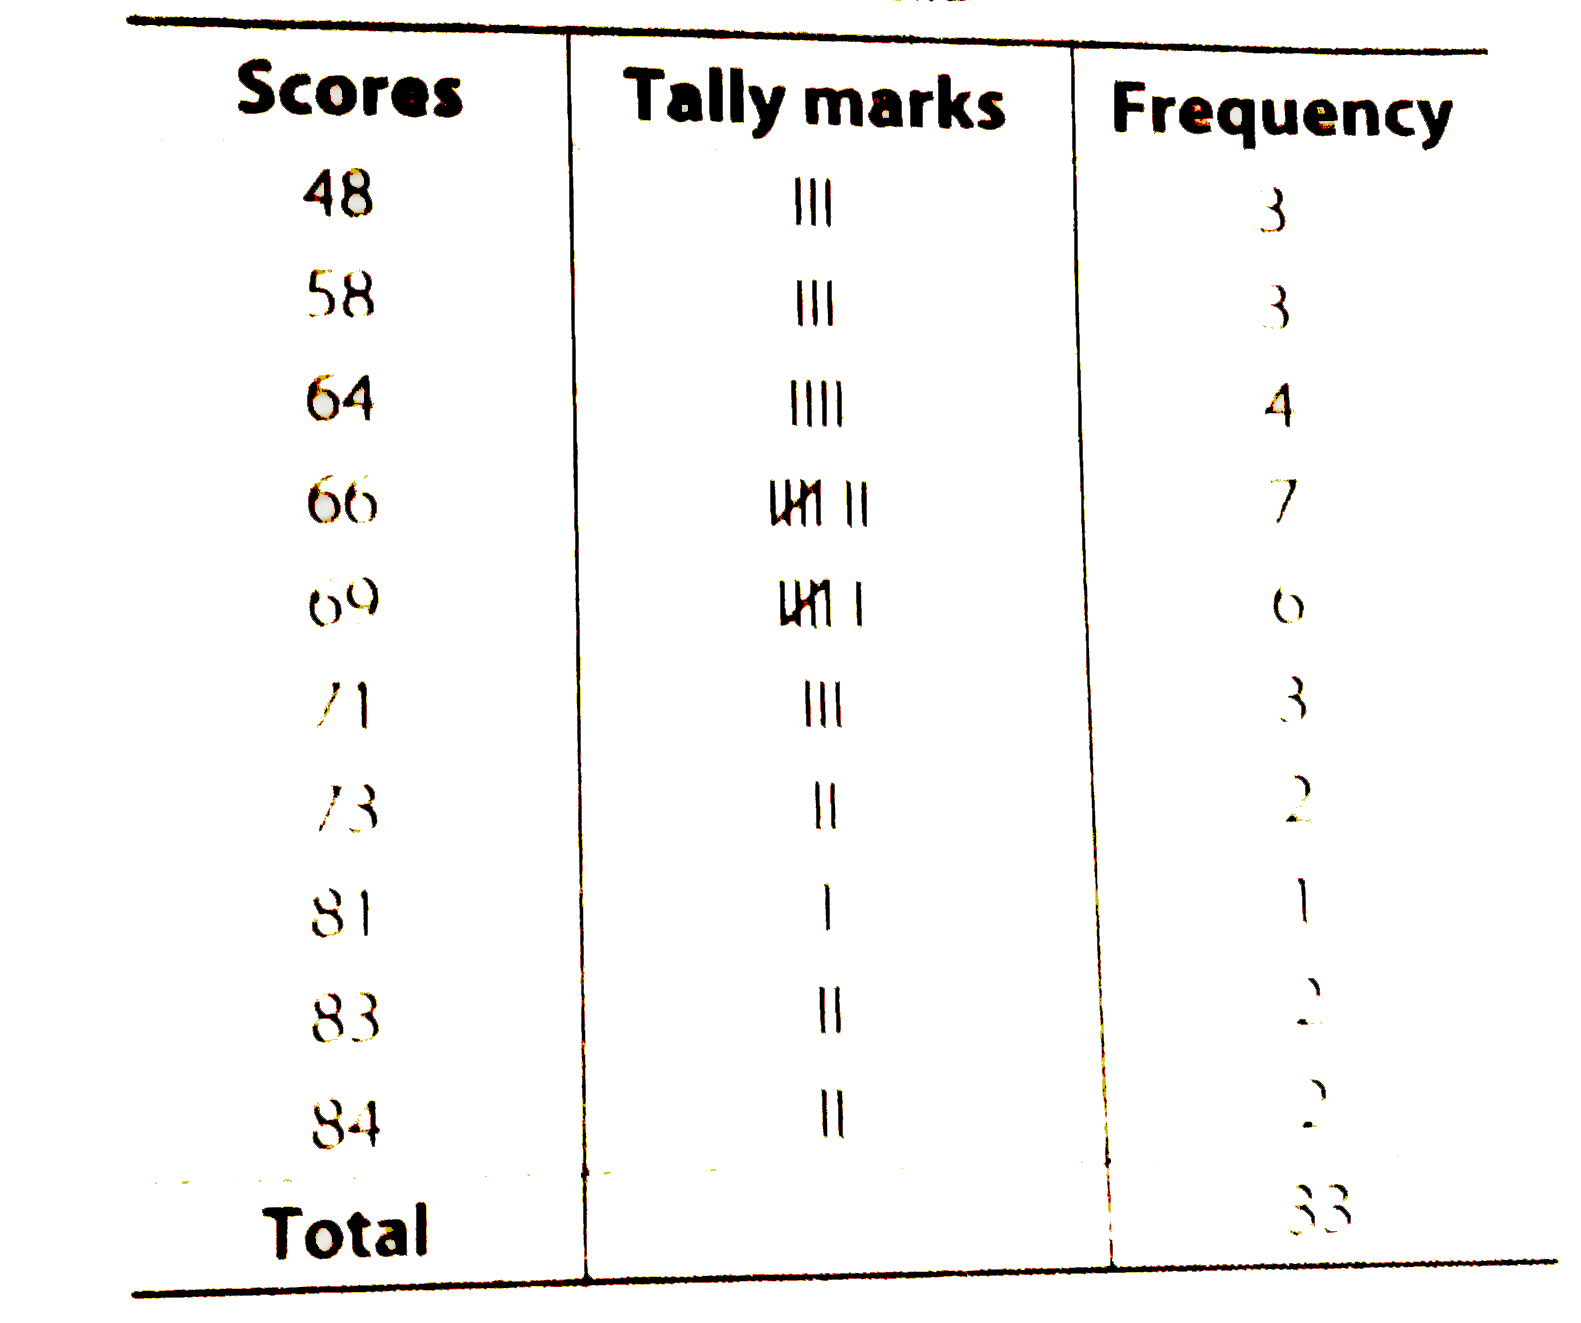
The scores (out of 100) obtained by 33 students in a mathematics test are as follows
69.48.84,58,48,73,83,48,66,58,84,66,64,71,64,66,69,66,83,66,69,71,81,71,73,69,66,66,64,58,64,69,69.
Represent this data in the form of a frequency distribution.
The number of students who have the same marks in mathematics is called the frequency of that mark.
A frequency distribution table for the given data is given below

Topper's Solved these Questions
Similar Questions
The marks obtained by 17 students in a mathematics test (out of 100) are given below:
90,79,76,82,65,96,100,91,82,100,49,46,64,48,72,66,68.
Find he range of the above data.View SolutionWe are given the following marks secured by 25 students in an examination .
23,28,30,32,35,36,36,40,41,43,44,44,45,48,49,52,53,54,56,56,58,61,62,65,68.
(i)Arrange this data in the form of a frequency distribution taking the following class intervals.
20-29,30-39,40-49,50-59, and 60-69
(ii) Draw the frequency polygon and ogive for the above data.View SolutionThe marks scored by 40 students of class VIII in mathematics are given below: 81,55,68,79,85,43,29,68,54,73,47,35,72,64,95,44,50,77,64, 35,79,52,45,54,70,83,62,64,72,92,84,76,63,43,54,38,73,68,52,54. Prepare a frequency distribution with class size of 10 marks.
View SolutionHow much is the average of the following numbers?76, 48, 54, 66, 70, 64
View SolutionGiven below are the marks (out of 100) in mathematics obtained by 20 students of a calss in an annual examination.
23,75,56,42,70,84,92,51,40,63,87,58,35,80,14,63,49,72,66,61.
Arrange the above data in ascending order and find
(i) The lowest marks obtained.
(ii) The highest marks obtained.
(iii) The range of the given data.View SolutionThe final marks in mathematics of 30 students are as follows: 53,61,48,60,78,68,55,100,67,90,75,88,77,37,84 58,60,48,62,56,44,58,52,64,98,59,70,39,50,60 Arrange these marks in the ascending order, 30 to 39 one group, 40 to 49 second group etc. Now answer the following: What is the highest score? What is the lowest score? What is the range? If 40 is the pass marks how many have failed? How many have scored 75 or more? Which observations between 50 and 60 have not actually appeared? How many have scored less than 50?
View SolutionThe final marks in mathematics of 30 students are as follows: 53,61,48,60,78,68,55,100,67,90 75,88,77,37,84,58,60,48,62,56 44,58,52,64,98,59,70,39,50,60 Arrange these marks in the ascending order 30 to 39 one group, 40 to 49 second group, etc. What is the highest score? What is the lowest score? (iv) What is the range? If 40 is the pass mark how many have failed? How many have scored 75 or more? Which observations between 50 and 60 have not actually appeared? How many have scored less than 50?
View SolutionFind the average of following numbers. 75,64,70,66,85 and 48
View SolutionThe following data gives the weights of 30 persons (in kg)
70.0,69.4,49.4,64.5,59.4,72.4,47.5,48.8,62.3,64.2,66.8,70.3,71.3,56.3,52.7,66.6,59.9,64.7,44.6,60.3,50.3,54.3,62.3,56.3,45.0,45.7,49.8,60.5,67.8,50.1
(i) Construct a frequency distribution such that the last class is 72−76.
(ii) State the upper class limits of last three class intervals.
(iii) State the maximum weight that can be included in the fourth class interval.
(iv) State the class mark of each of the classes.
(v) Find the range of the given weights.
(vi) If 60kg is the weight of a person then in which class interval, it will be taken.View SolutionThe percentage of marks obtained by a student in the monthly unit tests are given below :
Unit testIIIIIIIVVPercentage of 6971736874mark obtained
Based on this data, find the probability that the student gets more than 70% marks in a unit test.View Solution

