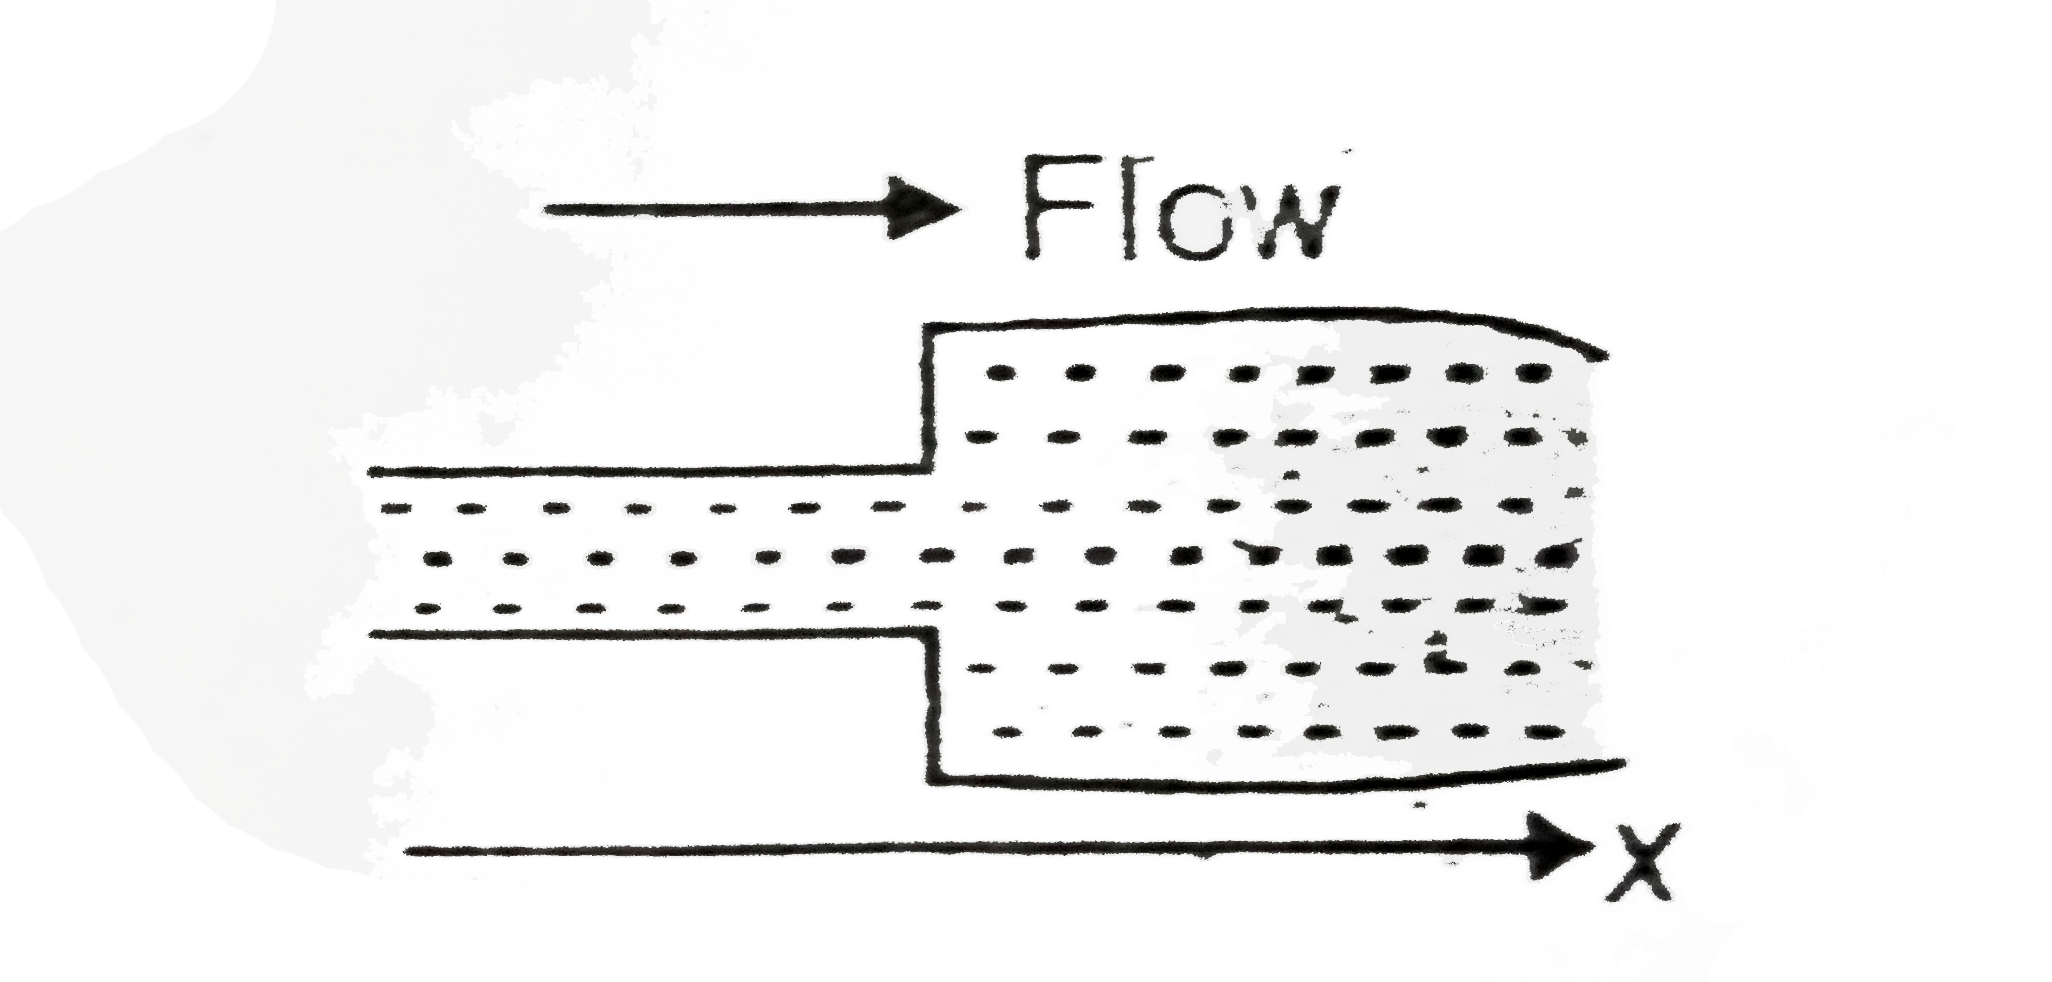
The cross sectional area of a horizontal tube increases along its length linearly, as we move in the direction of flow. The variation of pressure, as we move along its length in the direction of flow (x-direction), is best depicted by which of the following graphs.


Step by step video & image solution for The cross sectional area of a horizontal tube increases along its length linearly, as we move in the direction of flow. The variation of pressure, as we move along its length in the direction of flow (x-direction), is best depicted by which of the following graphs. by Physics experts to help you in doubts & scoring excellent marks in Class 12 exams.
Updated on:21/07/2023Topper's Solved these Questions
- FLUIDBOOK - MOTIONCHAPTER - FLUIDEXERCISE - Exercise-2 (level-I)
10 Videos
- FLUIDBOOK - MOTIONCHAPTER - FLUIDEXERCISE - Exercise-2 (level-II)
2 Videos
- FLUIDBOOK - MOTIONCHAPTER - FLUIDEXERCISE - Exercise-4 level-II
5 Videos
- ERRORS , THEORY BOOK - MOTIONCHAPTER - ERRORS , THEORY EXERCISE - EXERCISE 4 (LEVEL -II)
10 Videos
- GEOMETRICAL OPTICSBOOK - MOTIONCHAPTER - GEOMETRICAL OPTICSEXERCISE - Exercise - 4 | Level-II
55 Videos
Similar Questions
Knowledge Check
A long straight wire of circular cross- section carries a current along its length. On the axis inside the wire, it follows that
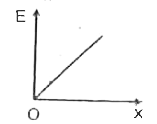
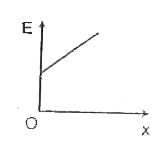
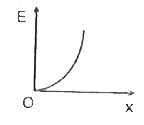
Astrength of electric and magnetic fields are zeroBstrength of electric field is zero but magnetic field is non− zeroCstrength of electric and magnetic field non−zeroDstrength of electric field is non−zero but magnetic field is zero.A cylindrical conductor has uniform cross-section. Resistivity of its material increase linearly from left end to right end. If a constant current is flowing through it and at a section distance x from left end, magnitude of electric field intensity is E , which of the following graphs is correct
A
 B
B
 C
C
 D
D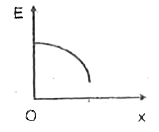
A steady current I is set up in a wire whose cross-sectional area decreases in the direction of the flow of the current. Then, as we examine the narrowing region
Athe current density decreases in value.Bthe magnitude of the electric field increases.Cthe current density remains constant.Dthe average speed of the moving charges remains constant.
A rod of length L kept on a smooth horizontal surface is pulled along its length by a force F. The area of cross-section is A and Young's modulus is Y. The extension in the rod is

View SolutionA transverse wave travels along x-axis . The particles of medium move
View SolutionFor a body moving with uniform acceleration along straight line, the variation of its velocity (v) with position (x) is best represented by
View SolutionA long horizontal metallic rod with length along the east-west direction is falling under gravity. The potential difference between its two ends will
View SolutionA point moving along the x- direction starts from rest at x=0 and comes to rest at x=1 after 1 s. Its acceleration at any point is denoted by α . Which of the following is not correct ?
View Solution

