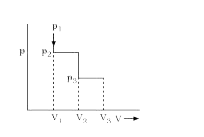
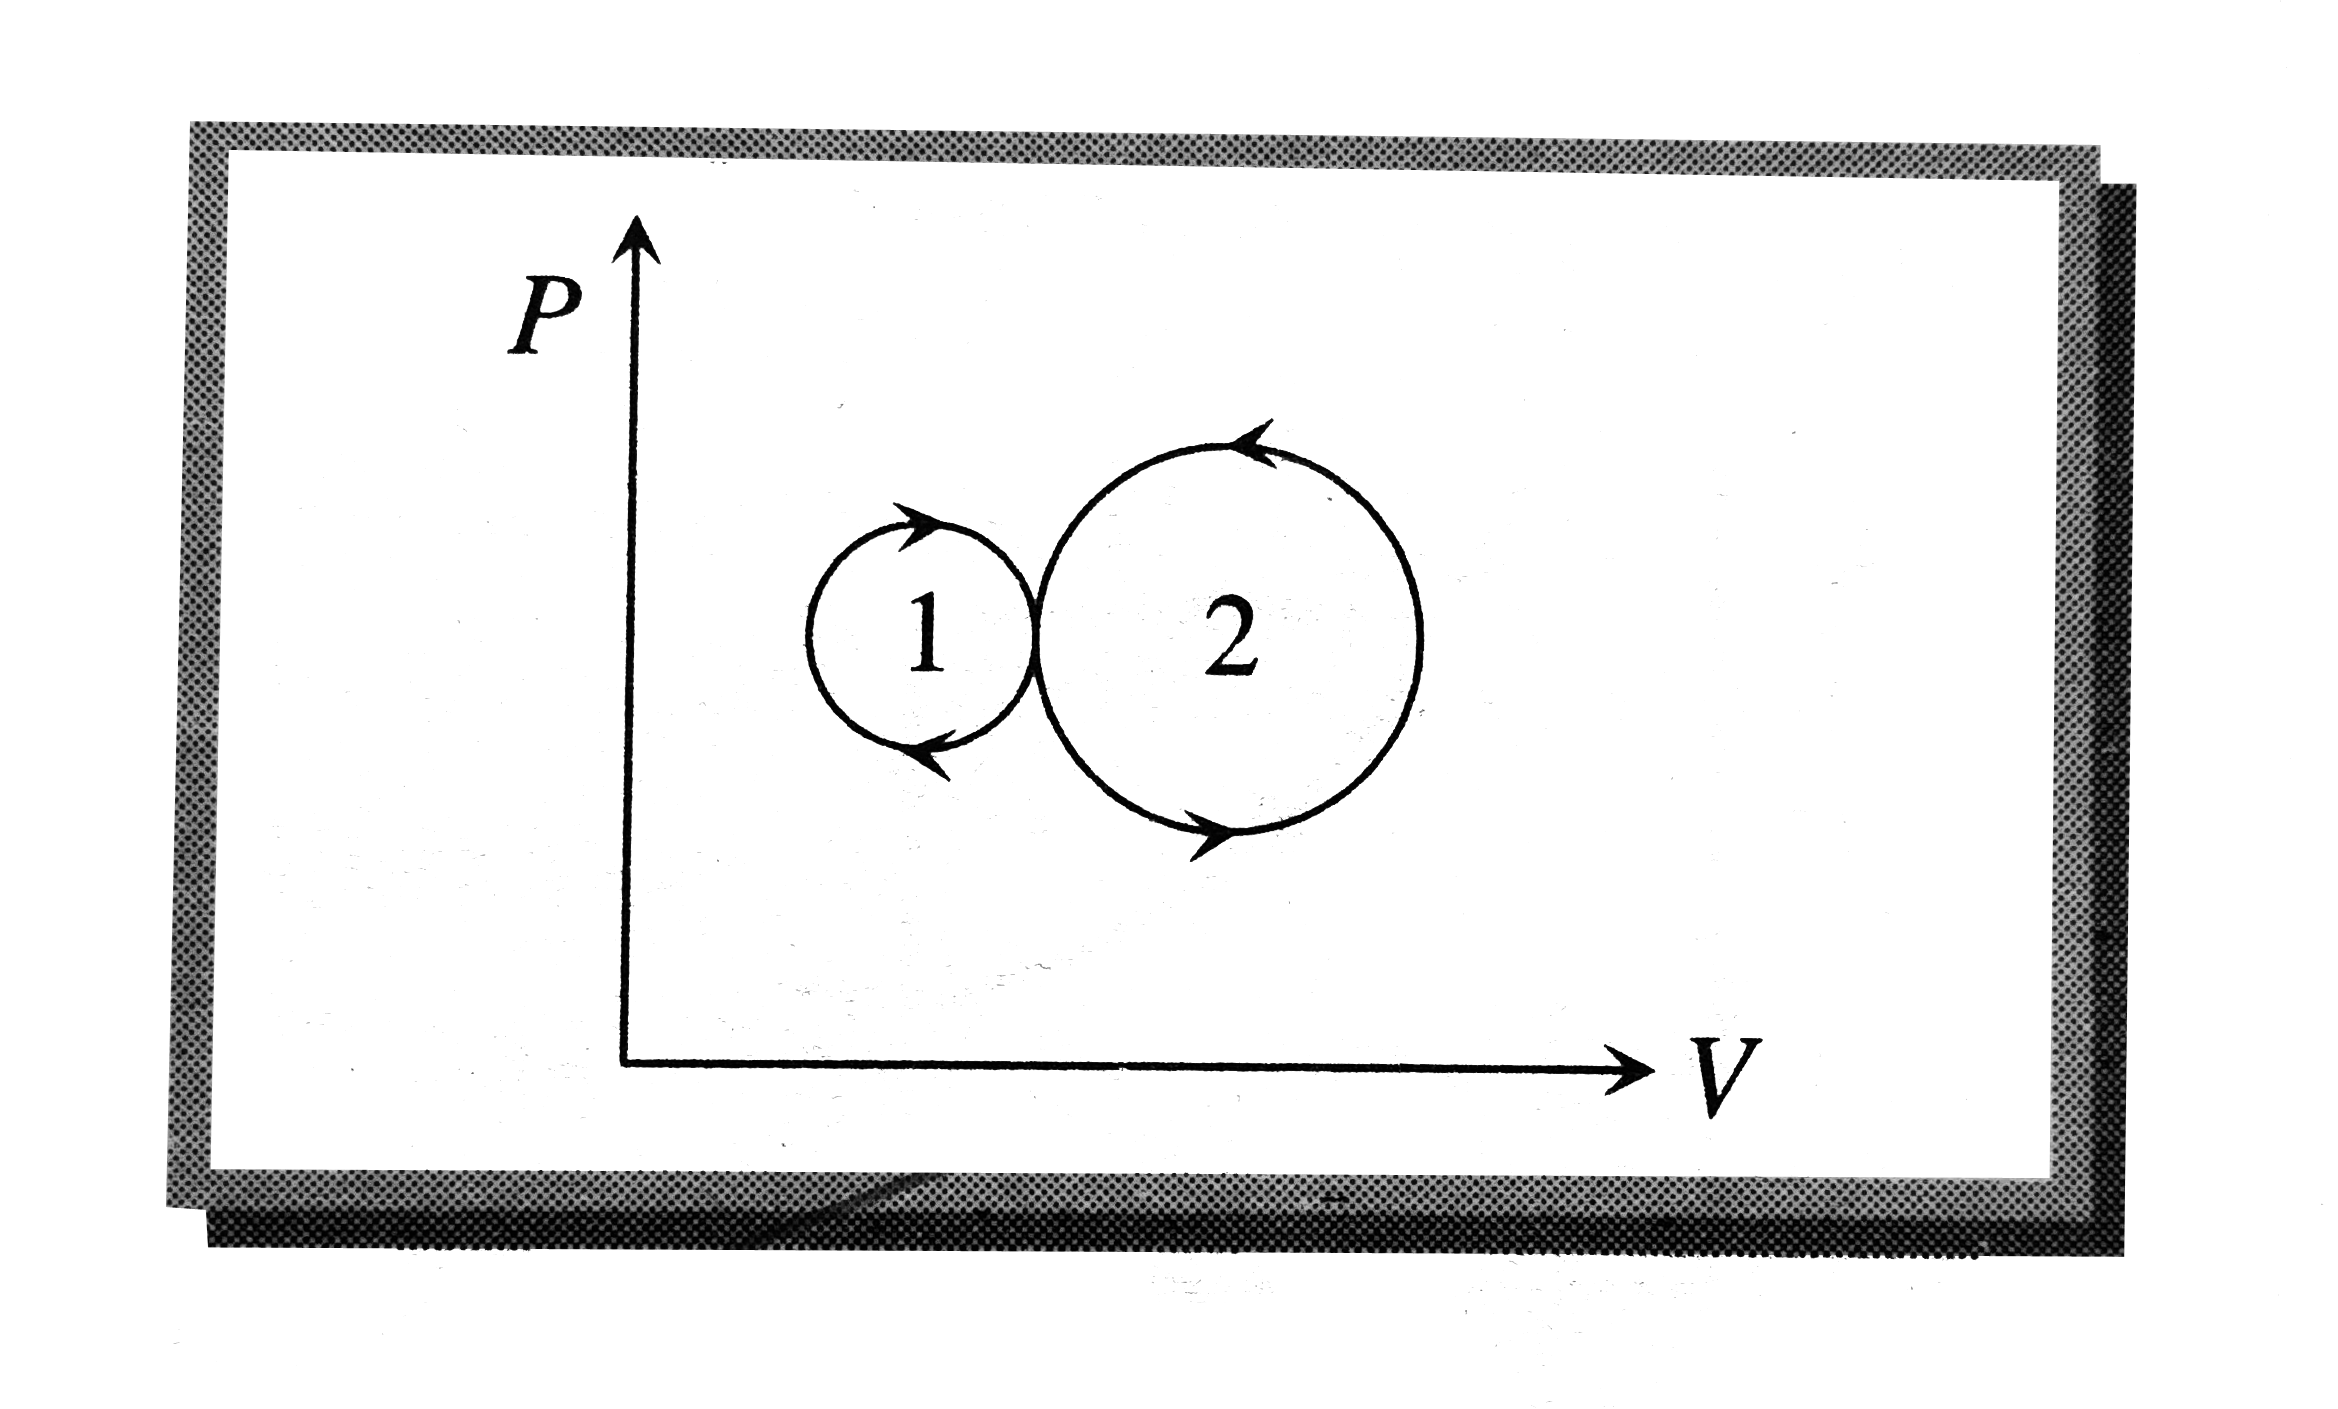
The indicator diagrams representing minimum and maximum amounts of work done are respectively
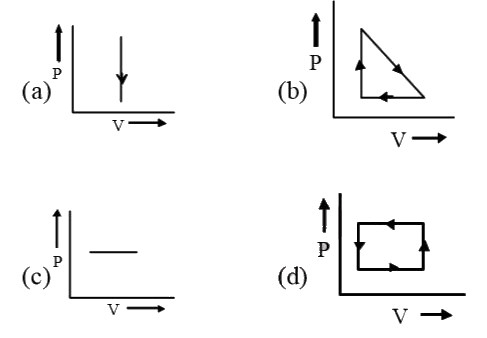
A
c and a
B
a and c
C
b and a
D
d and b
Text Solution
The correct Answer is:B
|
Topper's Solved these Questions
- ThermodynamicsBOOK - MOTIONCHAPTER - ThermodynamicsEXERCISE - EXERCISE - 2
40 Videos
- ThermodynamicsBOOK - MOTIONCHAPTER - ThermodynamicsEXERCISE - EXERCISE - 3 SECTION - A
49 Videos
- ThermodynamicsBOOK - MOTIONCHAPTER - ThermodynamicsEXERCISE - Solved Example
10 Videos
- SURFACE TENSION & VISCOSITY BOOK - MOTIONCHAPTER - SURFACE TENSION & VISCOSITY EXERCISE - Exercise - 4 | Level-II Previous Year | JEE Advanced
12 Videos
- UNIT & DIMENSIONSBOOK - MOTIONCHAPTER - UNIT & DIMENSIONSEXERCISE - Exercise - 4 (Level - II) (PREVIOUS YEAR JEE ADVANCED)
10 Videos
Similar Questions
Knowledge Check
What is the maximum amount of work done in 10 s by a 20 kW engine?
A20 KJB200 KJC25 KJD2 KJThe portion AB of the indicator diagram representing the state of matter denotes
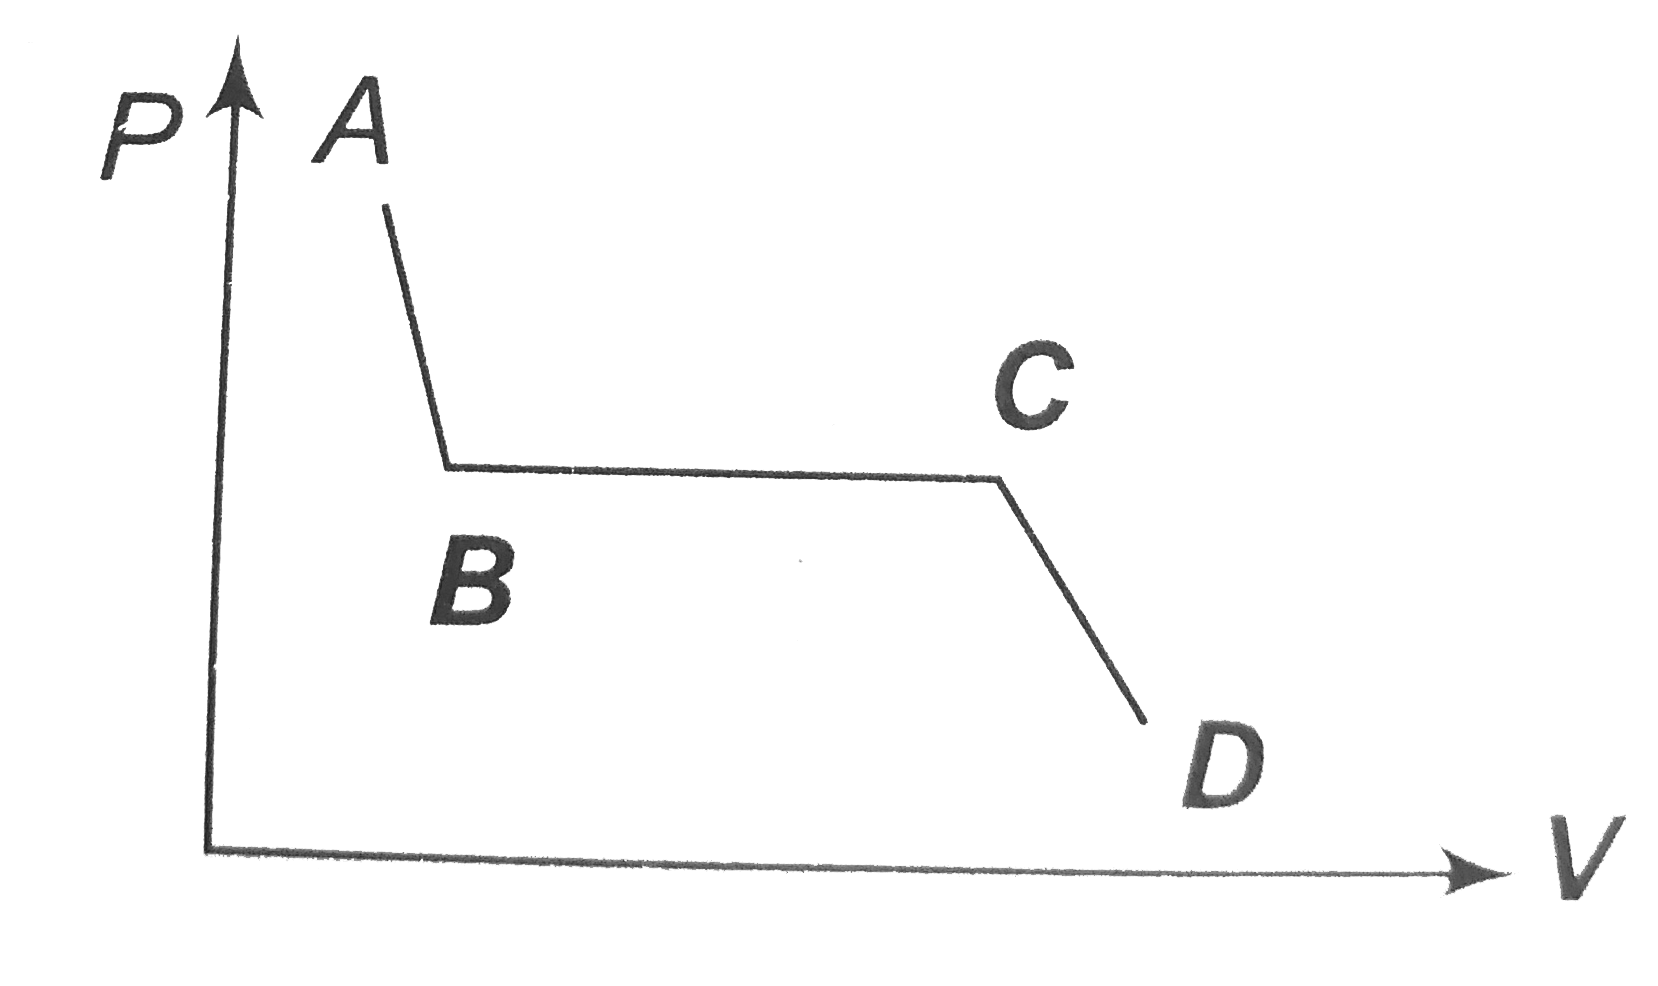 AThe liquid state of matterBGaseous state of matterCChange from liquid to gaseous stateDChange from gaseous state to liquid state
An ideal gas undergoes a cyclic process whose indicator diagram is as shown in the figure. Find the work done by the gas in 1 complete cycle.
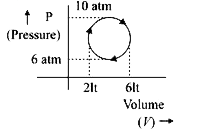 A4π lt-atmB16lt - atmC8π lt - atmD16π lt - atm
An ideal gas undergoes a cyclic process whose indicator diagram is as shown in the figure. Find the work done by the gas in 1 complete cycle.

View SolutionIn the following indicator diagram, the net amount of work done will be
View SolutionIdentical cubes each of mass 'm' and side T' are on the horizontal surface.Then the minimum amount of work done to arrange them one on the other is
View SolutionIn the following indicator diagram, the net amount of work done will be

View SolutionIn the indicator diagram shown,
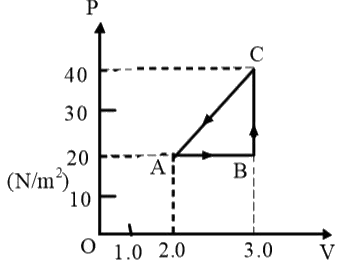 In the above problem work done along path BC is-
View Solution

