The following diagram represents the (p-V) changes of gas. Thus, total work done is:
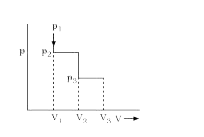
P2(V2−V1)+P3(V3−V2)
P1(V2−V1)+P3(V3−V2)
P2(V3−V1)+P3(V2−V1)
P2(V3−V2)+P3(V2−V1)
The correct Answer is:A
|w|=P2(V2−V1)+P3(V3−V2)
Topper's Solved these Questions
- THERMODYNAMICSBook:VMC MODULES ENGLISHChapter:THERMODYNAMICSExercise:LEVEL-2
Explore 50 Videos
- THERMODYNAMICSBook:VMC MODULES ENGLISHChapter:THERMODYNAMICSExercise:LEVEL-2 (NUMERICAL VALUE TYPE)
Explore 15 Videos
- THERMODYNAMICSBook:VMC MODULES ENGLISHChapter:THERMODYNAMICSExercise:LEVEL-0 (LONG ANSWER TYPE (5 MARKS))
Explore 6 Videos
- THERMOCHEMISTRYBook:VMC MODULES ENGLISHChapter:THERMOCHEMISTRYExercise:JEE ADVANCED (ARCHIVE)
Explore 31 Videos
- THERMODYNAMICS & THERMOCHEMISTRYBook:VMC MODULES ENGLISHChapter:THERMODYNAMICS & THERMOCHEMISTRYExercise:Impeccable
Explore 48 Videos
Similar Questions
An ideal gas expands isothermally from volume V1 to V2 and is then compressed to original volume V1 adiabatically. Initialy pressure is P1 and final pressure is P3. The total work done is W. Then
View SolutionAn ideal gas expands isothermally from volume V1 to V2 and is then compressed to original volume V1 adiabatically. Initialy pressure is P1 and final pressure is P3. The total work done is W. Then
View Solution
Knowledge Check
Which of the following P-V diagram represent the graph of isometric process?
A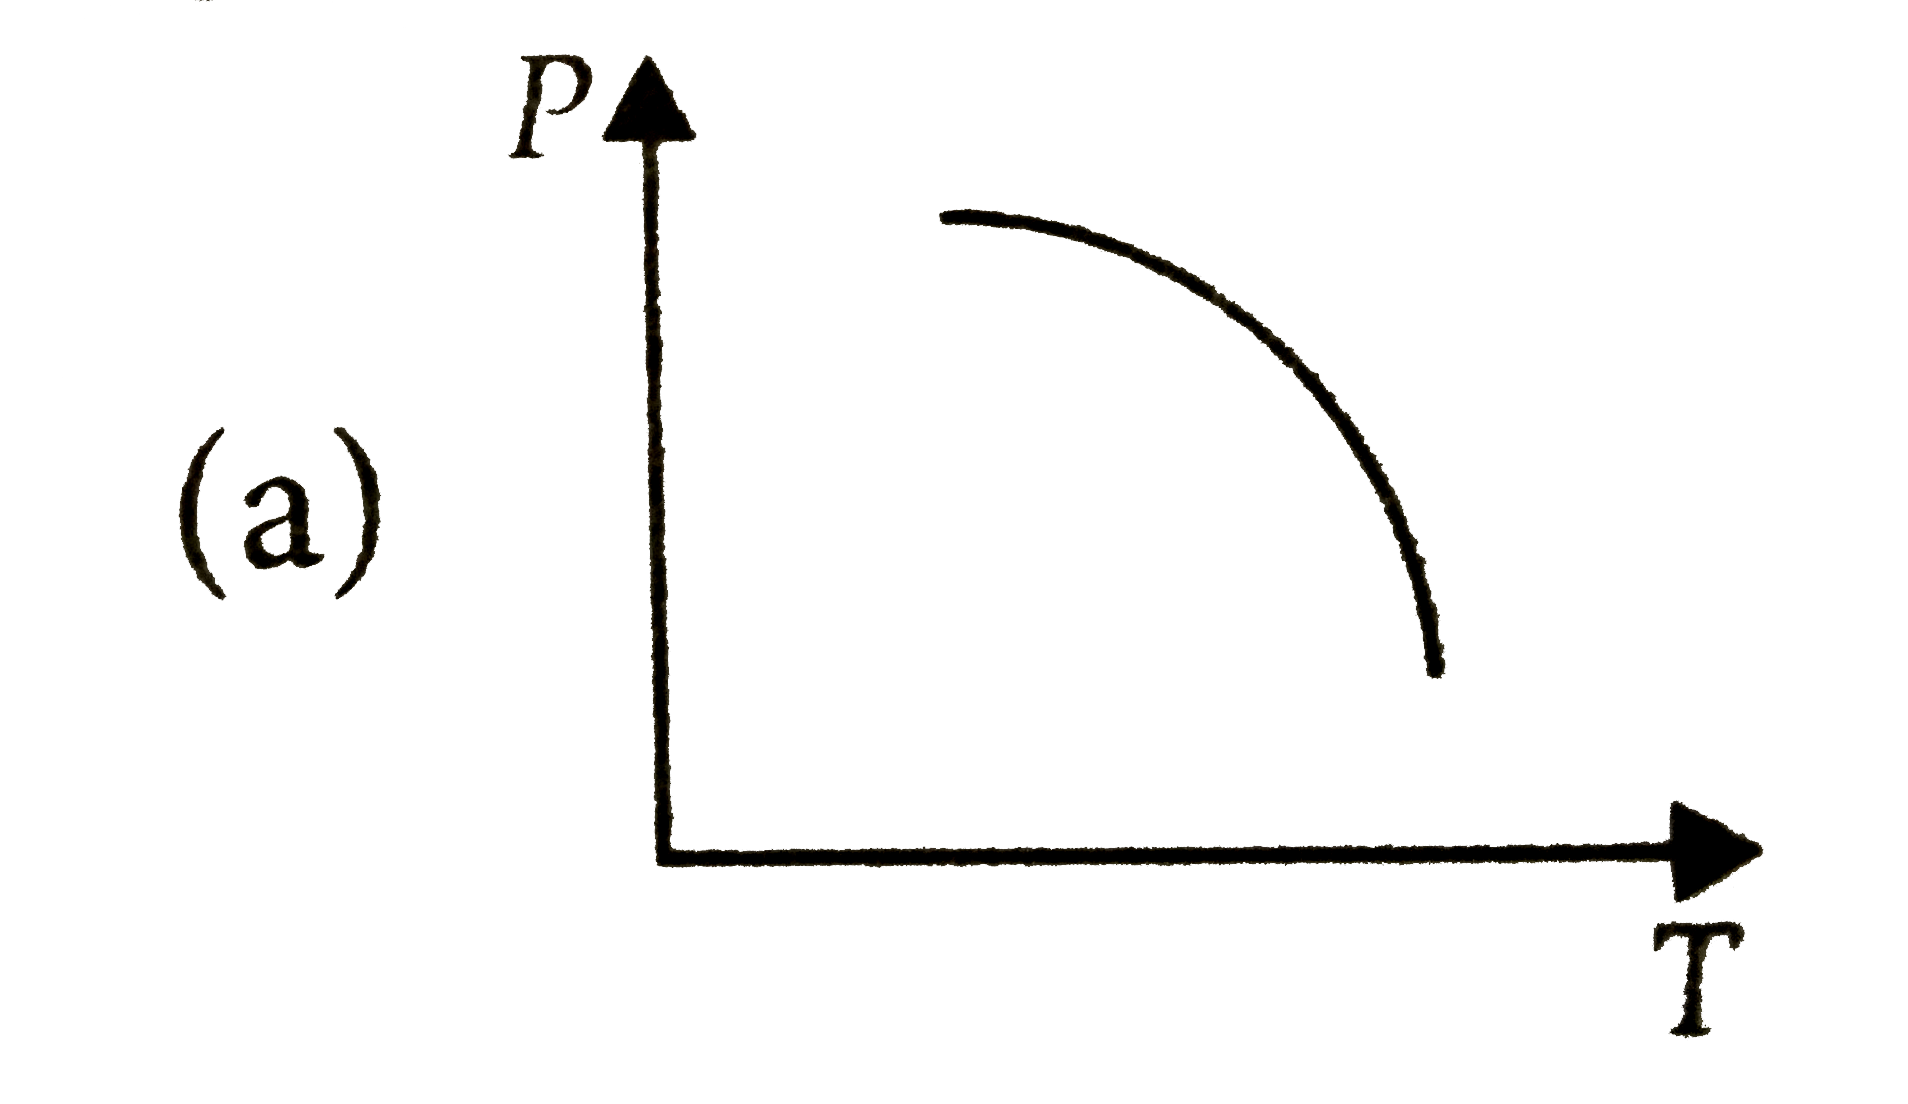 B
B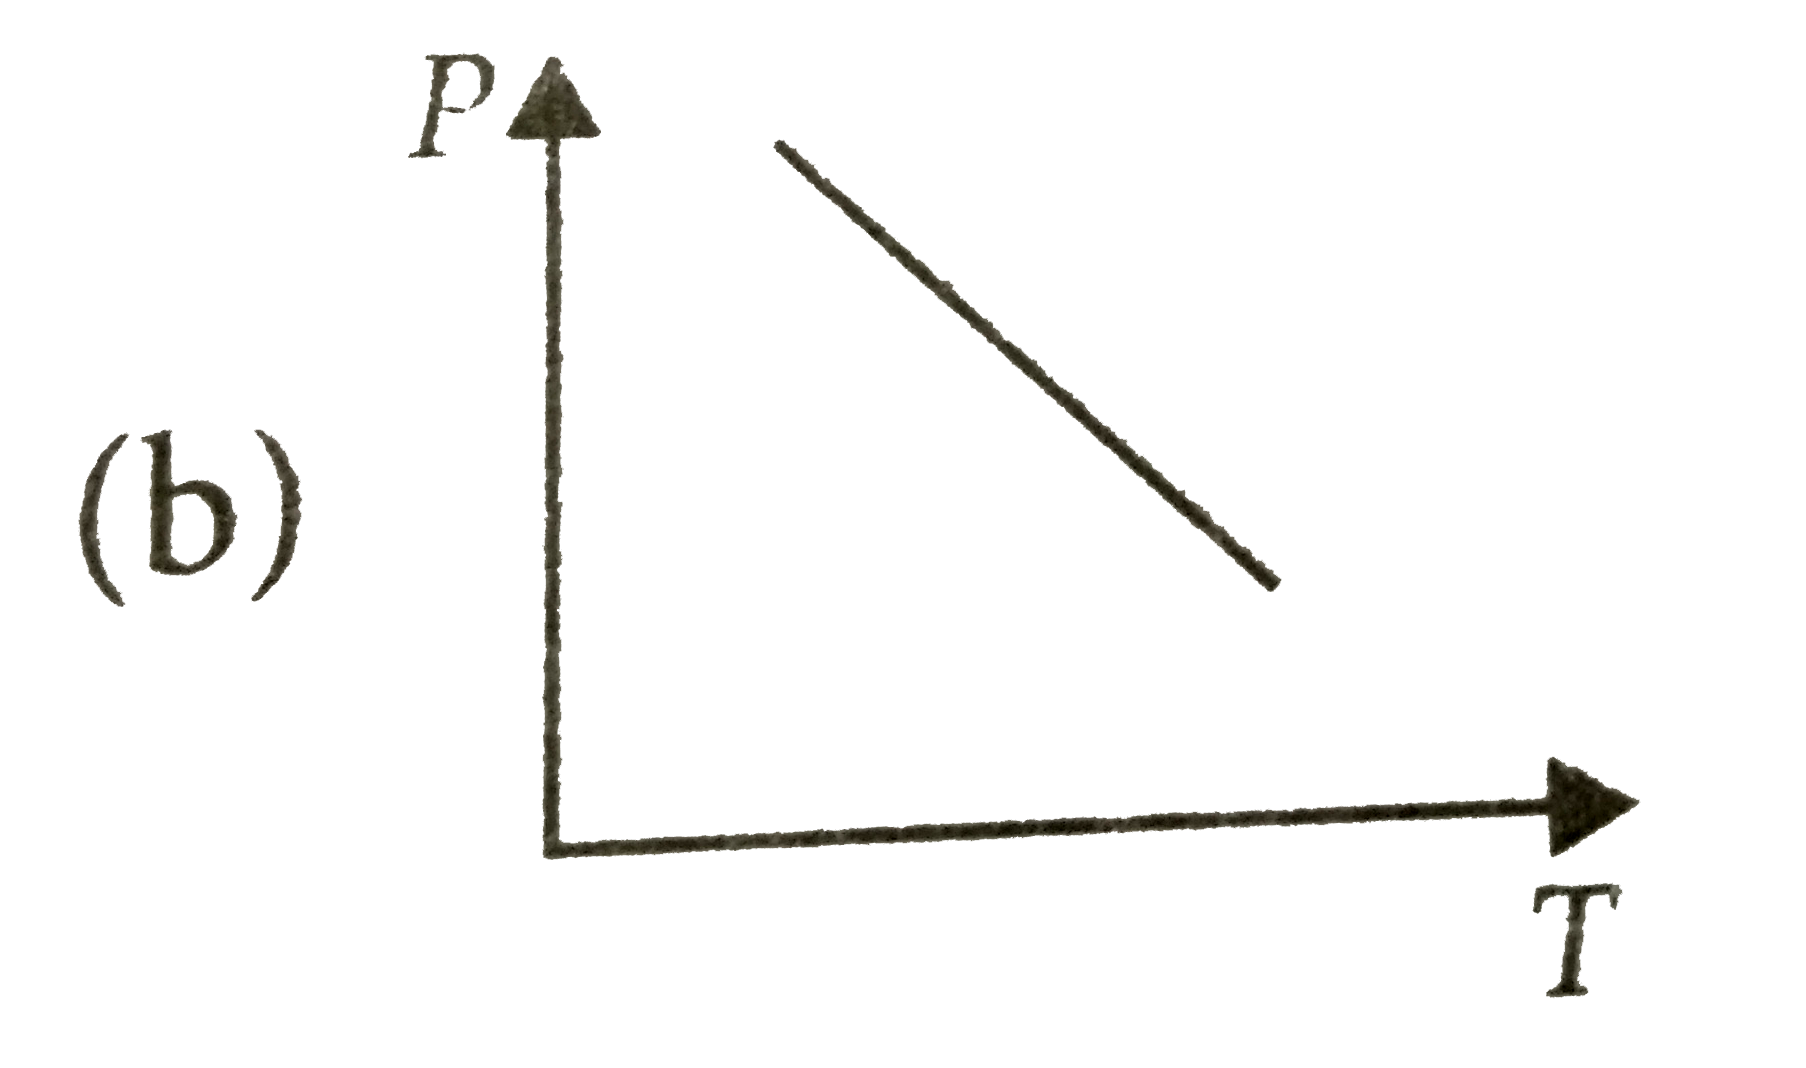 C
C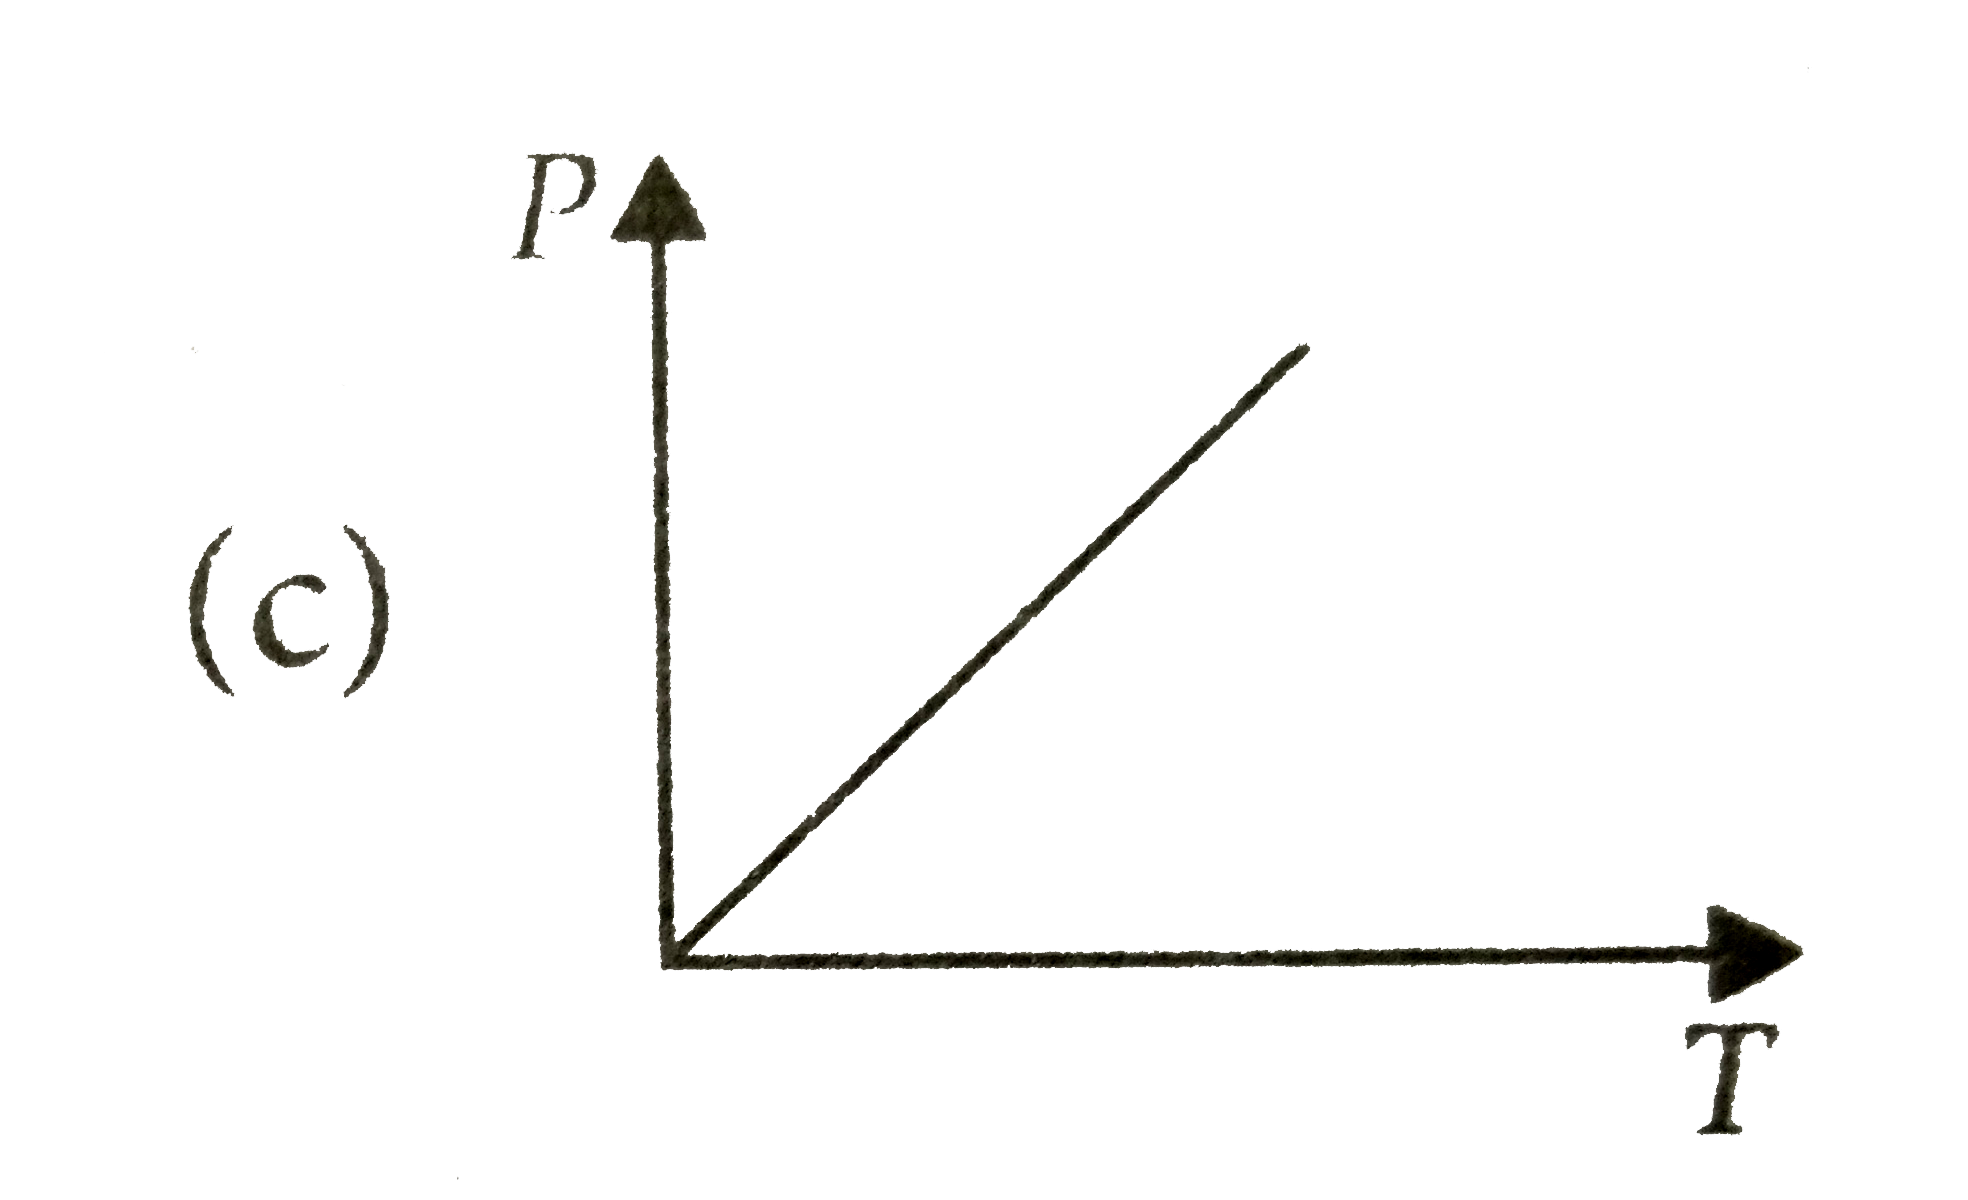 D
D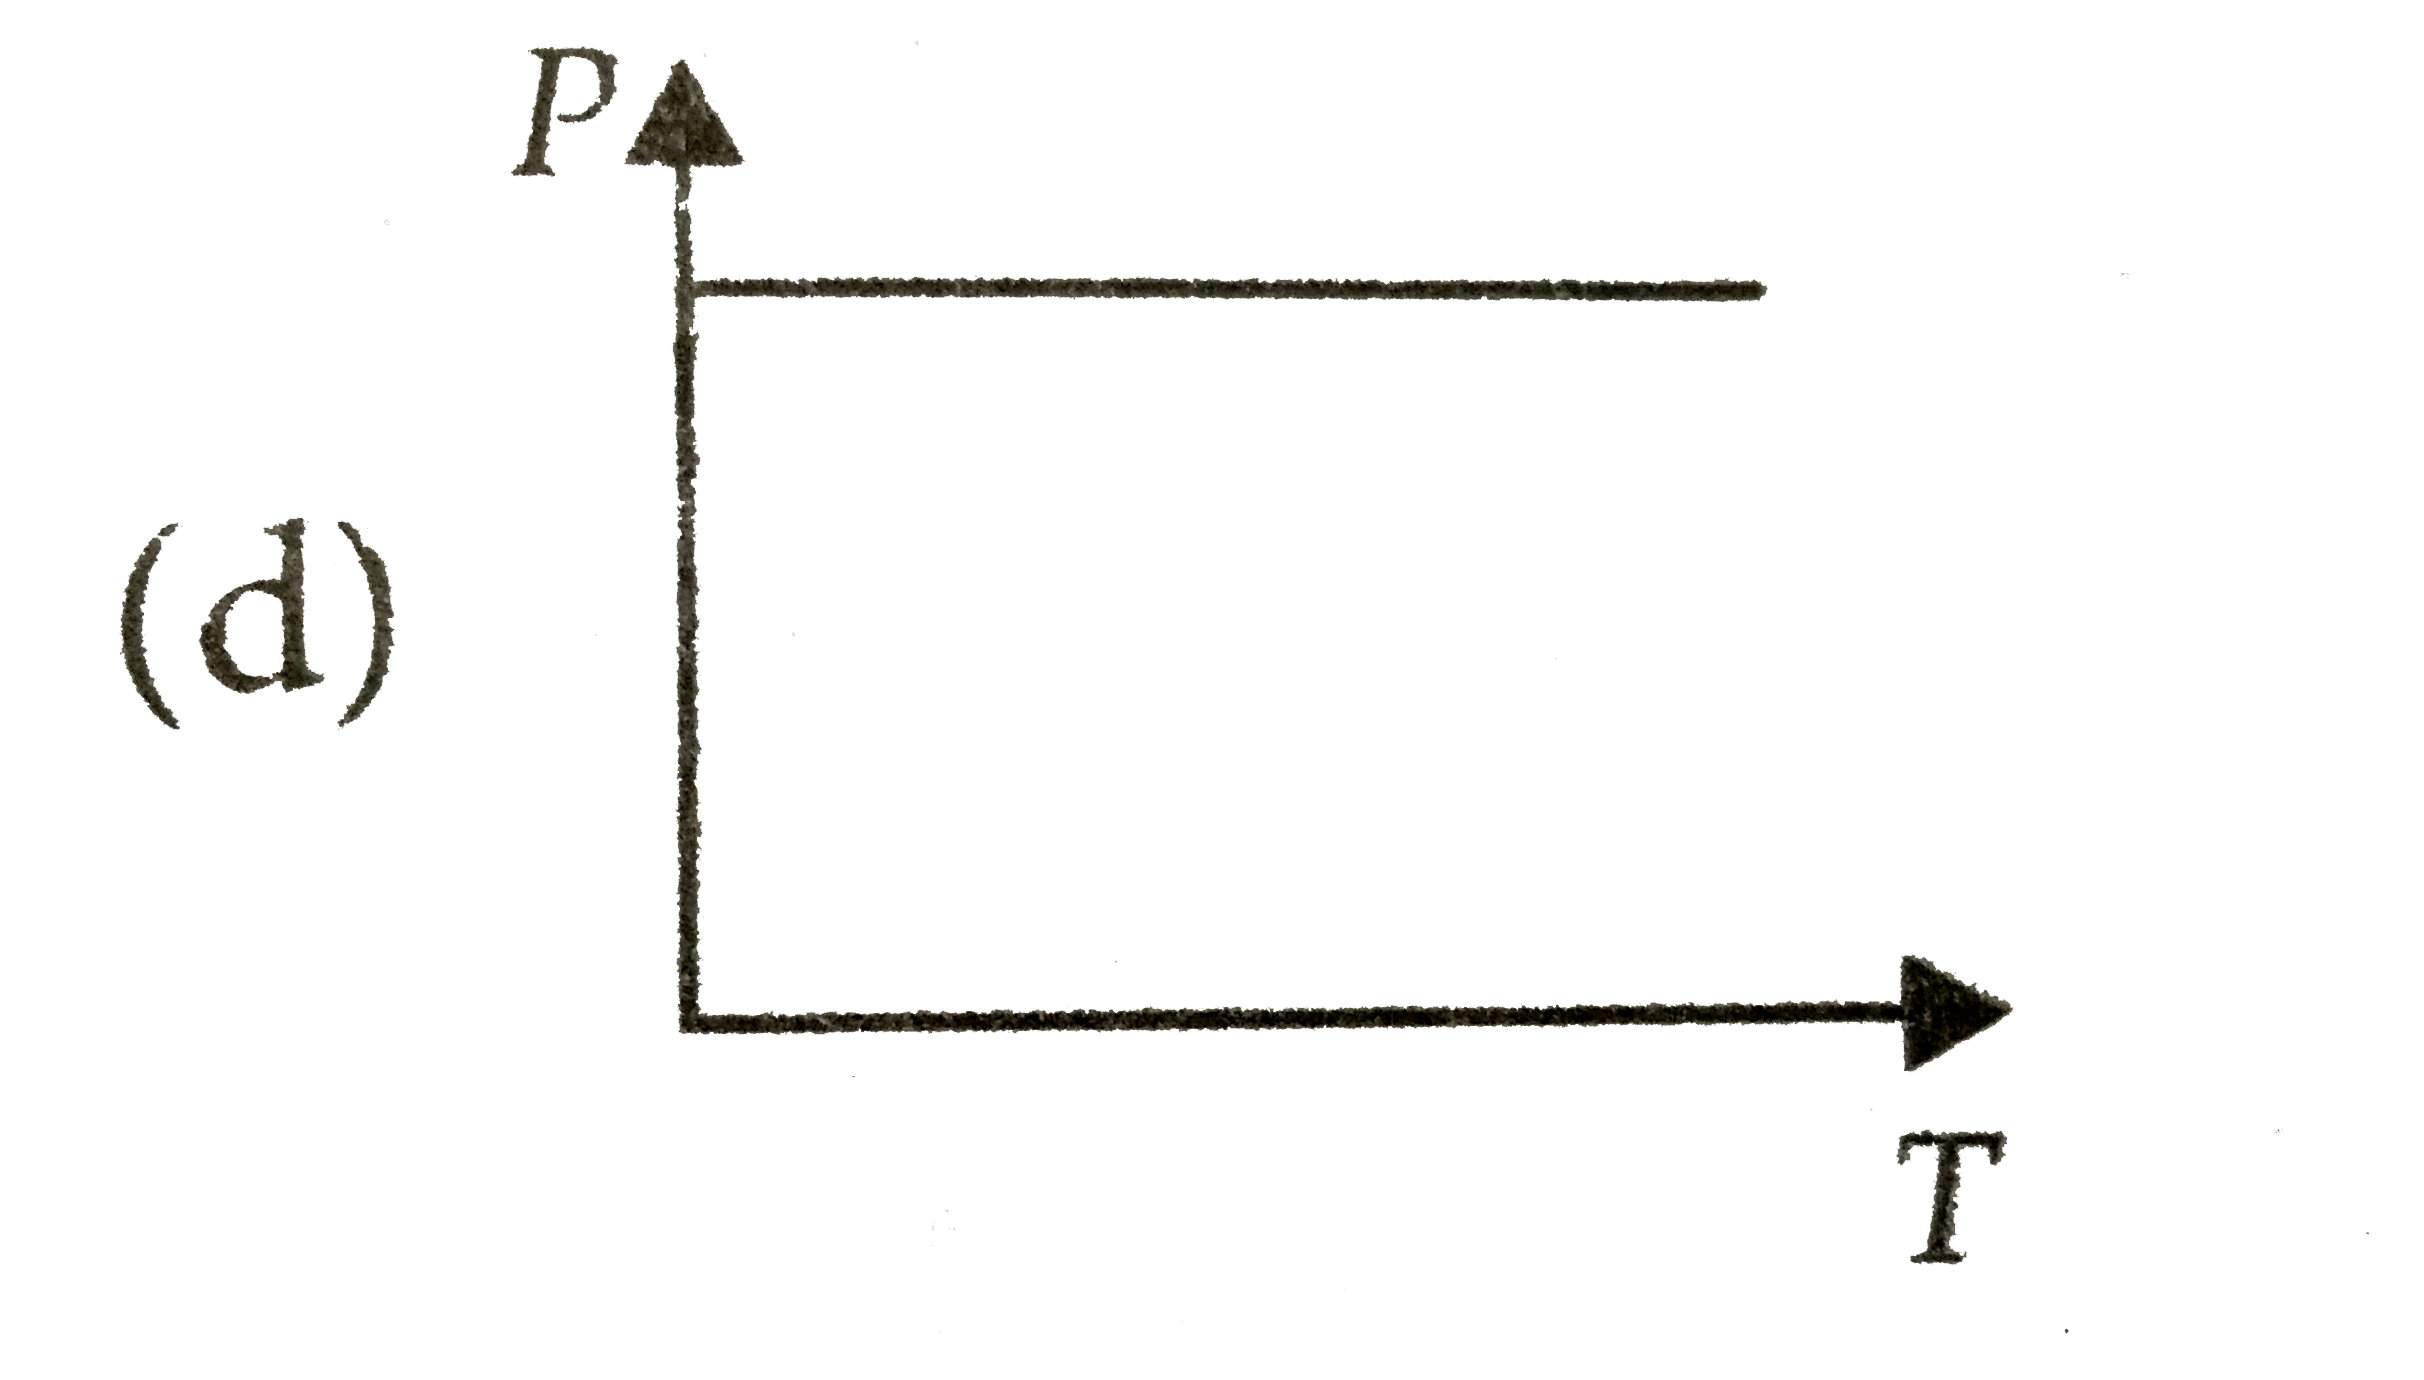
Consider p-V diagram for an ideal gas shown in figure.
Out of the following diagrams, which figure represents the T−p diagram ?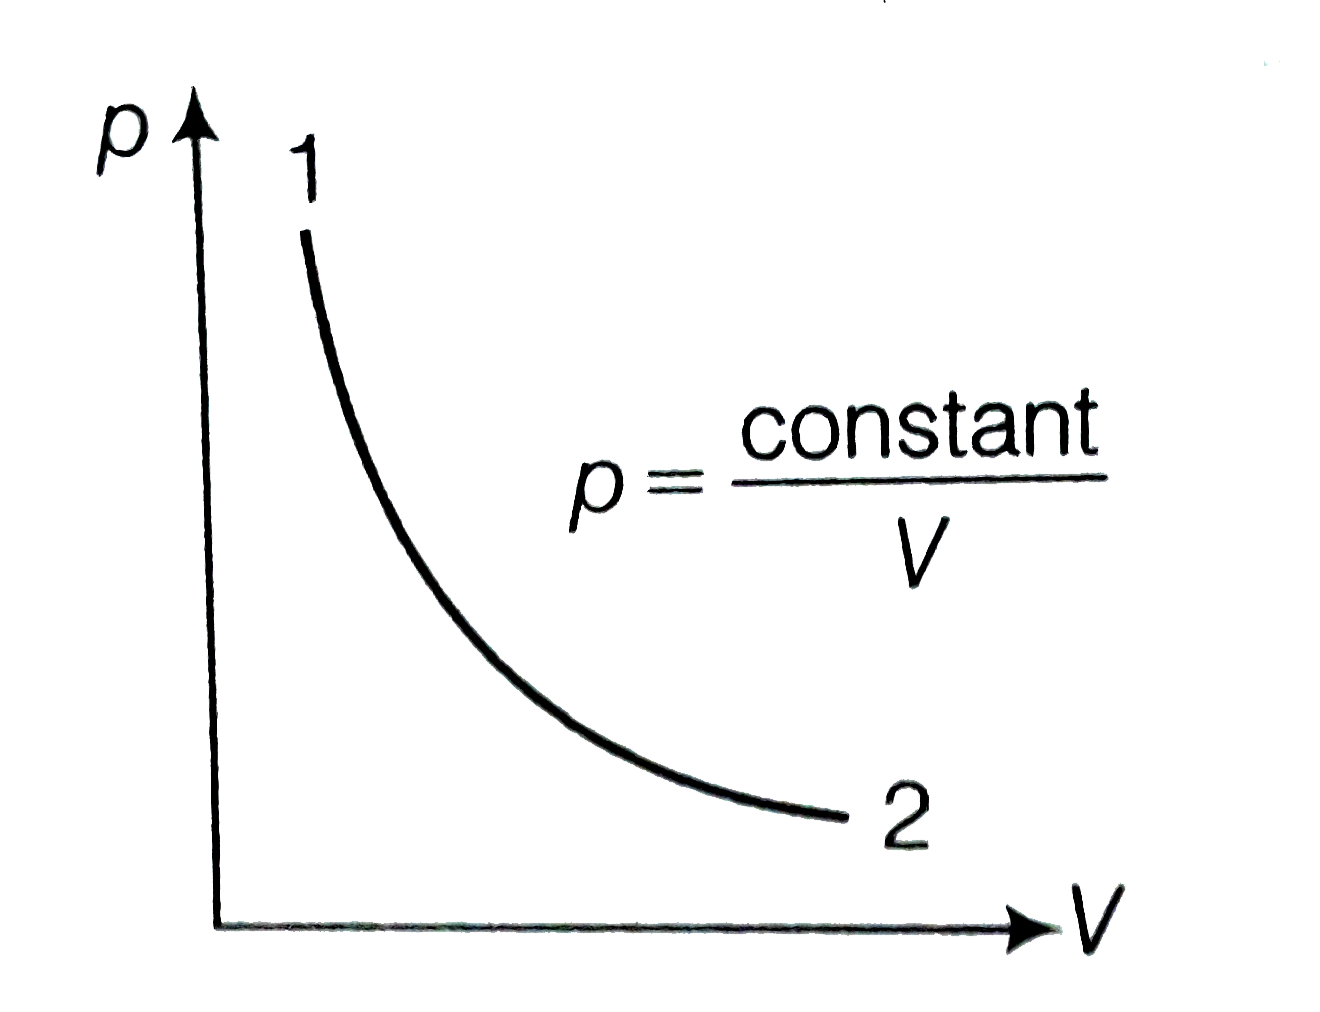
(i)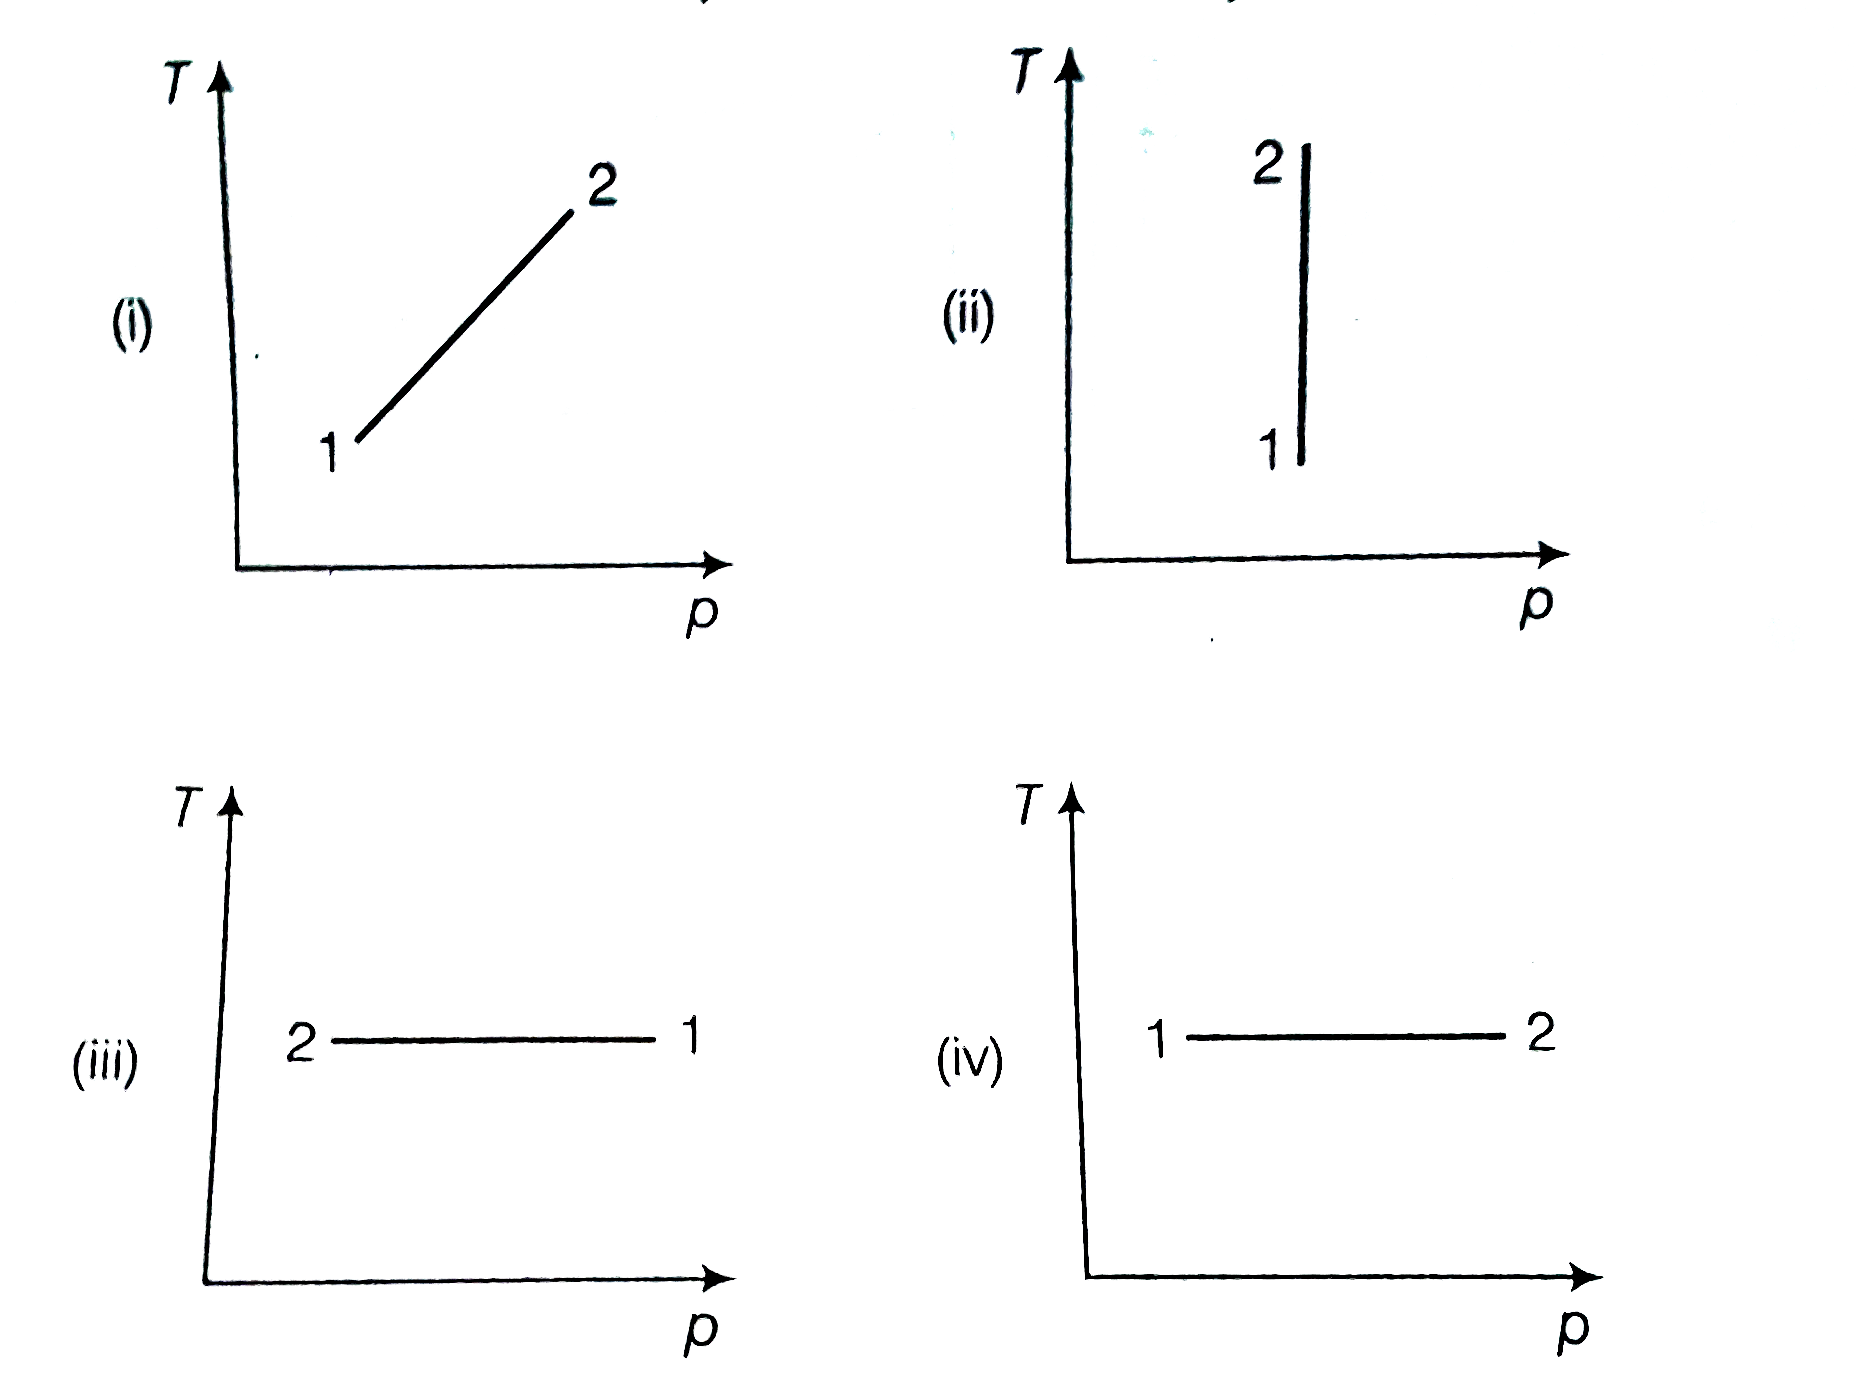 A(iv)B(ii)C(iii)D(i)
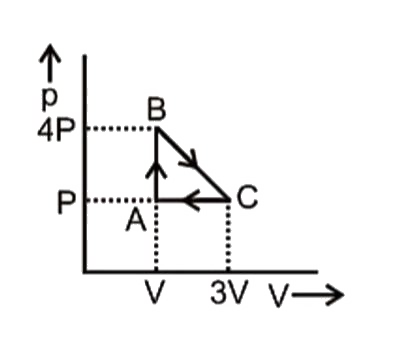
An ideal gas is taken around the cycle ABCA as shown in the P-V diagram. The total work done by the gas during the cycle is
View Solution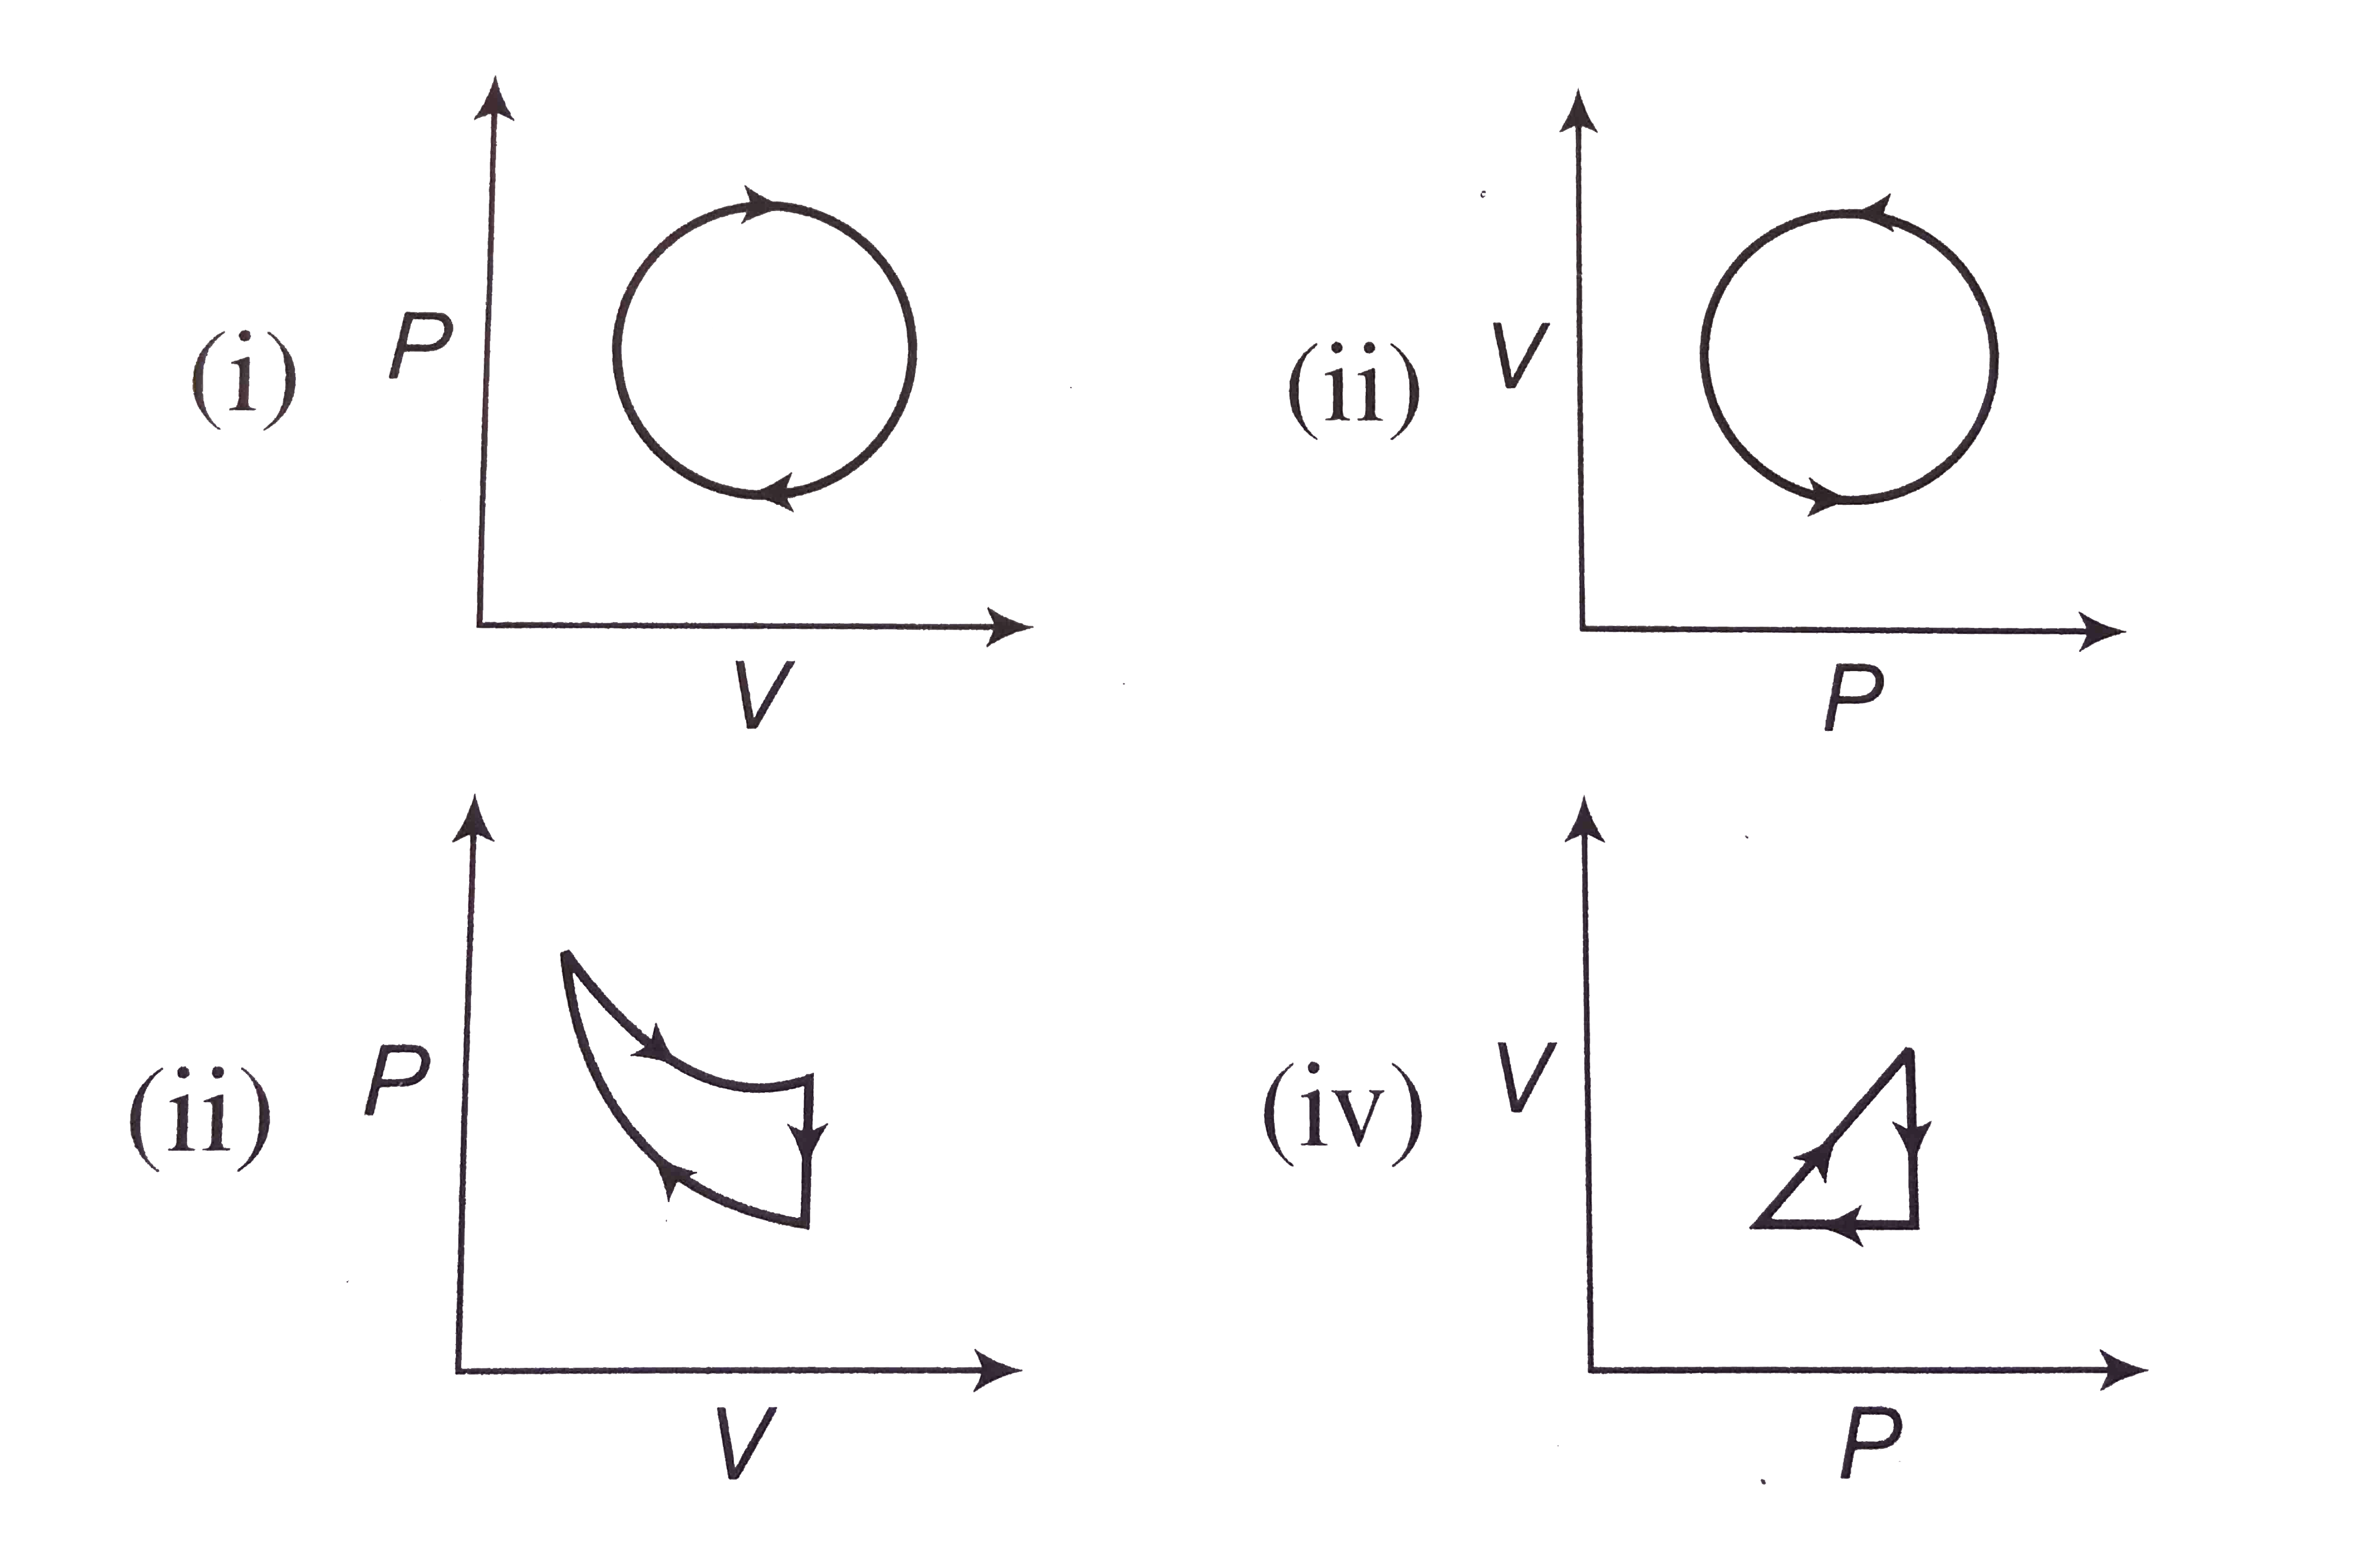
The following are the P−V diagrams for cyclic processes for a gas. In which of these processes is heat absorbed by the gas?
View SolutionThe following are the P−V diagram for cyclic process for a gas. In which of these processes, heat is not obsorbed by the gas?
View Solution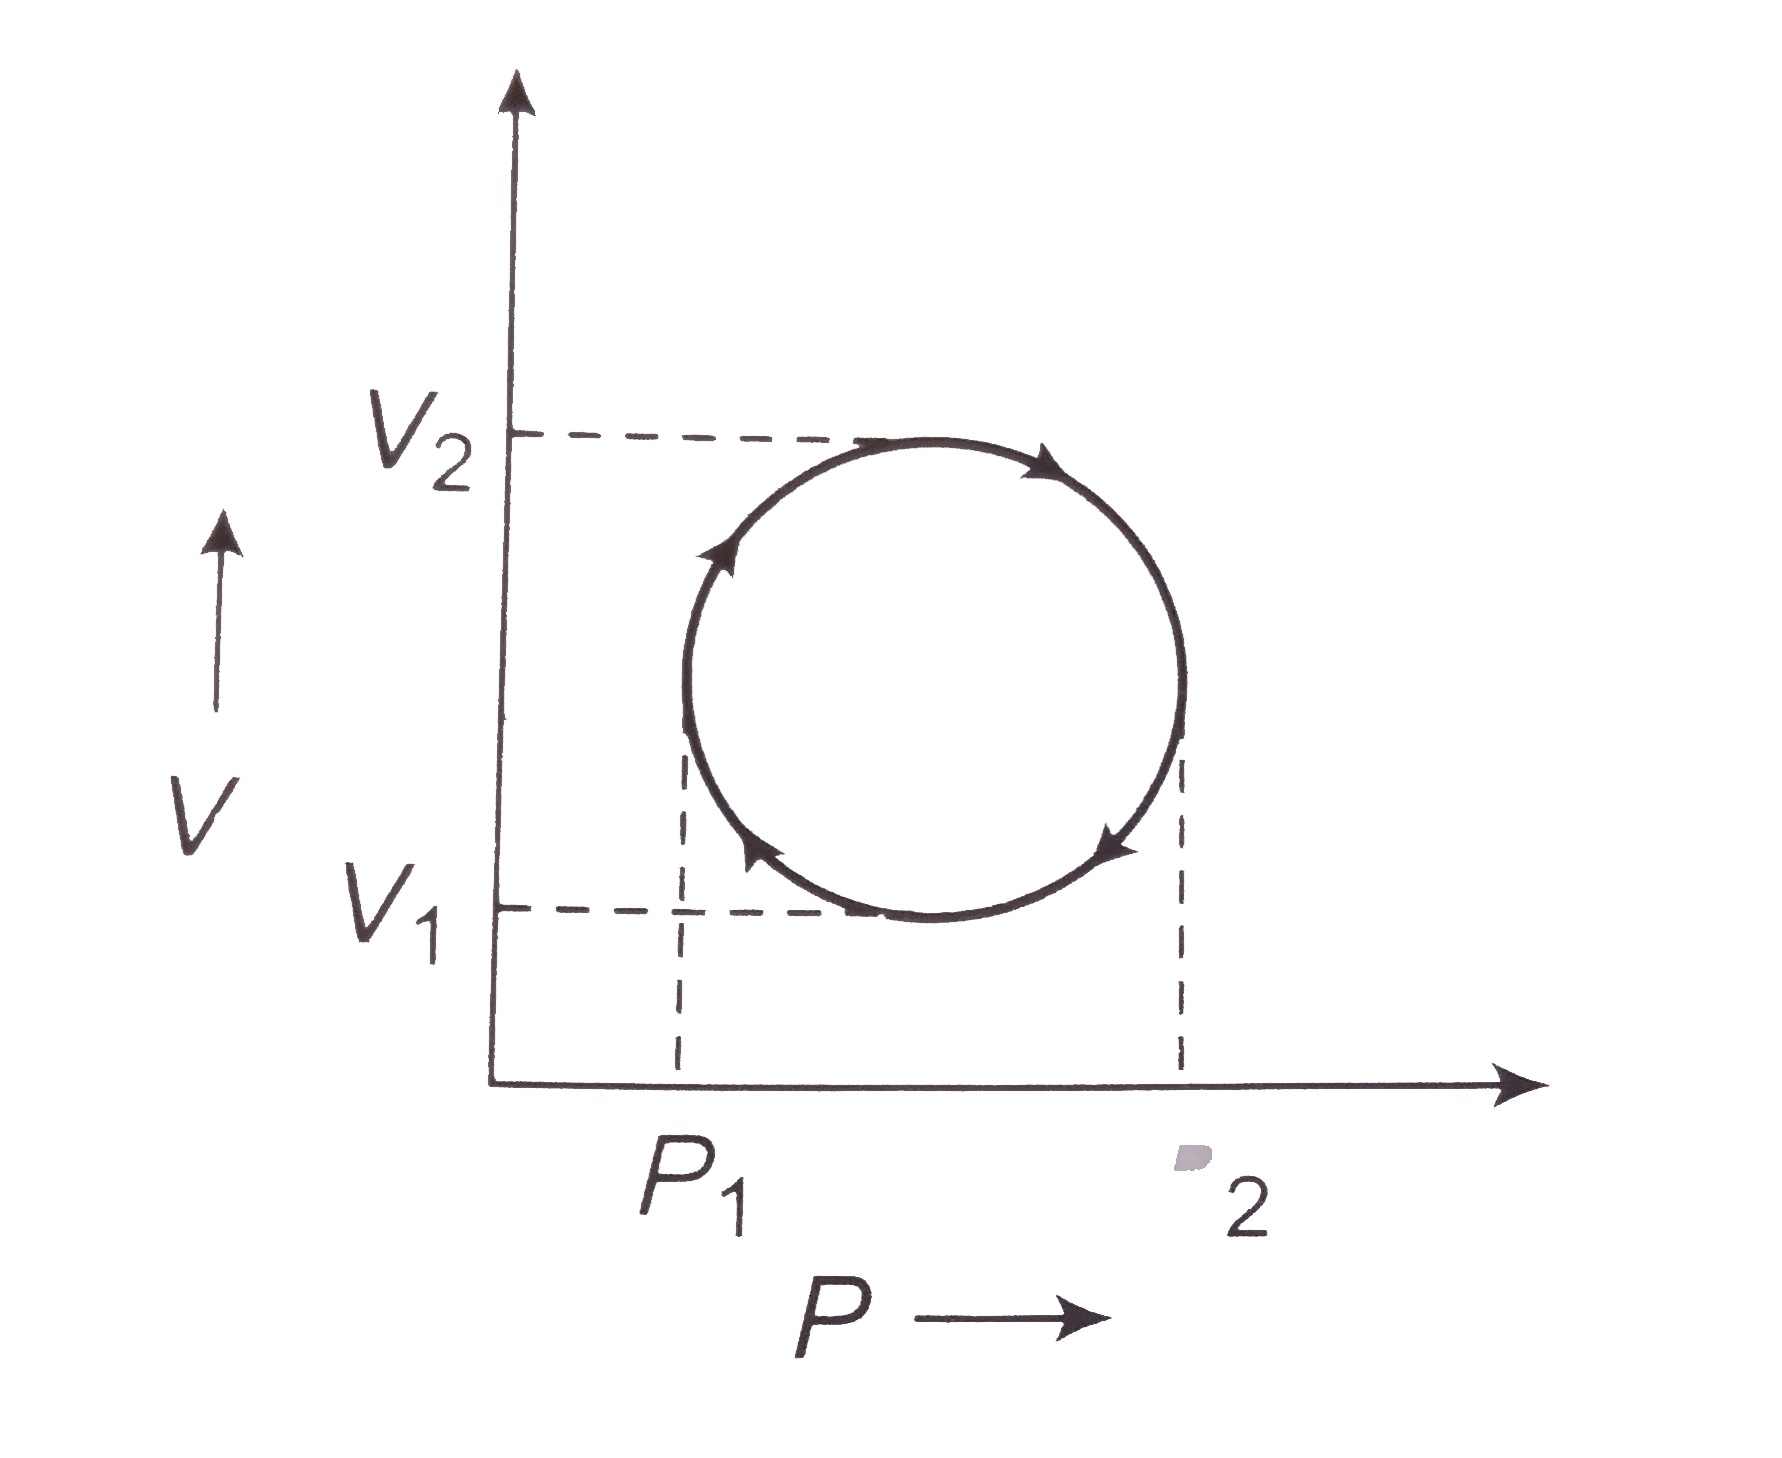
In the cyclic process shown in the V−P diagram the magnitude of the work is done is
View SolutionConsider p-V diagram for an ideal gas shown in figure.

Out of the following diagrams, which figure represents the T−p diagram ?
(i)
View SolutionThe gas constant R represents work done
View Solution