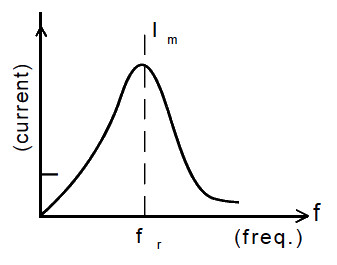
The graph shows variation of I with f for a series R-L-C network. Keeping L and C constant. If R decreases :-

a,b,c
b,c,d
c,d,a
all
The correct Answer is:A
Similar Questions
Knowledge Check
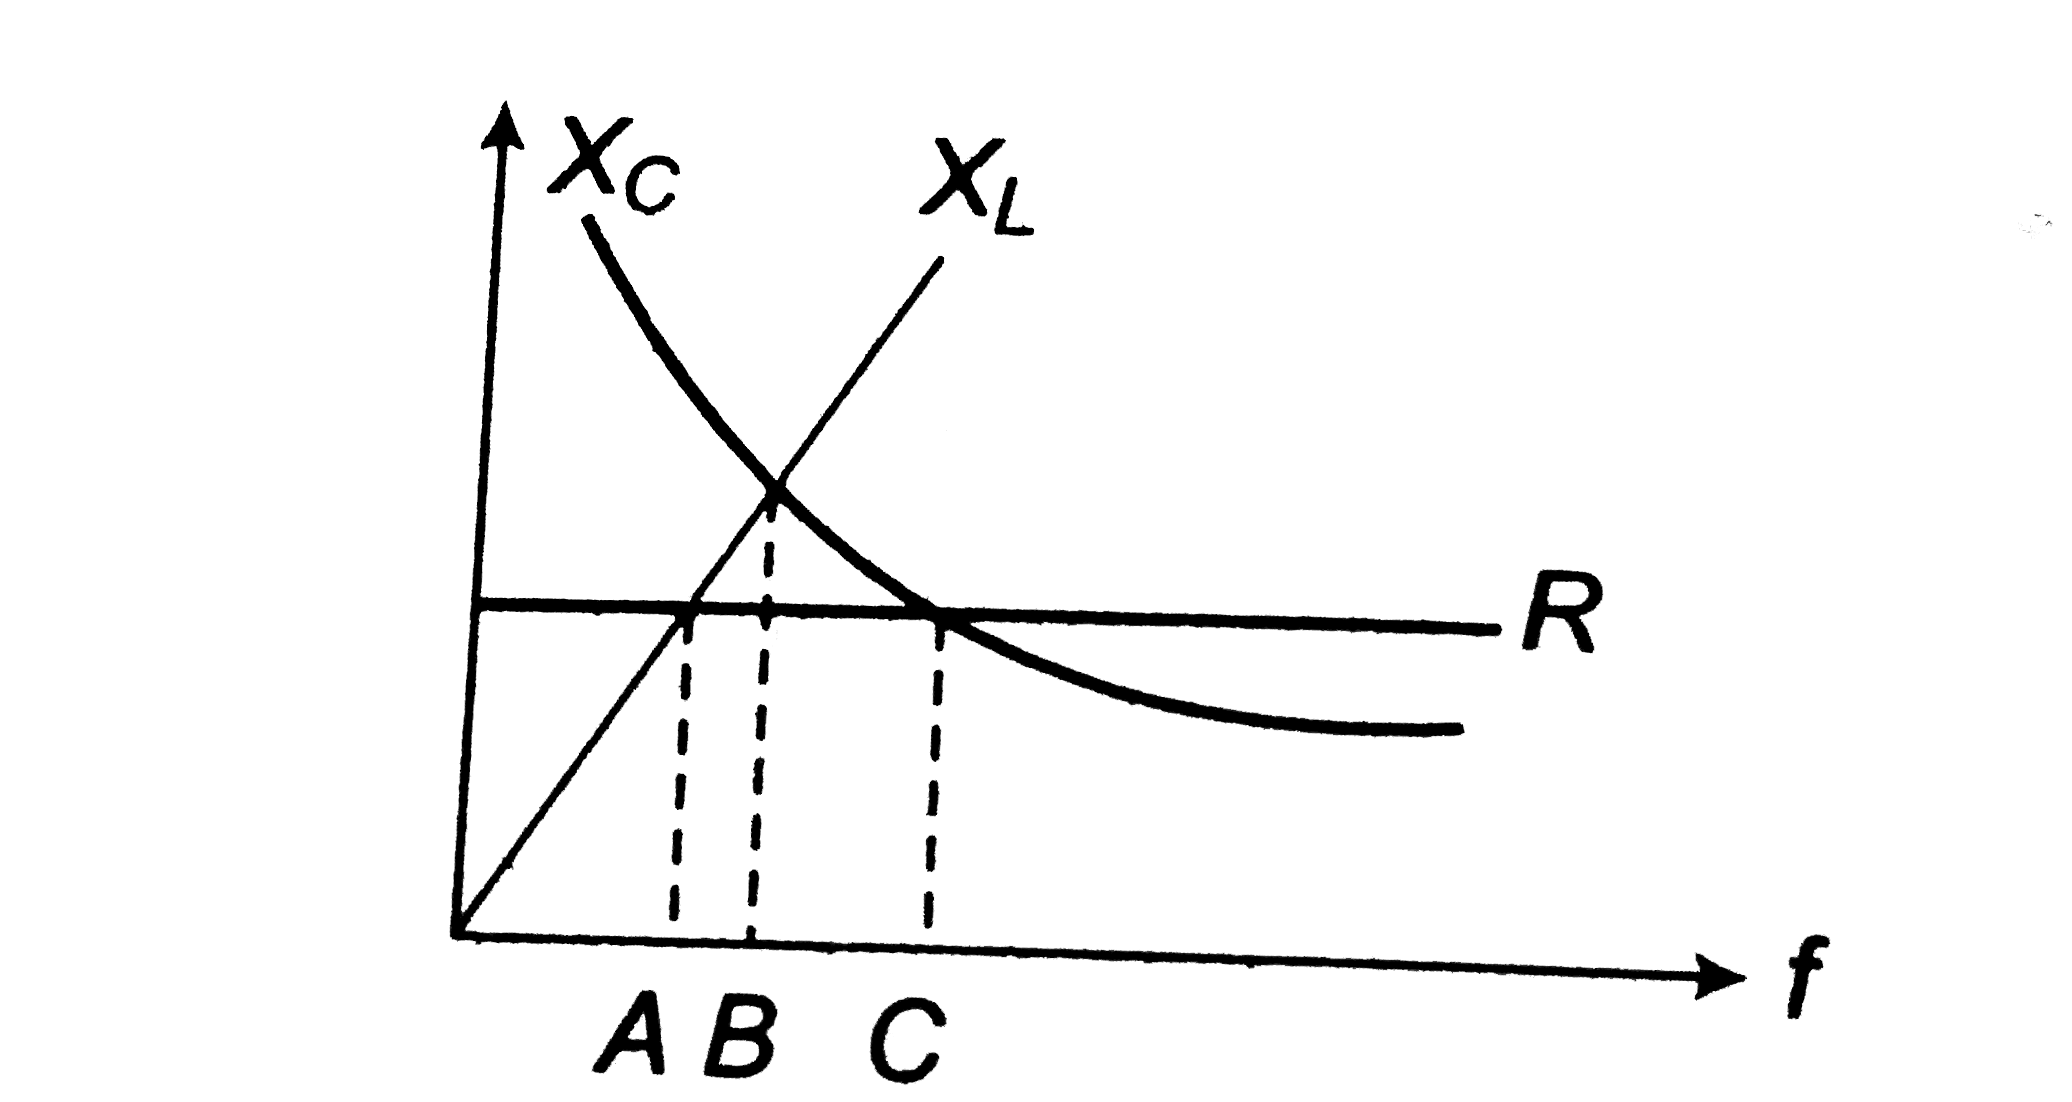
The figure shows variation of R,XL and XC with frequency f in a series L,C,R circuit. Then for what frequency point, the circuit is inductive ?
 AABBCCDAll points
The graph shows the variation of lnRv/s1T2, where R is resistance and T is temperature. Then find R as function T.
_2019_CBT5_E01_037_Q01.png) AR−R0eT02/T2BR−R0e−T2/T02CR−R0eT3/T0DR−R0e−T3/T03
AR−R0eT02/T2BR−R0e−T2/T02CR−R0eT3/T0DR−R0e−T3/T03Power factor in a series R-L-C resonant circuit is
A0.5B0.707C1D0
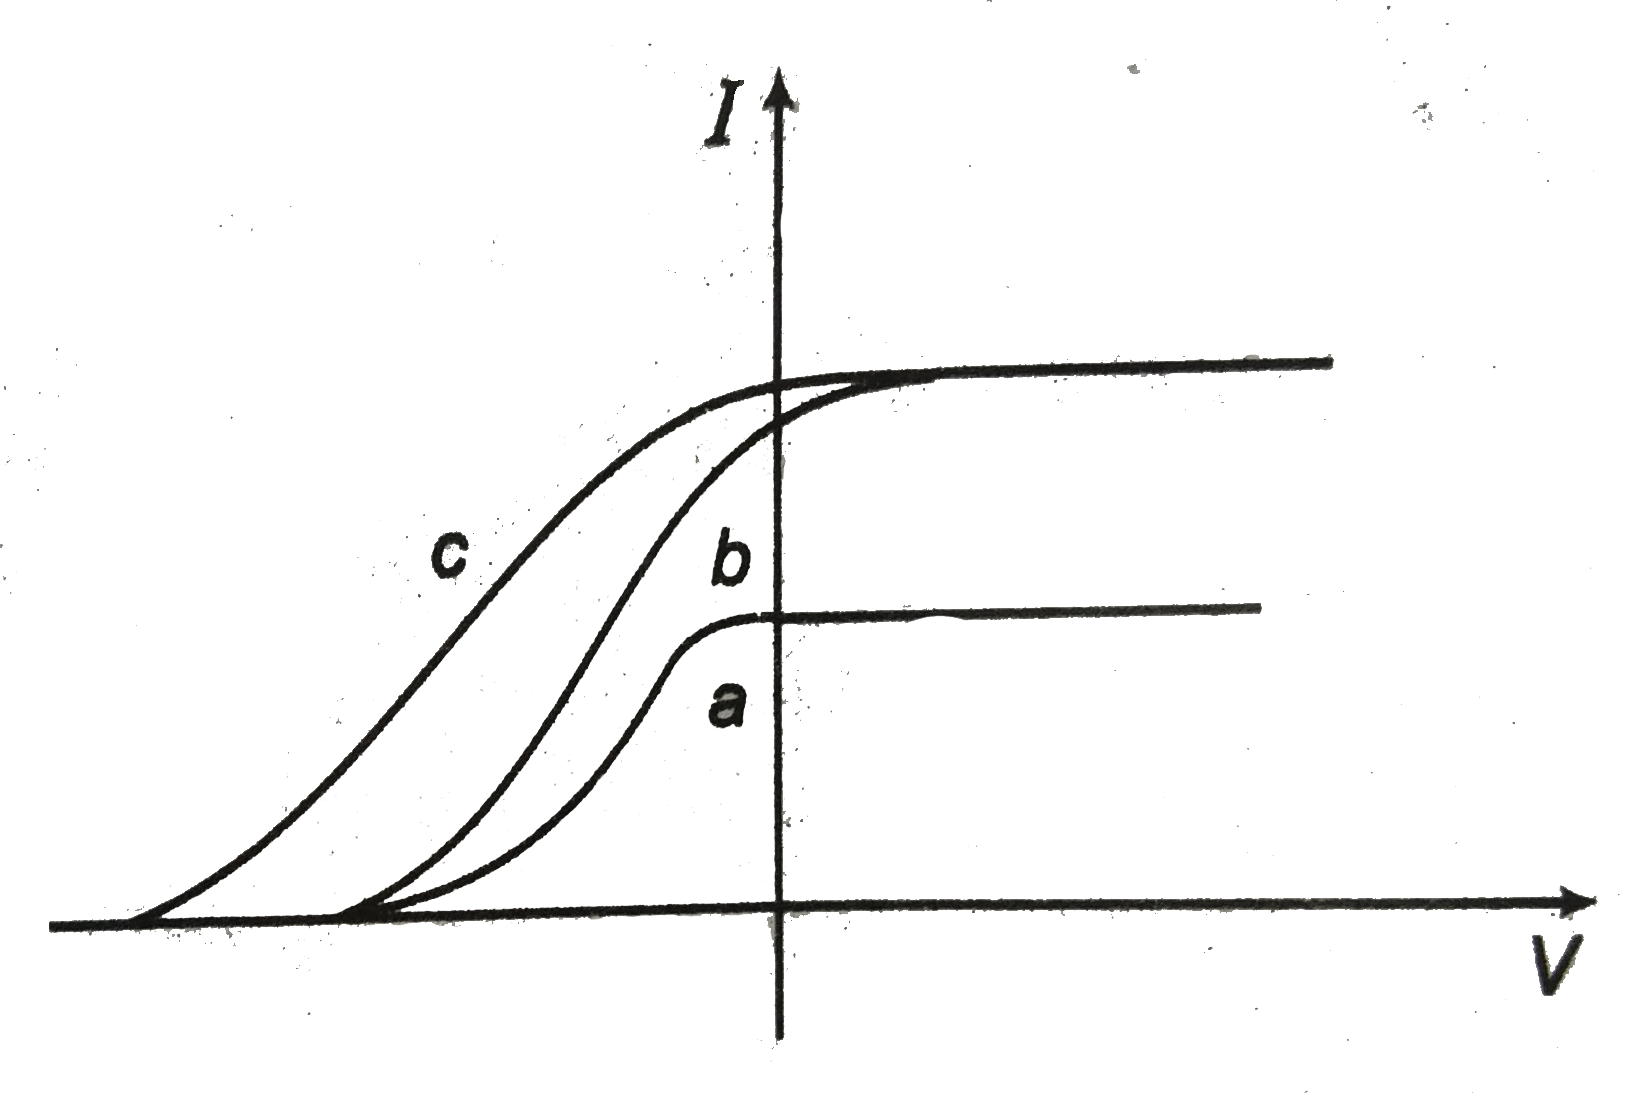
The figure shows the variation of photocurrent with anode potential for a photosensitve surface for three different radiations. Let la,lbandlc be the curves a, b and c, respectively

(a) fa=fbandla≠lb (b) fa=fcandla=lc
(c ) fa=fbandla=lb (d) fb=fcandlb=lc
View SolutionThe figure shows the variation of photocurrent with anode potential for a photosensitve surface for three different radiations. Let la,lbandlc be the curves a, b and c, respectively

(a) fa=fbandla≠lb (b) fa=fcandla=lc
(c ) fa=fbandla=lb (d) fb=fcandlb=lc
View SolutionIn the circuit shown below, the internal resistance of the cell is negligible. The distance of the slider from the left-hand end of the slide wire is l. The graph shows the variation with l of the current I in the cell.

Value of the resistance R is:
View SolutionIn the circuit shown below, the internal resistance of the cell is negligible. The distance of the slider from the left-hand end of the slide wire is l. The graph shows the variation with l of the current I in the cell.

Value of the resistance R is:
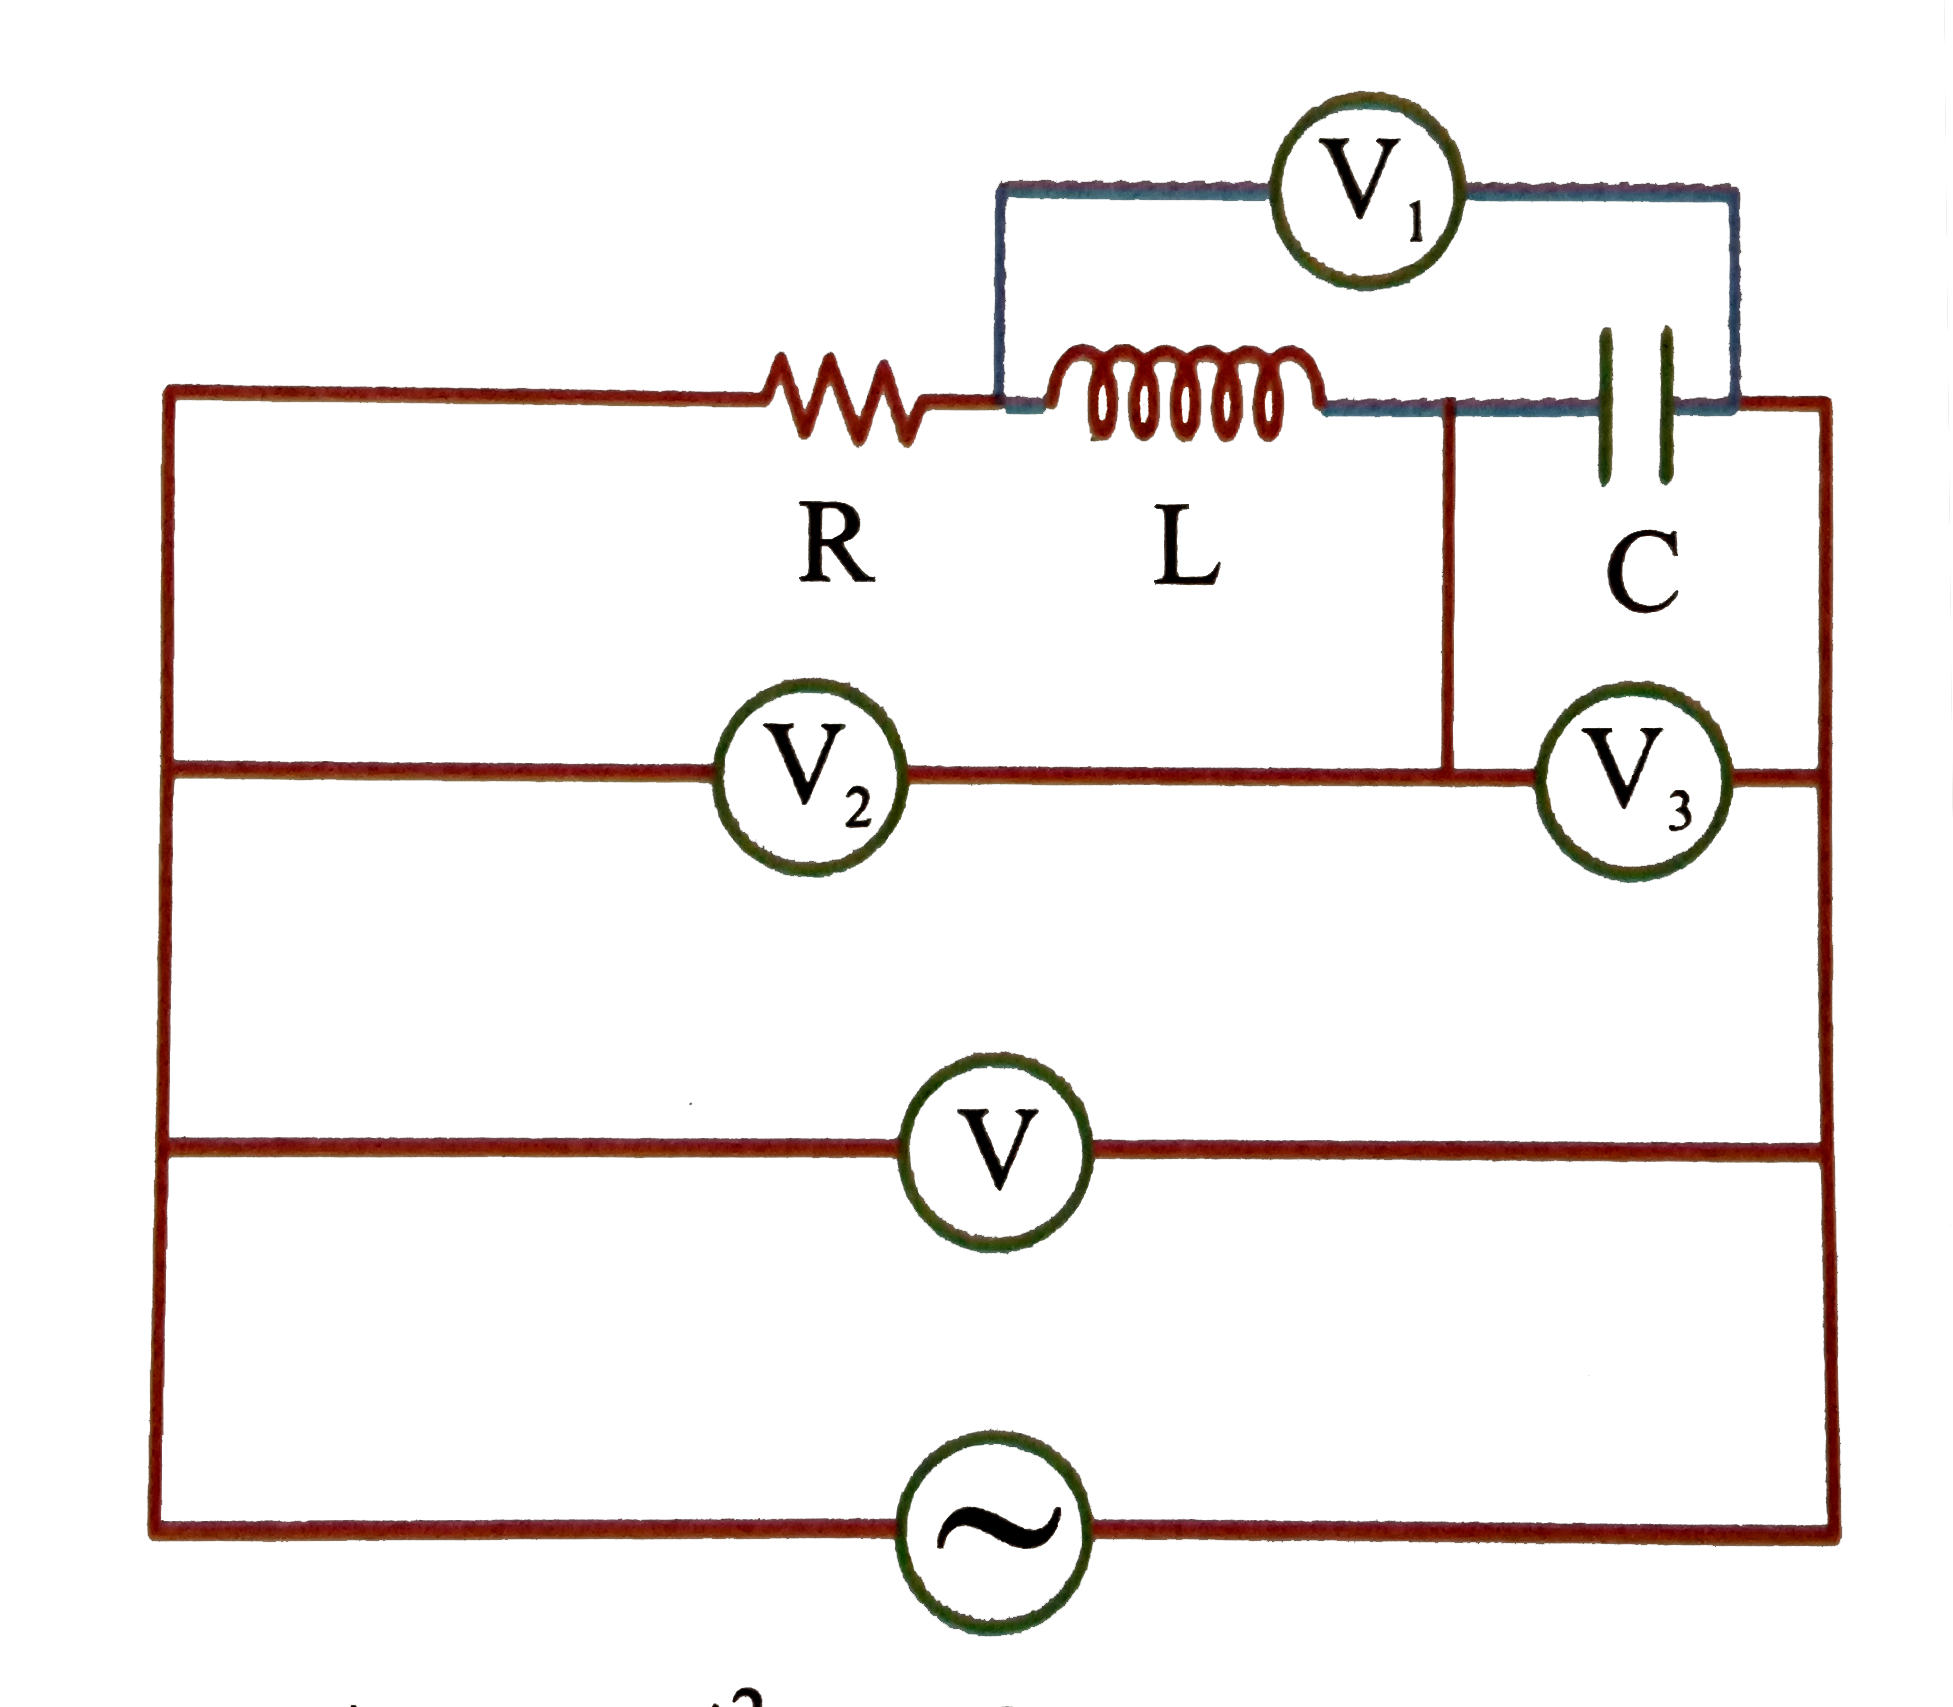
View SolutionAt resonance of the given series R−L−C circuit:

View Solution

_PHY_E06_308_Q01.png)