The graph shows the variation of lnRv/s1T2, where R is resistance and T is temperature. Then find R as function T.
_2019_CBT5_E01_037_Q01.png)
R−R0eT02/T2
R−R0e−T2/T02
R−R0eT3/T0
R−R0e−T3/T03
The correct Answer is:A
Step by step video & image solution for The graph shows the variation of l nR v//s (1)/(T^(2)), where R is resistance and T is temperature. Then find R as function T. by Physics experts to help you in doubts & scoring excellent marks in Class 12 exams.
Updated on:21/07/2023Topper's Solved these Questions
Similar Questions
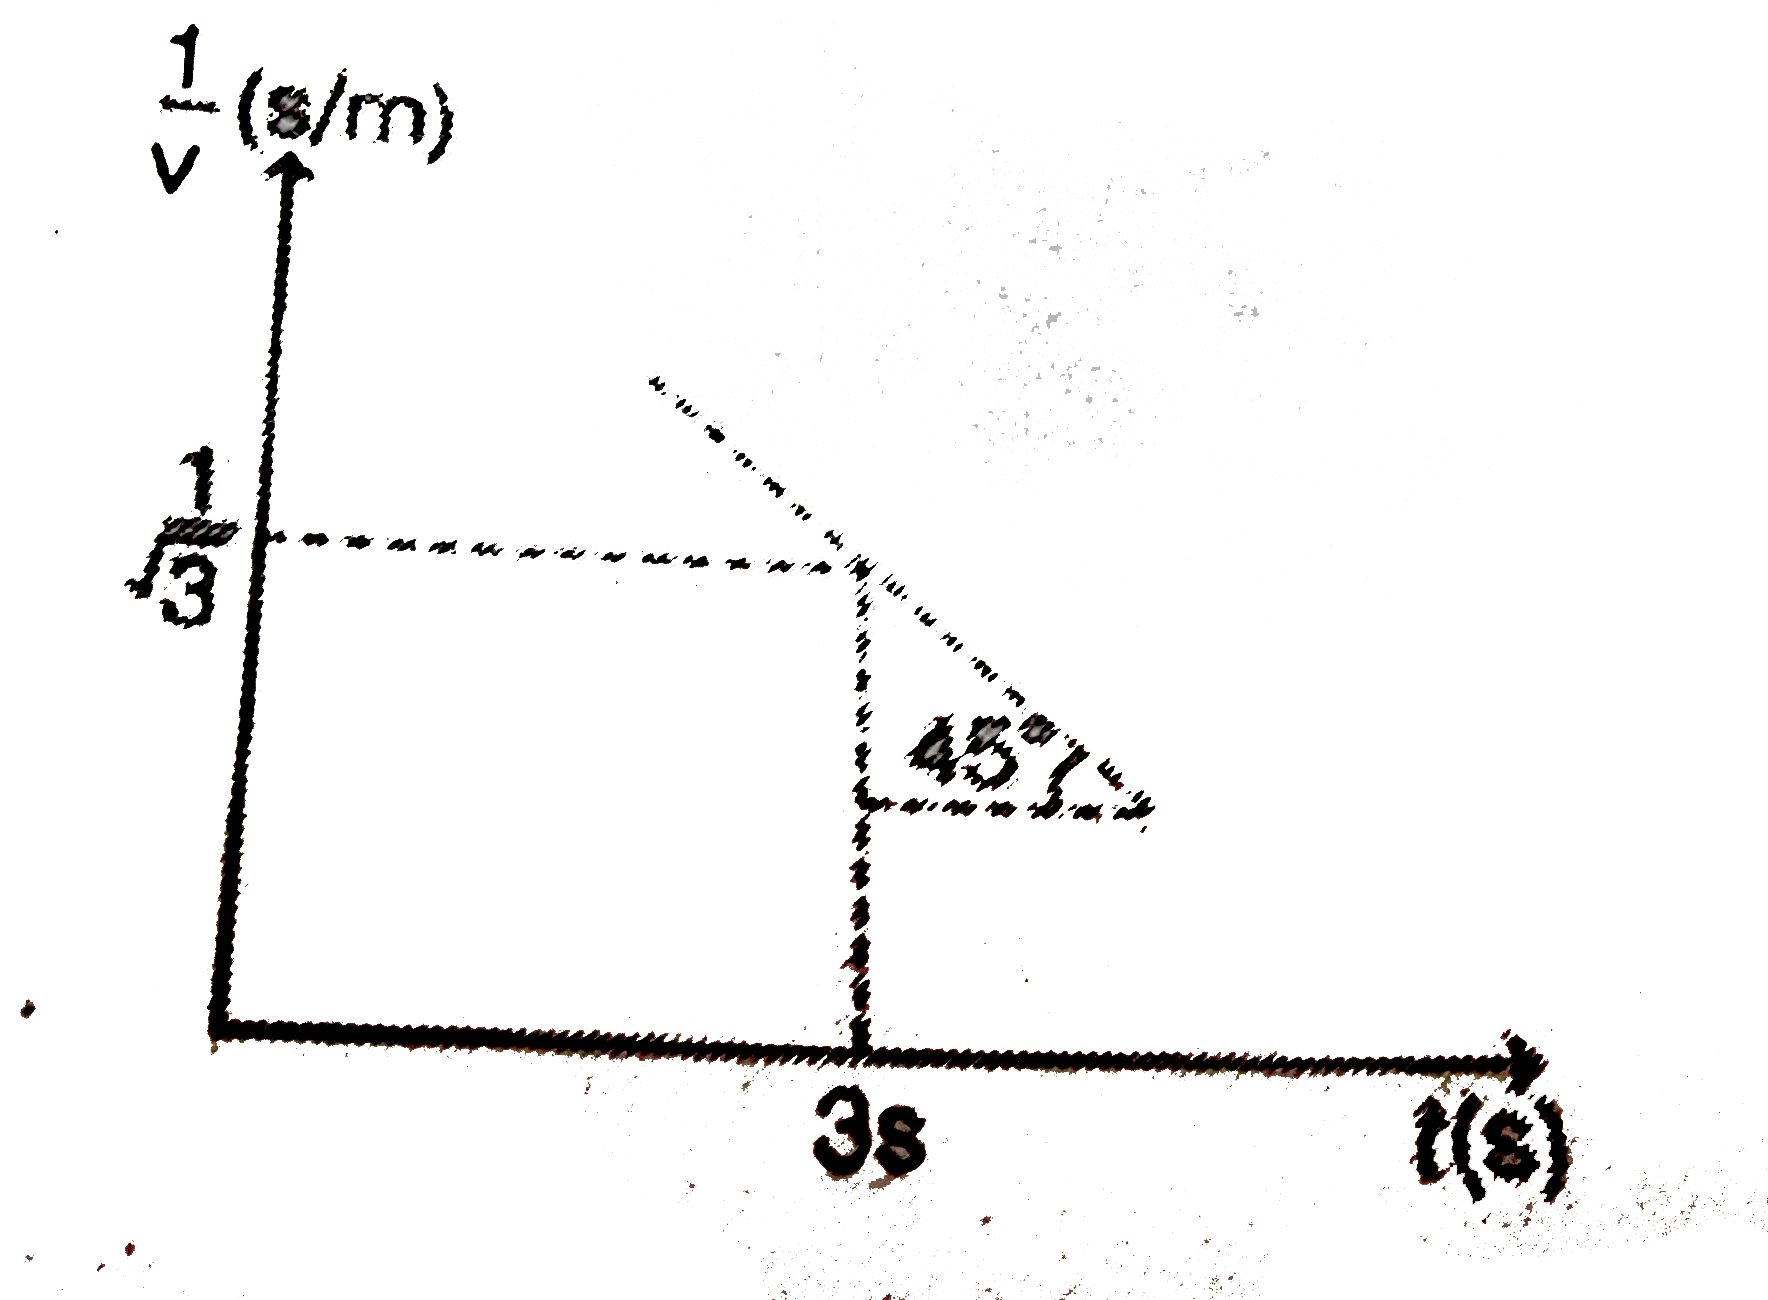
The diagram shows the variatioin of 1/v (where v is velocity of the particle) with respect to time. At time t=3s using the details given in the graph, find the instantaneous acceleration (in m/s2)

View SolutionResistance of a resistor at temperature t∘C is Rt=R0(1+αt+βt2), where R0 is the resistance at 0∘C. The temperature coefficient of resistance at temperature t∘C is
View SolutionThe correct graph which shows the variation of paramagnetic susceptibility S with temperature T is
View SolutionWhich of the following graph represents the variation of resistivity (ρ) with temperature (T) for copper?
View SolutionA rod of length l with thermally insulated lateral surface consists of material whose heat conductivity coefficient varies with temperature as k=a/T, where a is a constant. The ends of the rod are kept at temperatures T1andT2. Find the function T(x), where x is the distance from the end whose temperature is T1.
View Solution(a) Draw graph showing the variation of current versus voltage in an electroyte when an external resistance is also connceted.
(b) (i) The graph between resistance (R ) and temperature (T) for Hg is shown in the figure (a). Explain the behaviour of Hg near 4k.
(ii) In which region of the graph shown in the figure (b) is the resistance negative and why?

View SolutionHow does the time period (T) of a simple pendulum depend on its length (l)? Draw a graph showing the variation of T2 with l. How will you use this graph to determine the value of g (acceleration due to gravity) ?
View SolutionGraphs: s vs t, v vs t and a vs t
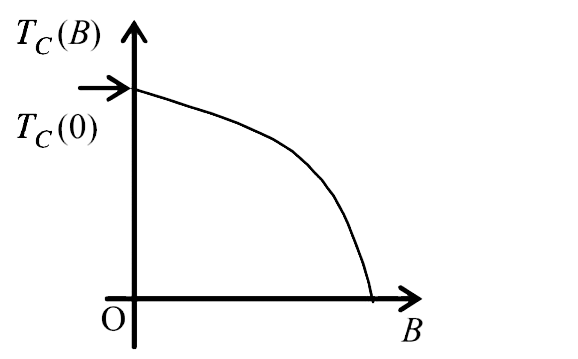
View SolutionElectrical resistance of certain materials, known as superconductors, changes abruptly from a nonzero value of zero as their temperature is lowered below a critical temperature TC(0). An interesting property of super conductors is that their critical temperature becomes smaller than TC(0) if they are placed in a magnetic field, i.e., the critical temperature TC(B) is a function of the magnetic field strength B. The dependence of TC(B) on B is shown in the figure.
 .
.
In the graphs below, the resistance R of a superconductor is shown as a function of its temperature T for two different magnetic fields B1(solid line) and B2 (dashed line). If B2 is larget than B1 which of the following graphs shows the correct variation of R with T in these fields?
View SolutionThe speed of a particle moving in a circle of radius r=2m varies with time t as v=t2, where t is in second and v in m/s. Find the radial, tangential and net acceleration at t=2s.
View Solution
