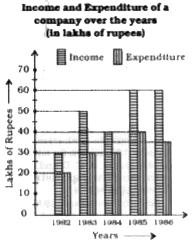
Read the following bar graph and answer the questions for (Q.No−30→32)What is the income of the company between January and March? What is the profit percentage in the month of April?What is the ratio of the income to expenditure from January to June?
Step by step video & image solution for Read the following bar graph and answer the questions for (Q.No - 30 to 32)What is the income of the company between January and March? What is the profit percentage in the month of April?What is the ratio of the income to expenditure from January to June? by Maths experts to help you in doubts & scoring excellent marks in Class 9 exams.
Updated on:21/07/2023Similar Questions
Read the following bar graph and answer the questions for (Q.No−30→32)What is the income of the company between January and March? What is the profit percentage in the month of April?What is the ratio of the income to expenditure from January to June?
View SolutionRead the following graph carefully and answer the questions given below.
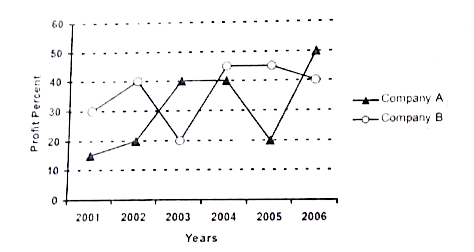
If income of company B in the year 2006 is Rs. 28 cr. what is the profit of the company in the same year?
View Solution
Knowledge Check
Study the following graph carefully and answer these questions :-
Expenditure and profit percent of a company in different years
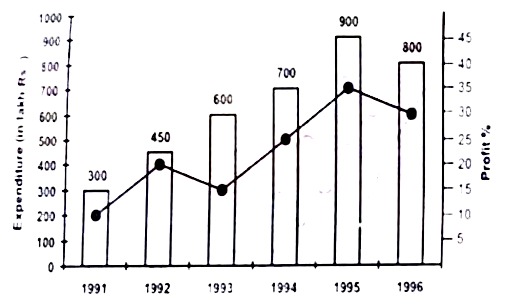
What is the average percentage profit for given years ?A24.5%B18.5%C22.5%D16.5%Study the following graph carefully to answer the question that follow
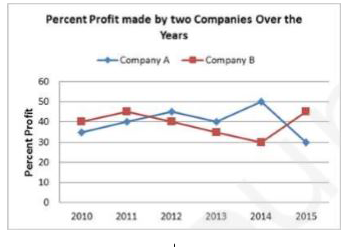
In the year 2014 the income of both the companies A and B was the same what was the respective ratio of expenditure of company A to the expenditure of company B in that year?AA)15:13BB)25:21CC)21:25DD)13:15Study the following graph carefully and answer these questions :-
Expenditure and profit percent of a company in different years
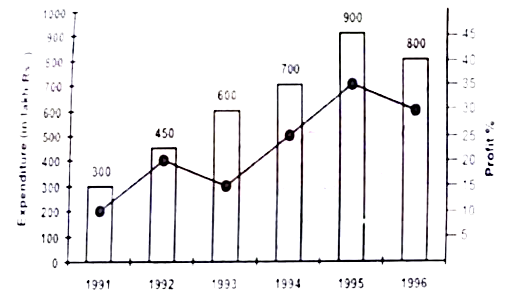
What is the difference between the income of year 1995 and 1993 ?ARs. 460 lakhsBRs. 525 lakhsCRs. 540 lakhsDRs. 580 lakhs
Read the following graph carefully and answer the questions given below.
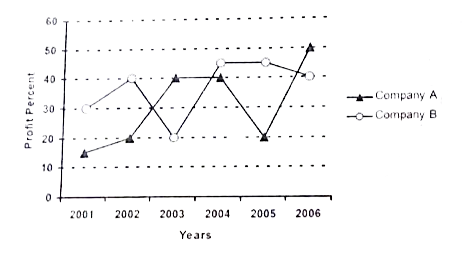
If income of company A in the year 2002 was Rs 20 cr. What is the approximate expenditure of the company in the same year ?
View SolutionStudy the following graph carefully and answer these questions :-
Expenditure and profit percent of a company in different years
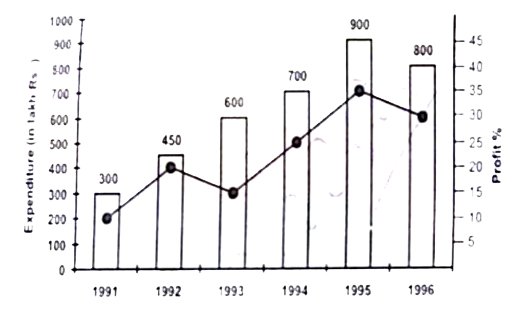
The approximate percentage increase in income from year 1991 to 1992 is -
View SolutionStudy the following graph carefully and answer these questions :-
Expenditure and profit percent of a company in different years
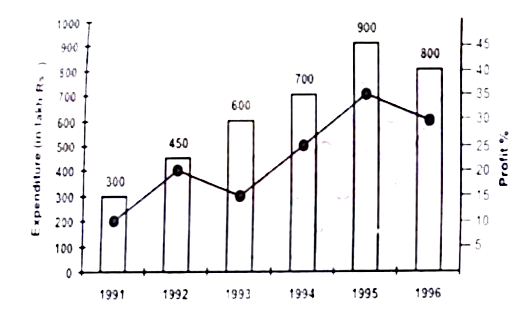
What is the ratio of total income to total expenditure of all the years taken together ?
View SolutionStudy the following graph carefully and answer the given questions :-
The following graph shows the % profit of two companies over the years :-
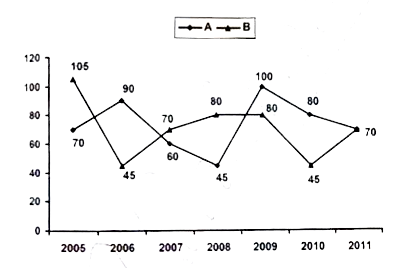
If income of company A in the year 2006 and 2009 are same then what is the respective ratio of expenditure of company A in both the same years ?
View SolutionRead the graph and answer the following questions.
The ratio of the average income of all the years to the average profit is
View Solution
