Read the graph and answer the following questions.
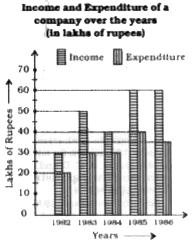
The ratio of the average income of all the years to the average profit is
24:13
48:17
12:7
6:5
The correct Answer is:B
Step by step video, text & image solution for Read the graph and answer the following questions. The ratio of the average income of all the years to the average profit is by Maths experts to help you in doubts & scoring excellent marks in Class 14 exams.
Topper's Solved these Questions
- BOOK - KIRAN PUBLICATIONCHAPTER - STATISTICS AND DATA INTERPRETATIONEXERCISE - TYPE-V38videos
STATISTICS AND DATA INTERPRETATION
- BOOK - KIRAN PUBLICATIONCHAPTER - STATISTICS AND DATA INTERPRETATIONEXERCISE - TYPE-VI86videos
STATISTICS AND DATA INTERPRETATION
- BOOK - KIRAN PUBLICATIONCHAPTER - STATISTICS AND DATA INTERPRETATIONEXERCISE - TYPE-III39videos
STATISTICS AND DATA INTERPRETATION
- BOOK - KIRAN PUBLICATIONCHAPTER - SIMPLIFICATIONEXERCISE - TEST YOURSELF25videos
SIMPLIFICATION
- BOOK - KIRAN PUBLICATIONCHAPTER - TIME AND DISTANCEEXERCISE - Type -XI74videos
TIME AND DISTANCE
Similar Questions
Observe the graph below and answer the following question
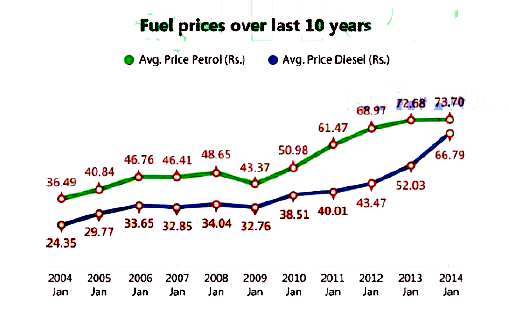
What is the average of diesel prices over the years 20062012?View SolutionFollowing bar graph shown the income and expenditure ( in Rs. lakhs) of a ceremony. Read the graph carefully and answer the questions.
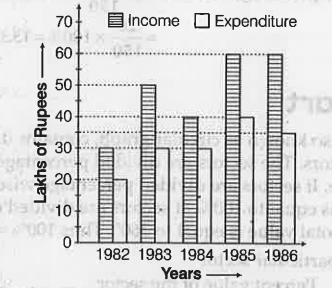
What is the average income of the company are the years?View Solution
Knowledge Check
- Question 1 - Select One
Read the graph and answer the following questions.
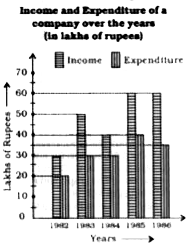
The number of years in which the income is more than the average income of the given years isAOneBTwoCThreeDFour - Question 2 - Select One
Read the graph and answer the following questions.
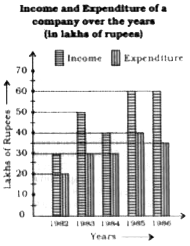
The total income exceeds the total expenditure over the years 1982 to 1986 byA85 lakhsB105 lakhsC115 lakhsD120 lakhs - Question 3 - Select One
Study the graph carefully and answer the following questions.
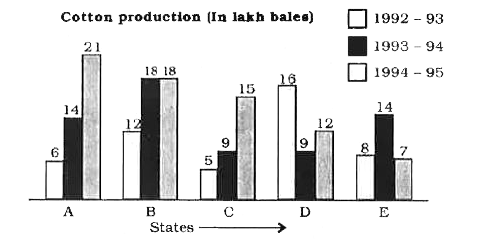
What is the average production of the four states in the year 1994-95 taken together ?A12.3B14.6C15.6D16.3
The following graph gives Sales, Expenses and Capital of a company for a period of five years 1994 to 1998. Read the graph and answer the following questions.
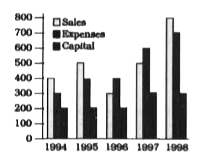
What was the average per annum increase in sales (in Rs cr.) from 1994 to 1998 ?View SolutionObserve the graph below and answer the following question.
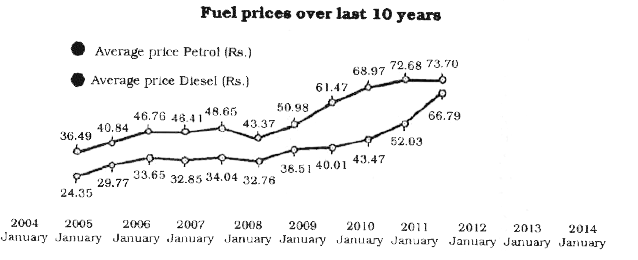
What is the average of diesel prices over the years 2006-2012?View SolutionStudy the graph and answer the following questions-
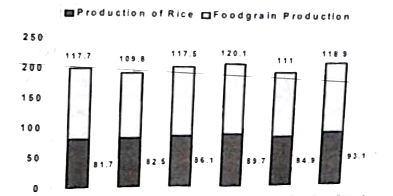
Over the given years what is average production of rice?View SolutionStudy the following bar diagram carefully and answer the four questions.
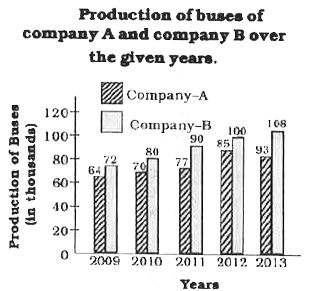
The ratio of the average production of company A in 2009 and 2010 to the average production of company B in the same years isView SolutionStudy the graph and answer the following questions-
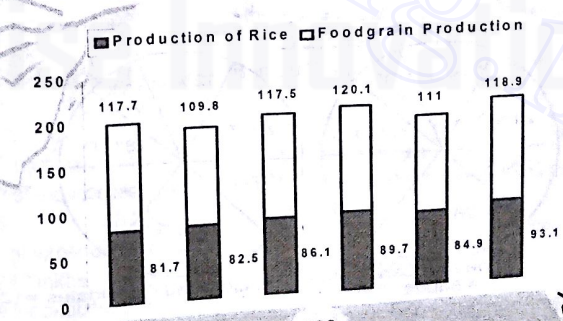
Average production of rice is what percent of the maximum recorded production of food grains over the years?View Solution

