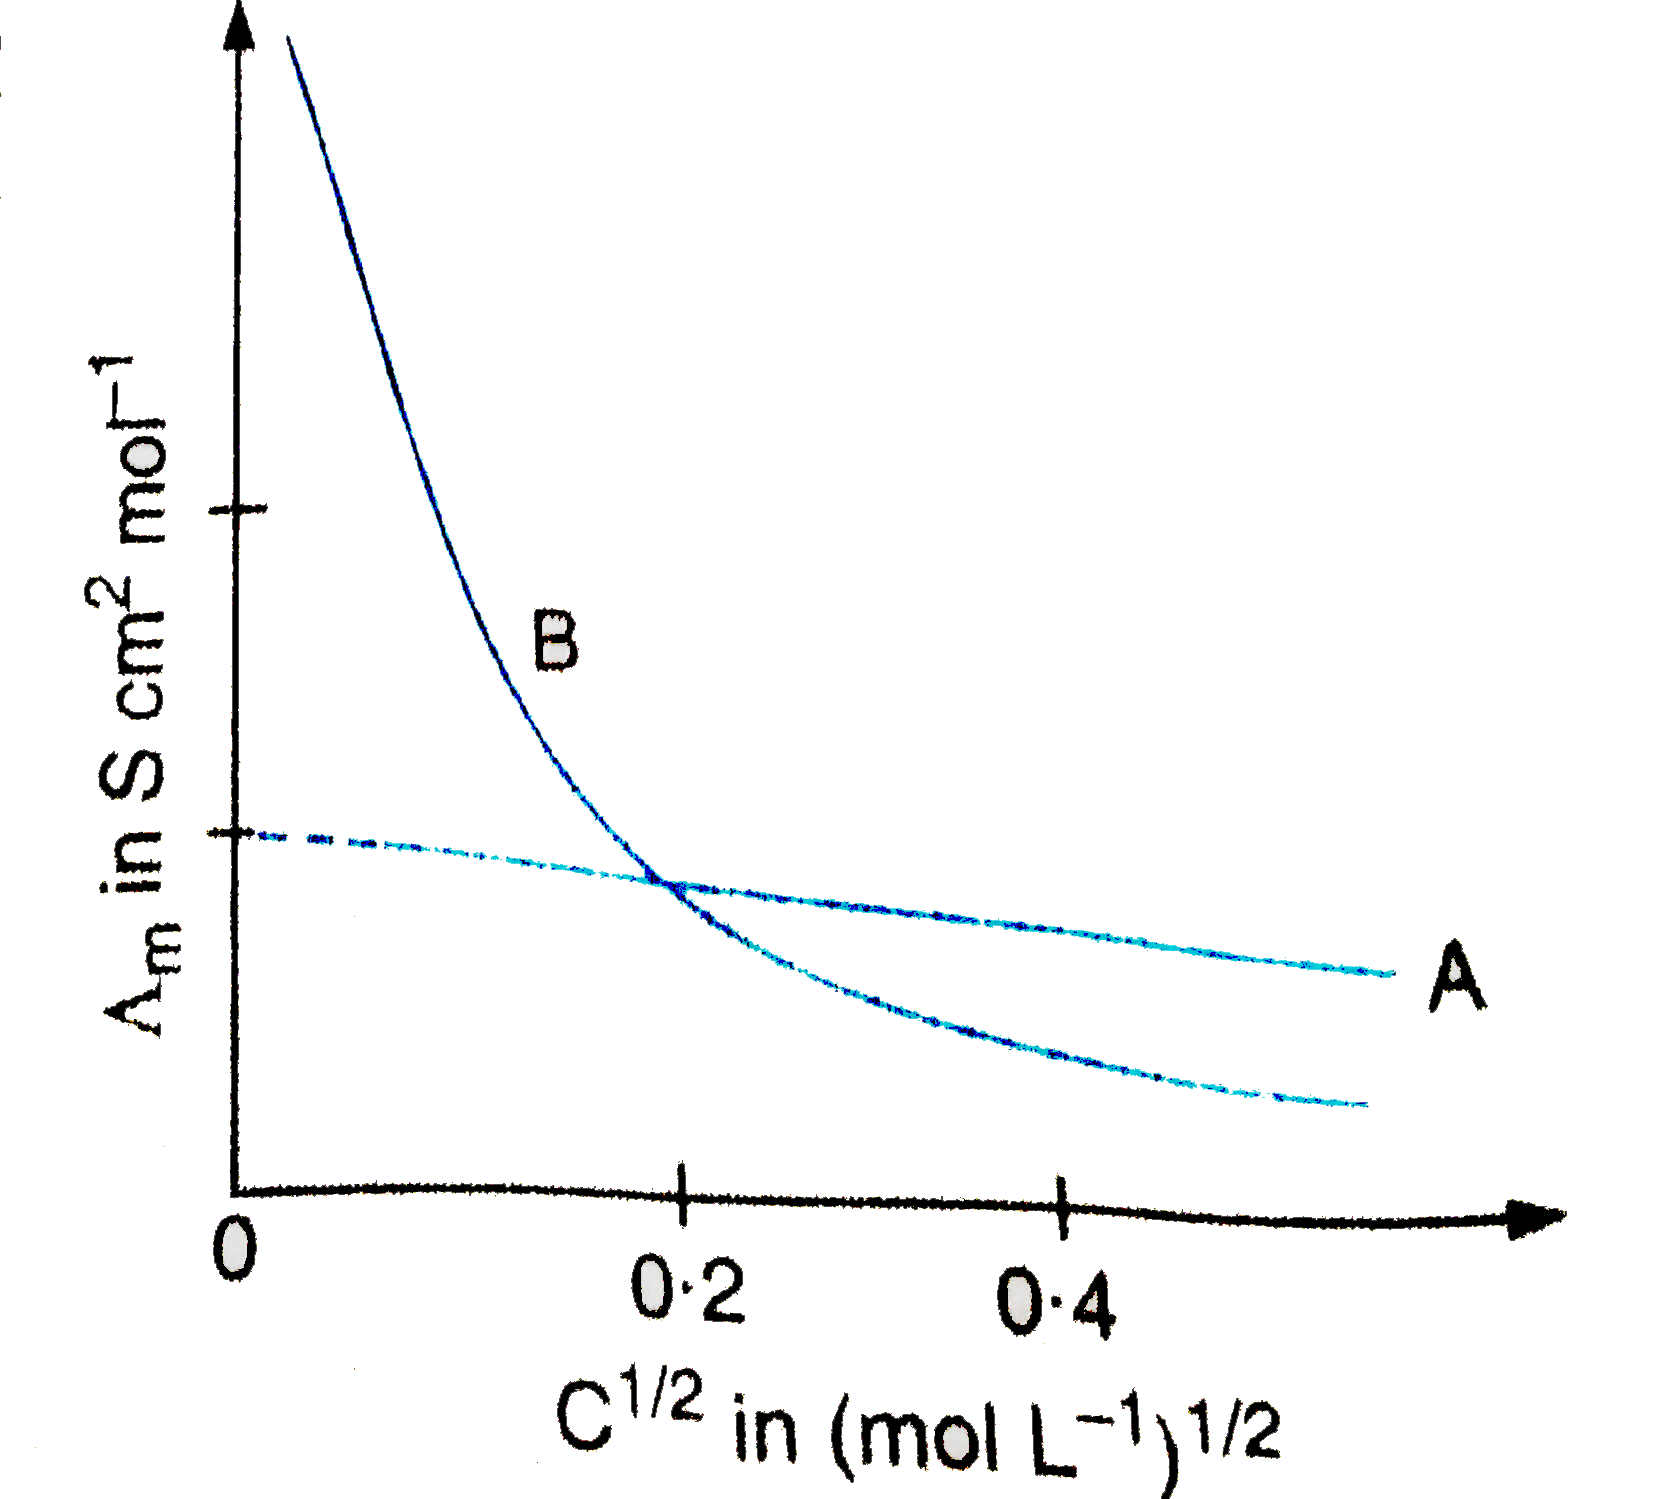
In the plot of molar conductivity (^ m) vs square root of concentration (c1/2) following curves are obtained for two electrolytes A and B :
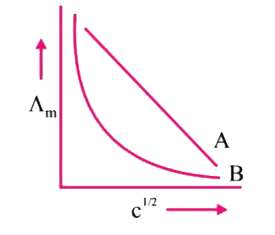
Answer the following: (i) Predict the nature of electrolytes A and B.
(ii) What happens on extrapolation of ^ m to concentration approaching zero for electrolytes A and B?
(i) A strong electrolyte, B-Weak electrolyte
(ii) ^° m for weak electrolytes cannot be obtained by extrapolation while ^° m for strong electrolytes can be obtained as intercept.
Topper's Solved these Questions
Similar Questions
(a) A steady current of 2 amperes was passed through two electrolytic cells X and Y connected in series containing electrolytes FeSO4 and ZnSO4 until 2.8 g of Fe deposited at the cathode of cell X. How long did the current flow ? Calculate the mass of Zn deposited at the cathode of cell Y
(Molar mass : Fe= 56 g mol−1 Zn-65.3g mol−1, 1F -96500 C mol−1)
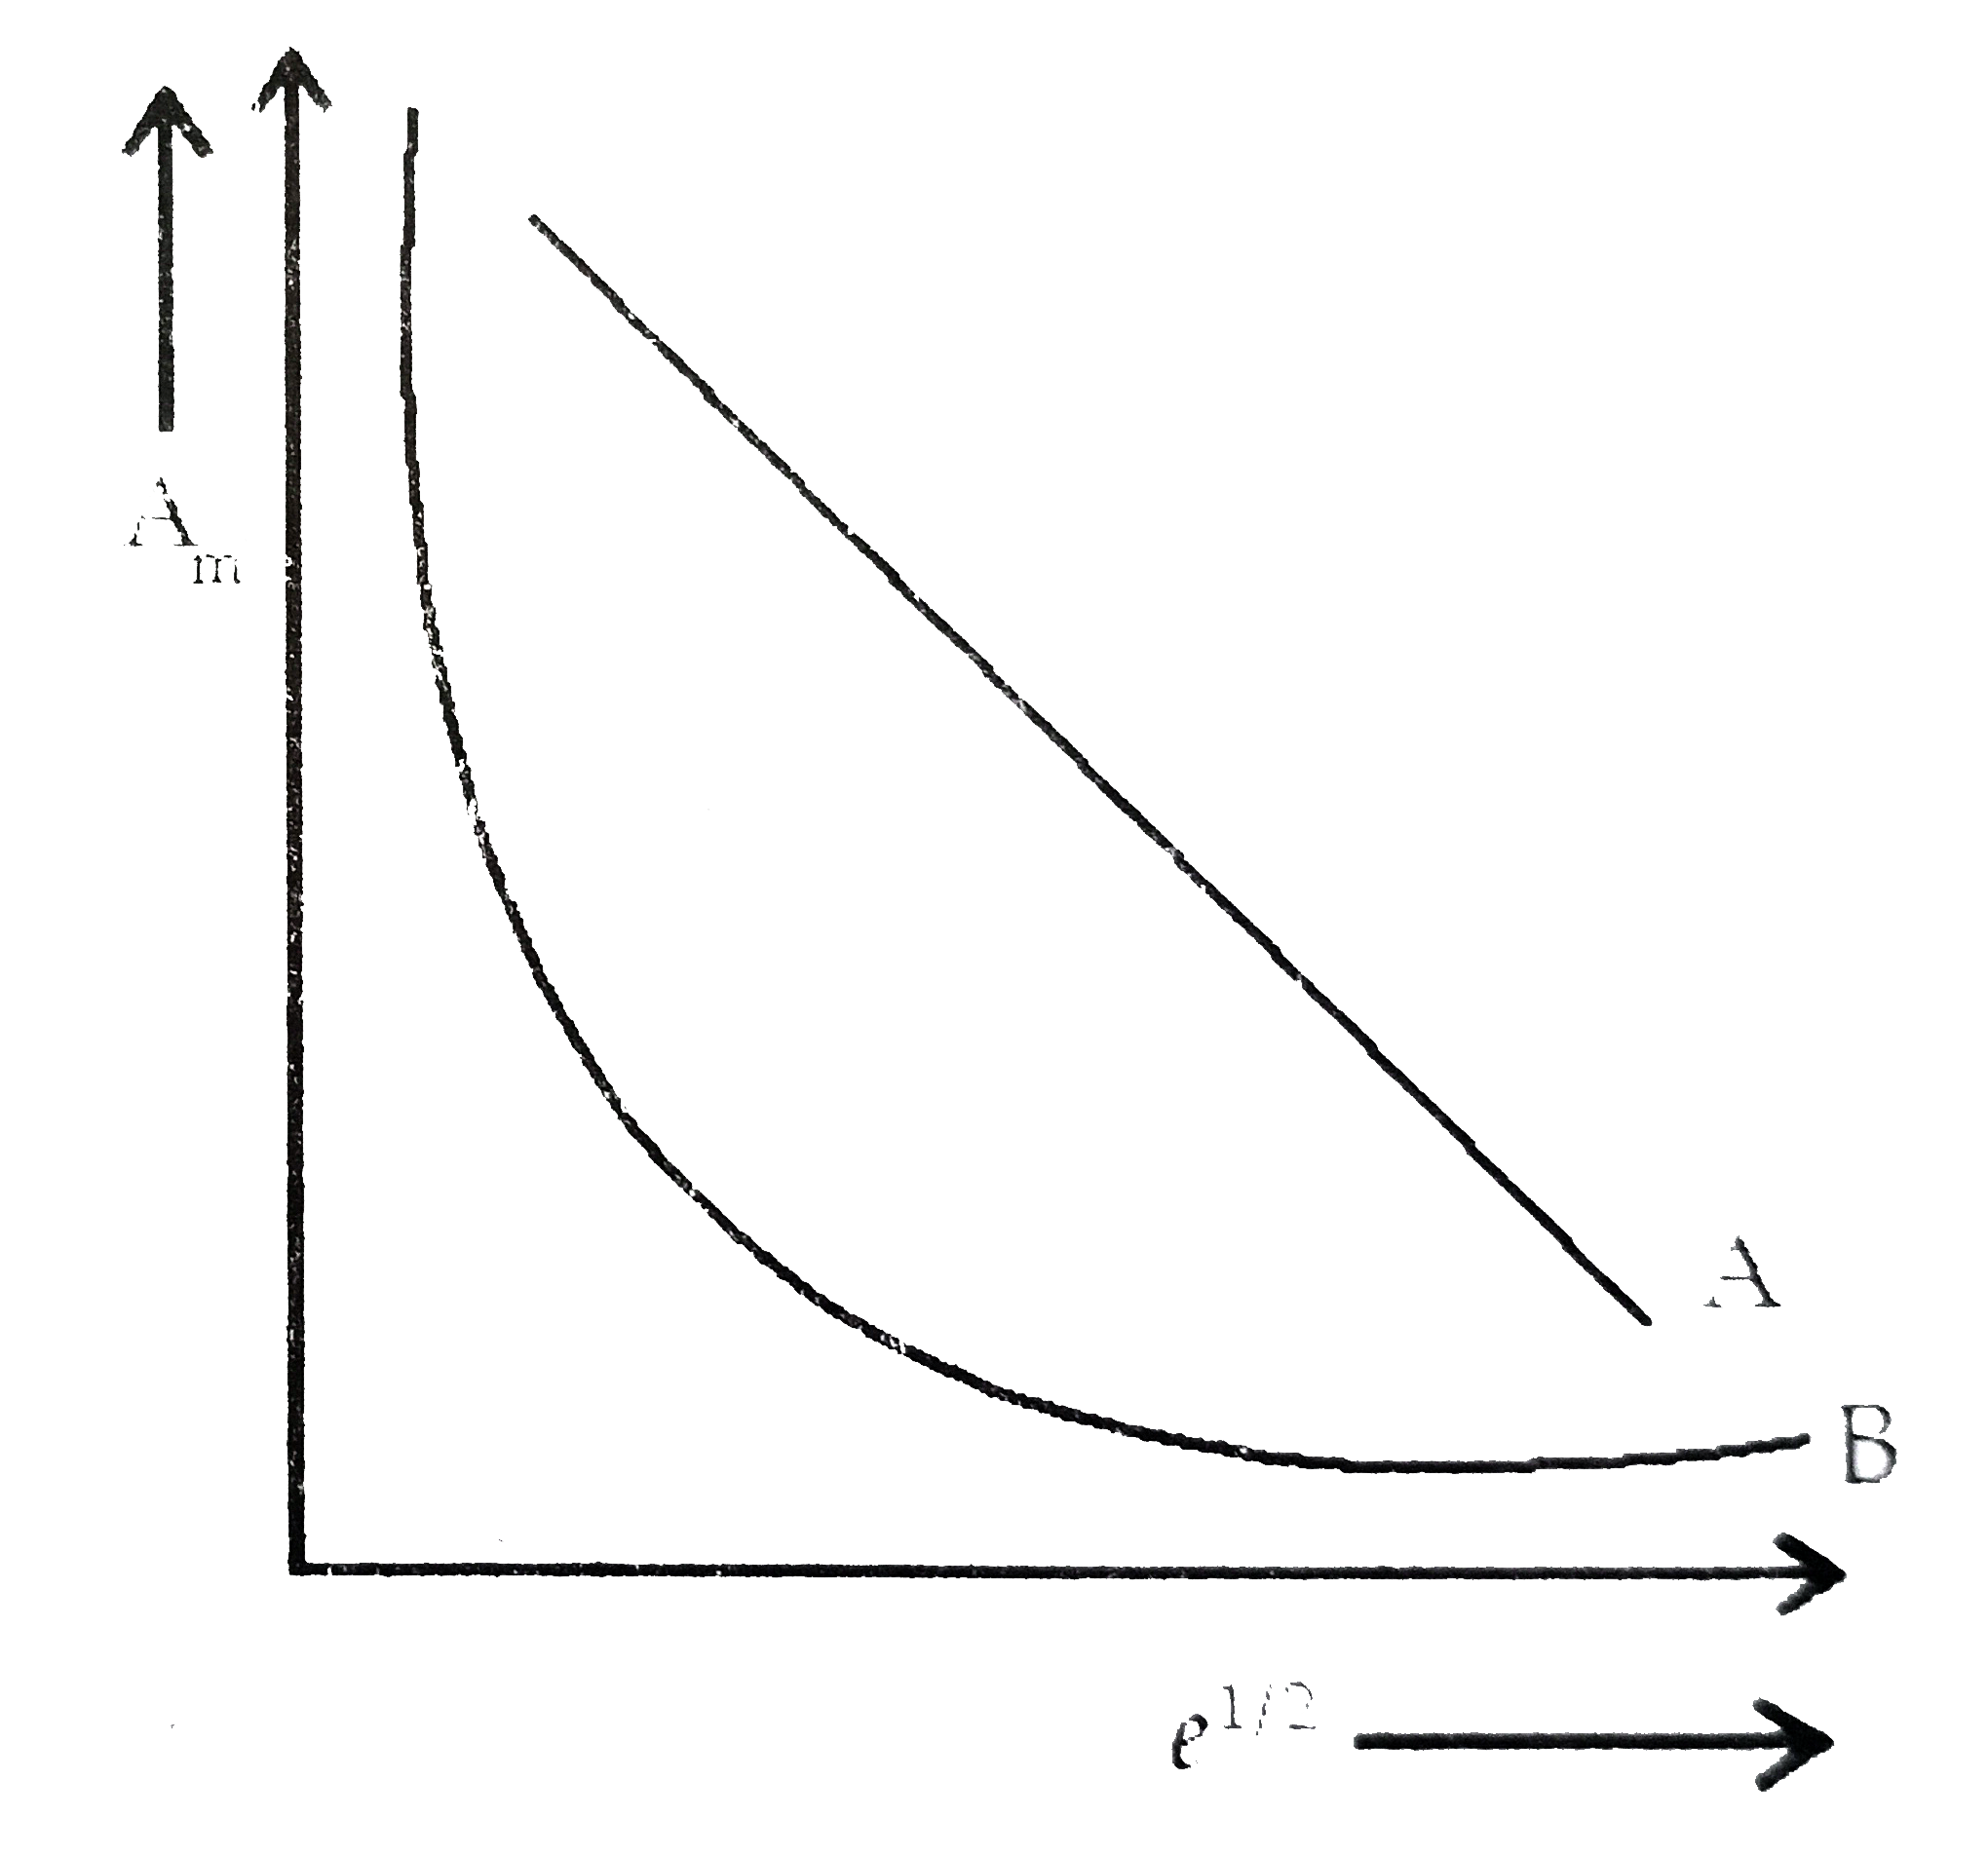
(b) In the plot of molar conductivity (∧m) vs Square root of concentration (c1/2), following curves are obtained for two electrolytes.
A and B:
Answer the following : (i) Predict the nature of electrolytes A and B. (ii) What happens on extrapolation of ∧m to concentration approaching zero for electrolytes A and B ?
View SolutionThe following curve is obtained when molar conductivity Λm is plotted against the square root of concentration C1/2 (x-axis) for two electrolytes A and B :
(a) What can you say about the nature of the two electrolytes A and B ?
(b) How do you account for the increase in molar conductivity A, for the electrolytes A and B on dilution ?
View Solution
Knowledge Check
To obeserve the effect of concentration on the conductivity, electrolytes of different natures are taken in two vessels A and B, A contains weak electrolyte, e.g.,NH4OH and B contains strong electrolyte, e.g.,NaCl. In both containers, the concentration of respective electrolyte is increased and the conductivity observed:
AIn A conductivity increases, in B conductivity decreaseBIn A conductivity decreases while, in B conductivity decreaseCIn both A and B conductivity increasesDIn both A and B conductivity decreasesStatement: For a weak electrolyte, the plot of molar conductivity (Λm) against √C(C is concentration in mol litre−1) is nearly linear.
Explanation: The molar conductivity at infinite dilution (Λm) for an electrolyte can be considered equal to the sum of the limiting molar conductivities of the individual ions.AS is correct but E is wrong.BS is wrong but E is correc.CBoth S and E are correct and E is correct explanation of S.DBoth S and E are correct but E is correct explanation of S.Molar conductance Λm is plotted against √C (mol litre−1) for three electrolytes (NaCl,HCl,NH4OH)
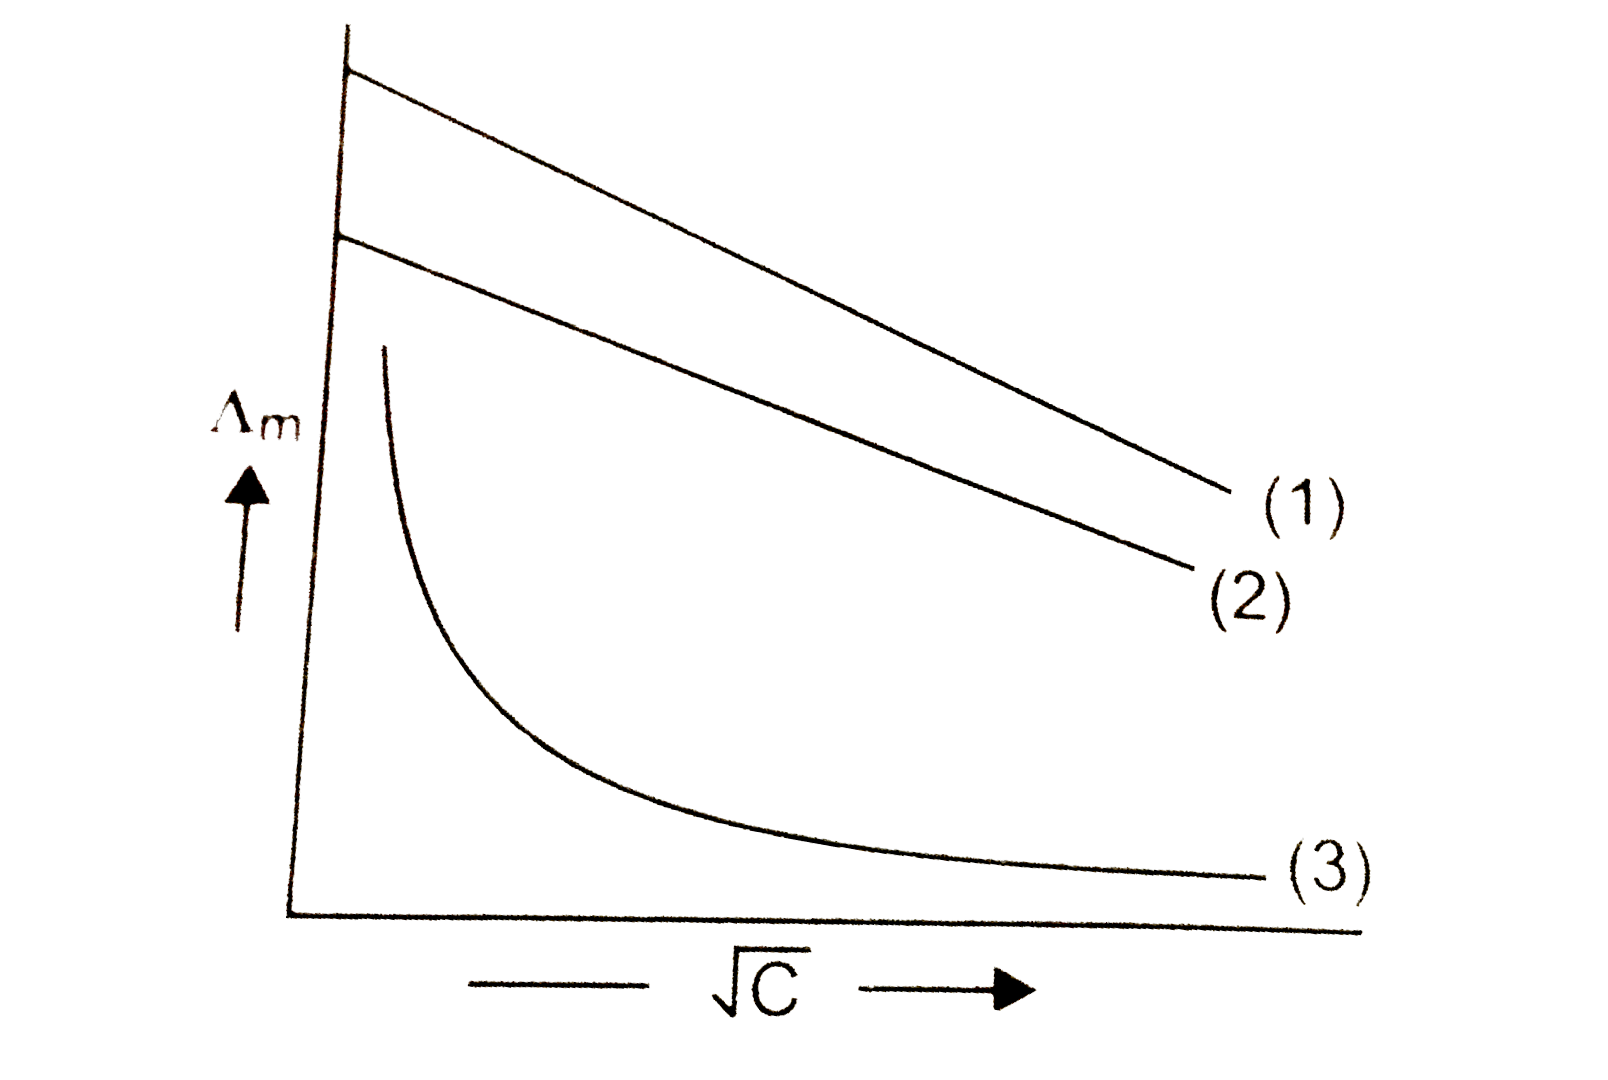
which of the following is correct ?AIIIIIINaClHClNH4OHBIIIIIIHClNaClNH4OHCIIIIIINH4OHNaClHClDIIIIIINH4OHHClNaCl
The following curve is obtained when molar conductivity (∧m) is plotted against the square root of concentration, c1/2 for two electrolytes A and B
(a) How do you account for the increase in the molar conductivity of the electrolyte A on dilution.
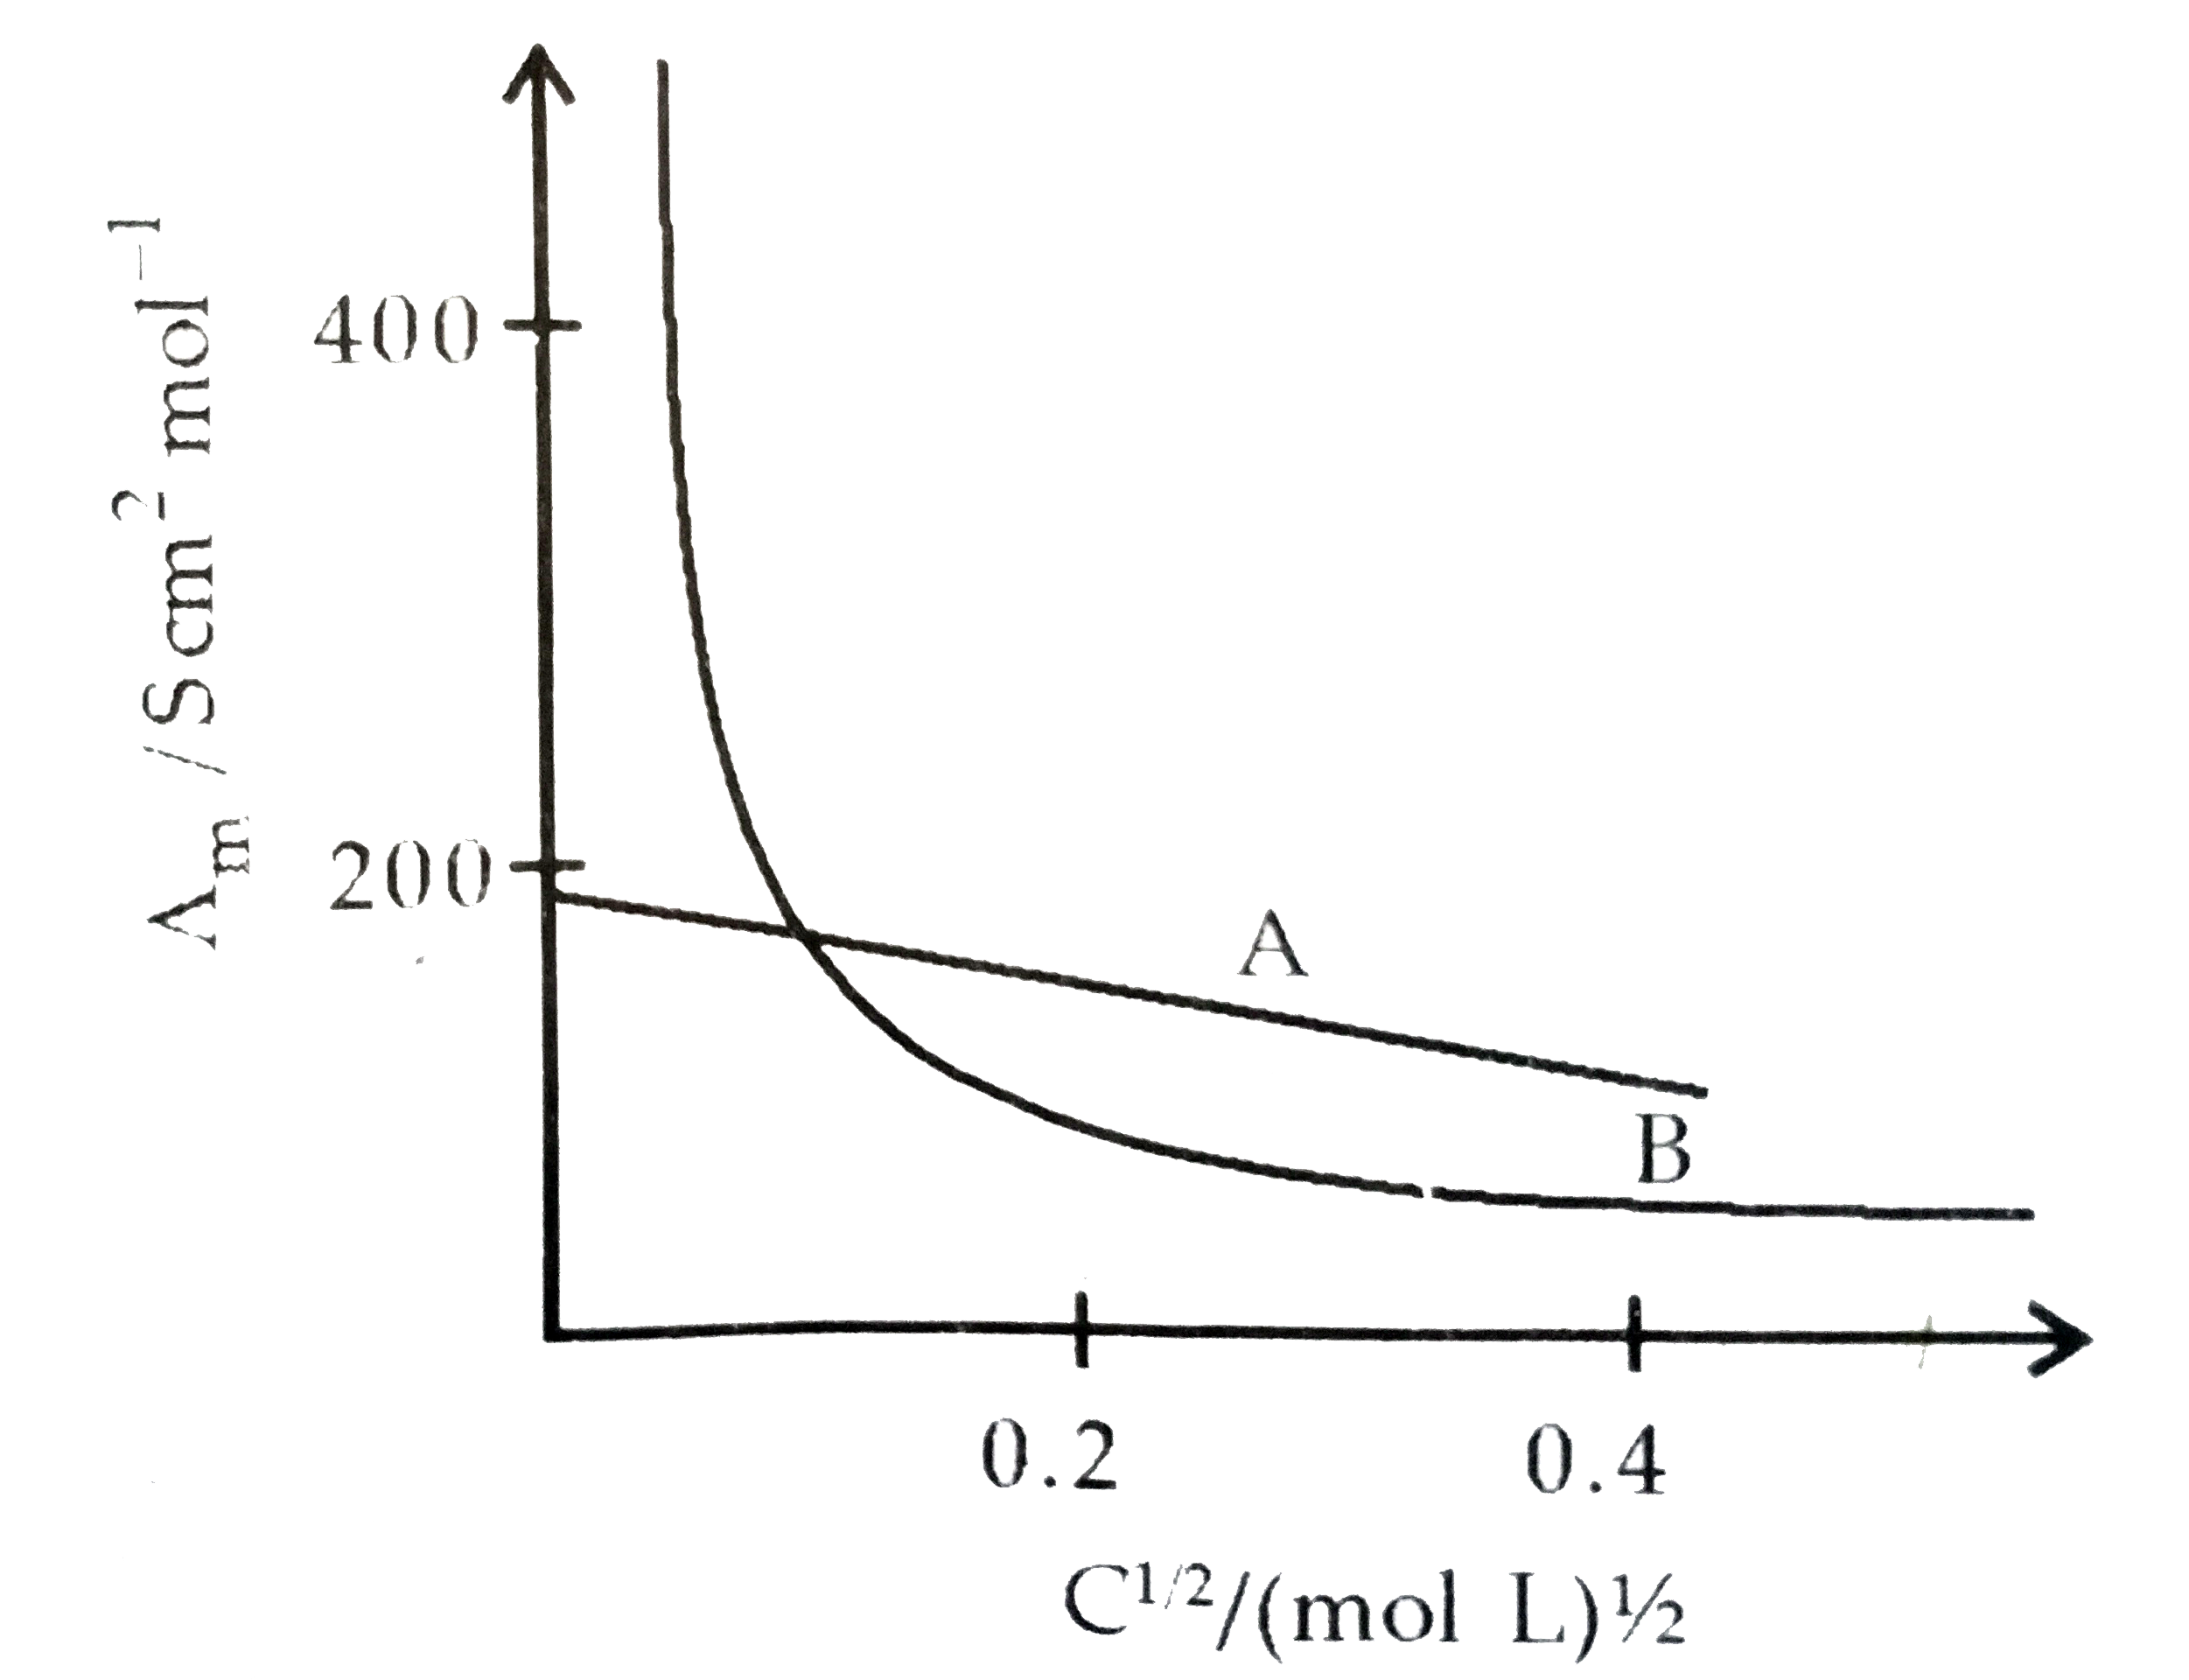
(b) As seen from the graph, the value of limiting molar conductivity (∧0m) for electrolyte B cannot be obtained graphically. How can this value be obtained?1
View SolutionThe curves obtained when molar conductivity λm (along Y-axis) is plotted against the square root of concentration C1/2 (along X-axis) for two electrolytes 'A' and 'B' are shown.
(a) What can you say about the nature of the two electrolytes ?
(b) How do you account for the increase in molar conductivity Λm for the electrolytes A and B on dilution ?
View SolutionOn the basis of Eo values identify which amongst the following is the strongest oxidising agent
Cl2(g)+2e−→2Cl−E∘=+1.36V,
MnO−4+8H++5e−→Mn2++4H2OE∘=+1.51V
Cr2O2−7+14H++6e−→2Cr3++7H2OE∘=+1.33V
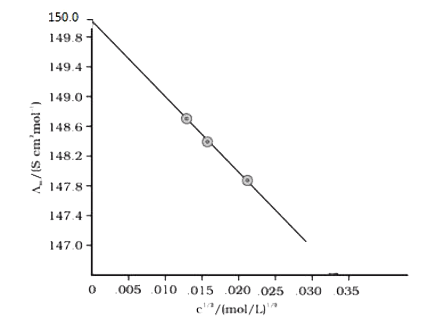
(ii) The following figure 2, represents variation of (Λm) vs √c for an electrolyte. Here Λm is the molar conductivity and c is the concentration of the electrolyte.
a) Define molar conductivity
b) Identify the nature of electrolyte on the basis of the above plot. Justify your answer.
c) Determine the value of Λmo for the electrolyte.
d) Show how to calculate the value of A for the electrolyte using the above graph.
View Solution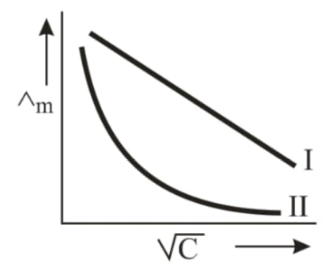
Above plot represents the variation of molar conductance against √C (where C = molar concentration of the electrolyte) . Select the correct option among following .
View SolutionA graph was plotted between the molar conductance of various electrolytes (HCI,KCI and CH3COOH) and root of their concentrations in molar per litre.
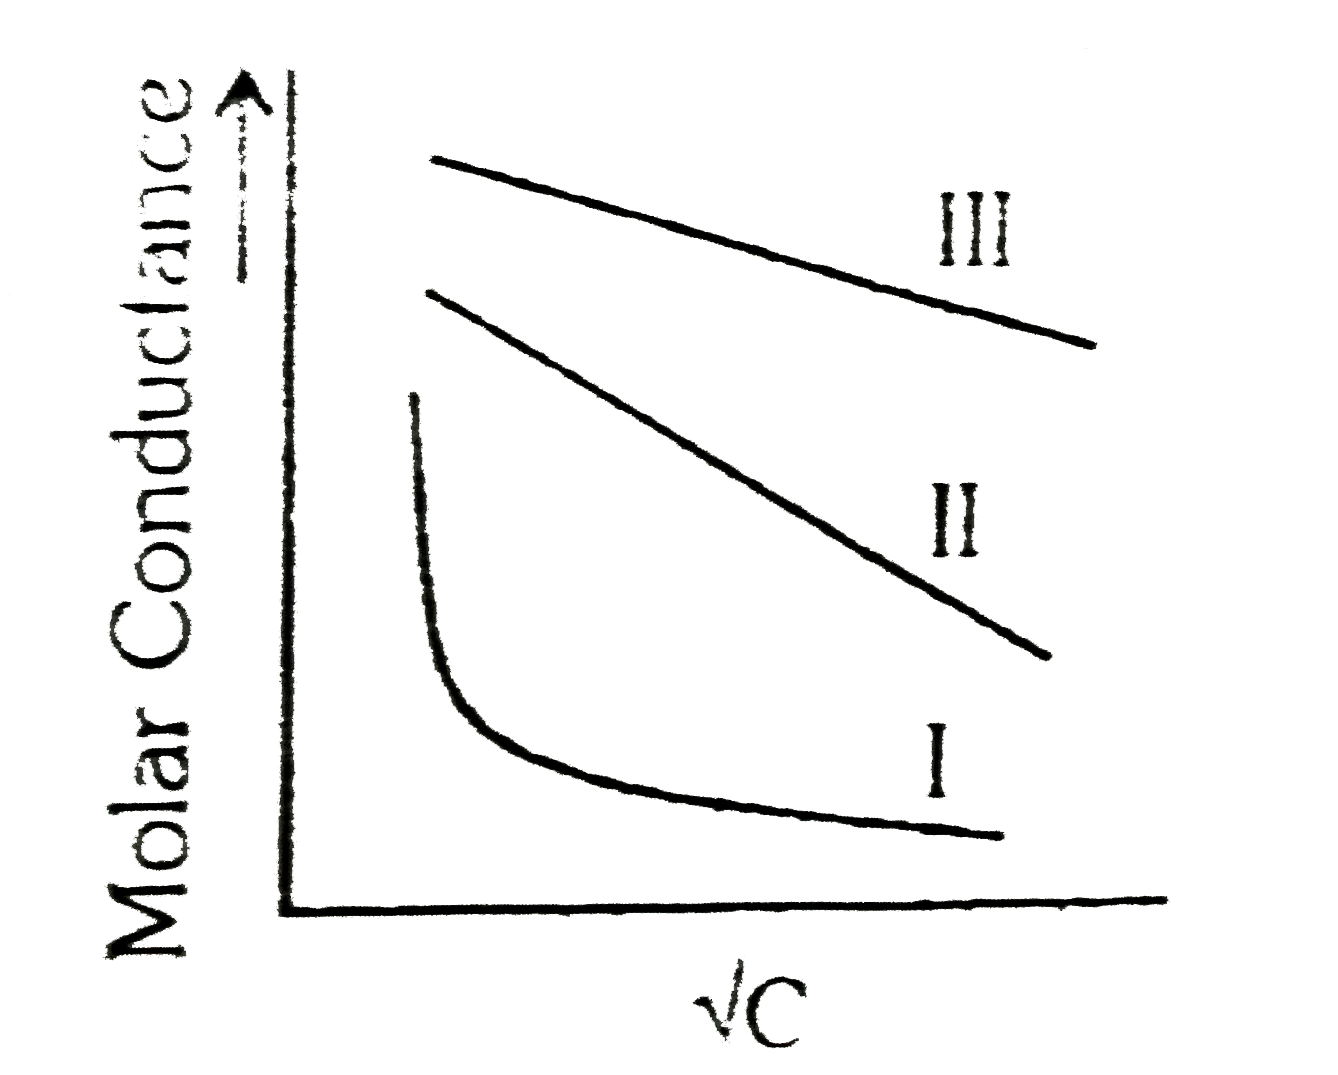
Which of the following is correct match?
View Solution