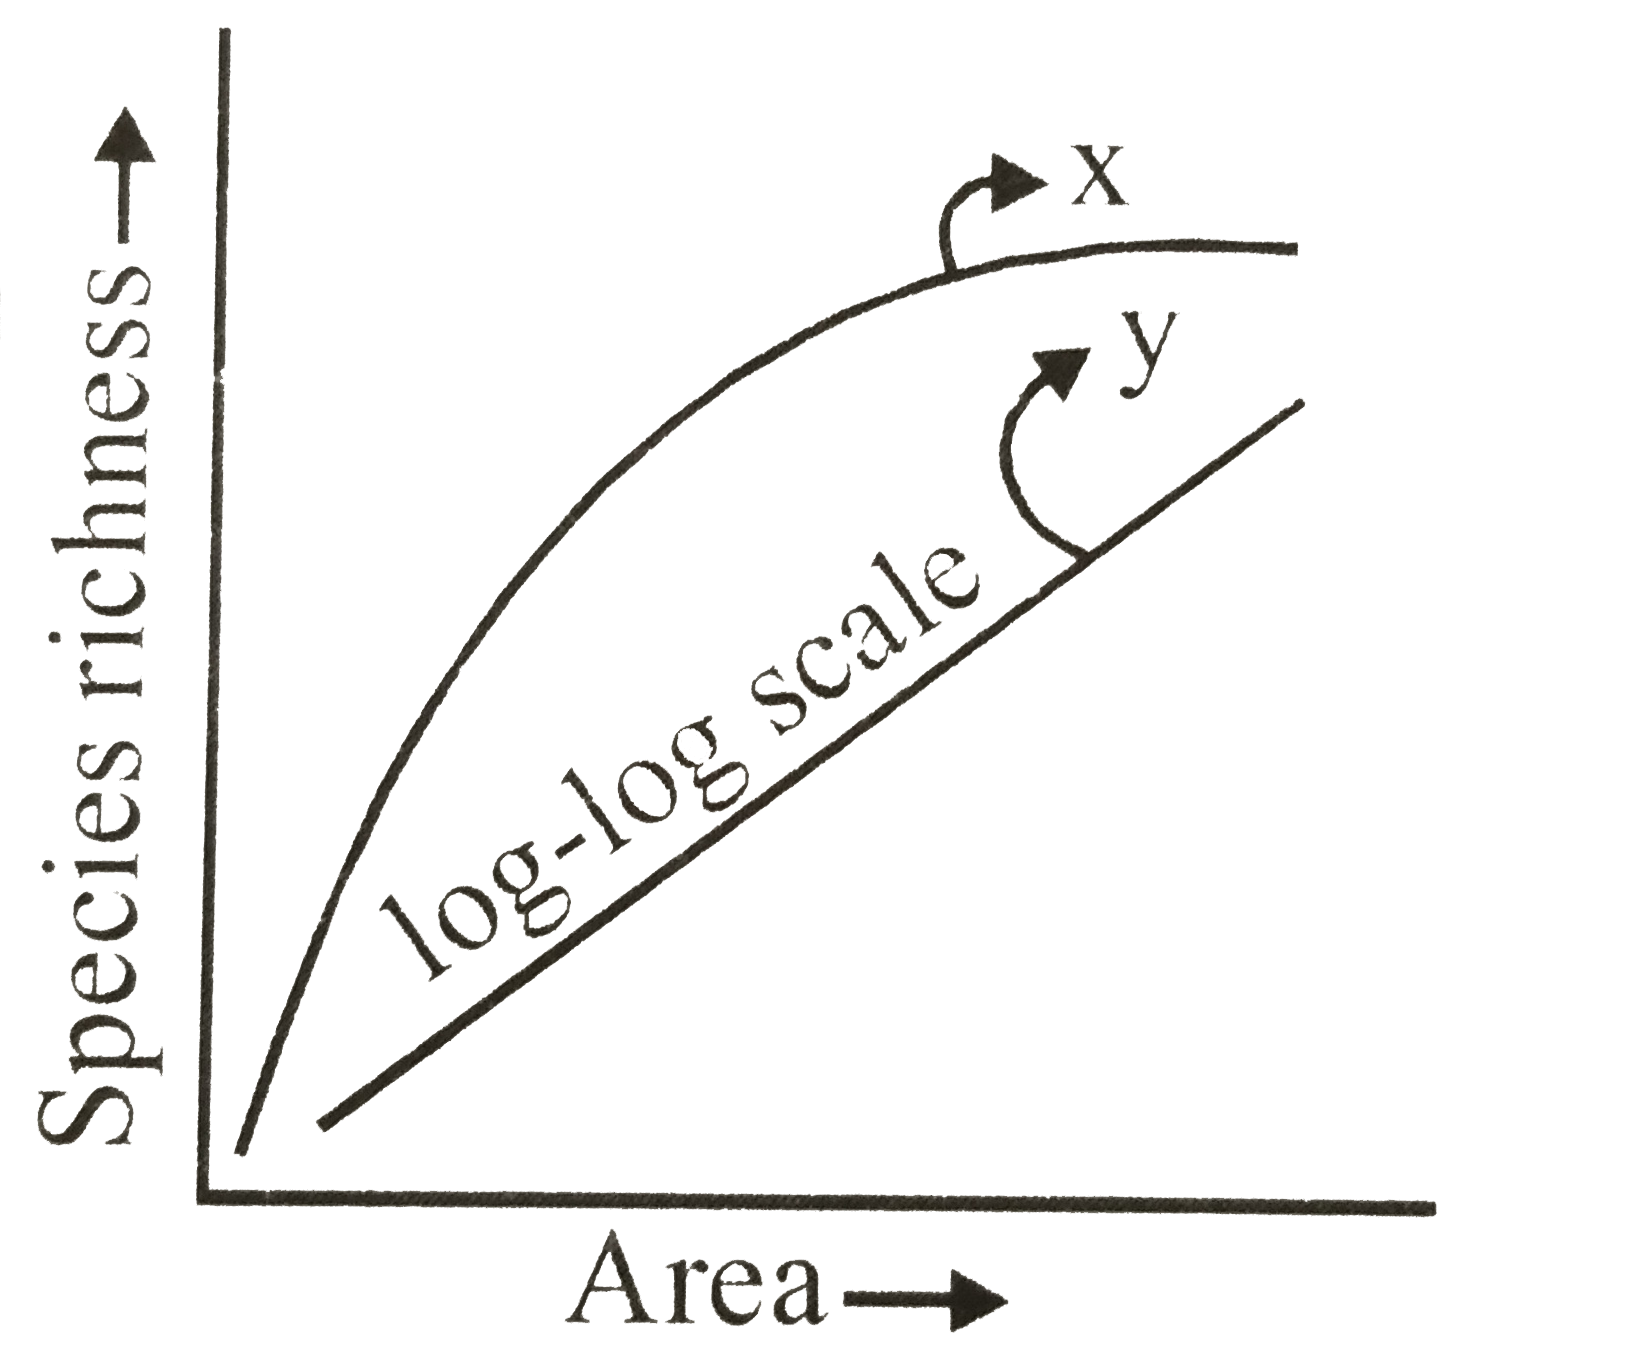
The relation between species richness and area for a wide variety of taxa (angiosperm plants, birds, bats, freshwater fishes) is a
Parabola
Rectangular hyperbola
Ellipse
Straight line
The correct Answer is:B
To solve the question regarding the relationship between species richness and area for various taxa, we can follow these steps:
1. Understanding the Variables:
- Species richness (S) refers to the number of different species present in a given area.
- Area (A) is the size of the habitat or region being studied.
2. Establishing the Relationship:
- The relationship between species richness and area can be expressed mathematically as S=CAZ, where:
- C is a constant,
- Z is a coefficient that indicates how species richness changes with area.
3. Logarithmic Transformation:
- To analyze this relationship more easily, we can take the logarithm of both sides:
logS=logC+ZlogA
- This transformation allows us to express the relationship in a linear form.
4. Interpreting the Graph:
- In this logarithmic form, if we plot logS (y-axis) against logA (x-axis), we expect to see a straight line.
- The slope of this line will be Z, and the y-intercept will be logC.
5. Conclusion:
- Therefore, the relationship between species richness and area for a variety of taxa is represented as a straight line on a logarithmic scale.
Final Answer:
The relation between species richness and area for a wide variety of taxa (angiosperm plants, birds, bats, freshwater fishes) is a straight line on a logarithmic scale.
---
- Species richness (S) refers to the number of different species present in a given area.
- Area (A) is the size of the habitat or region being studied.
- The relationship between species richness and area can be expressed mathematically as S=CAZ, where:
- C is a constant,
- Z is a coefficient that indicates how species richness changes with area.
- To analyze this relationship more easily, we can take the logarithm of both sides:
logS=logC+ZlogA
- This transformation allows us to express the relationship in a linear form.
- In this logarithmic form, if we plot logS (y-axis) against logA (x-axis), we expect to see a straight line.
- The slope of this line will be Z, and the y-intercept will be logC.
- Therefore, the relationship between species richness and area for a variety of taxa is represented as a straight line on a logarithmic scale.
The relation between species richness and area for a wide variety of taxa (angiosperm plants, birds, bats, freshwater fishes) is a straight line on a logarithmic scale.
Topper's Solved these Questions
Similar Questions
The relation between species richness and area for a wide variety of taxa turns out to be a rectangular hyperbola. Give a brief explanation.
View Solution
Study the above graph and answer the following questions -
(i) Identify x and y
(ii) The relation between species richness and area can be denoted as generally
(iii) The value of z lies in range of
(iv) On a log scale the relation between species richness and area is
View Solution
Knowledge Check
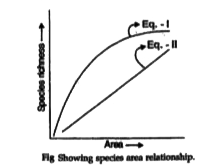
The great German naturalist and geographer Alexander von Humboldt observed that within a region species richness increased with increasing explored area, but only up to a limit. In fact, relation between species richness and area for a wide variety of taxa (angiosperm plants, birds, bats, freshwater fi ishes) turns out to be a rectangular hyperbola. Now find out correct equations shown in the graph.
 AI - S−CAZ II -LogS=logC+ZlogABI - LogS=logC+ZlogA, II - S−CAZCI - S−CAZ+logC, II - LogS=logC+ZlogADI - S−CAZ+logA, II - LogS=logC+ZlogA
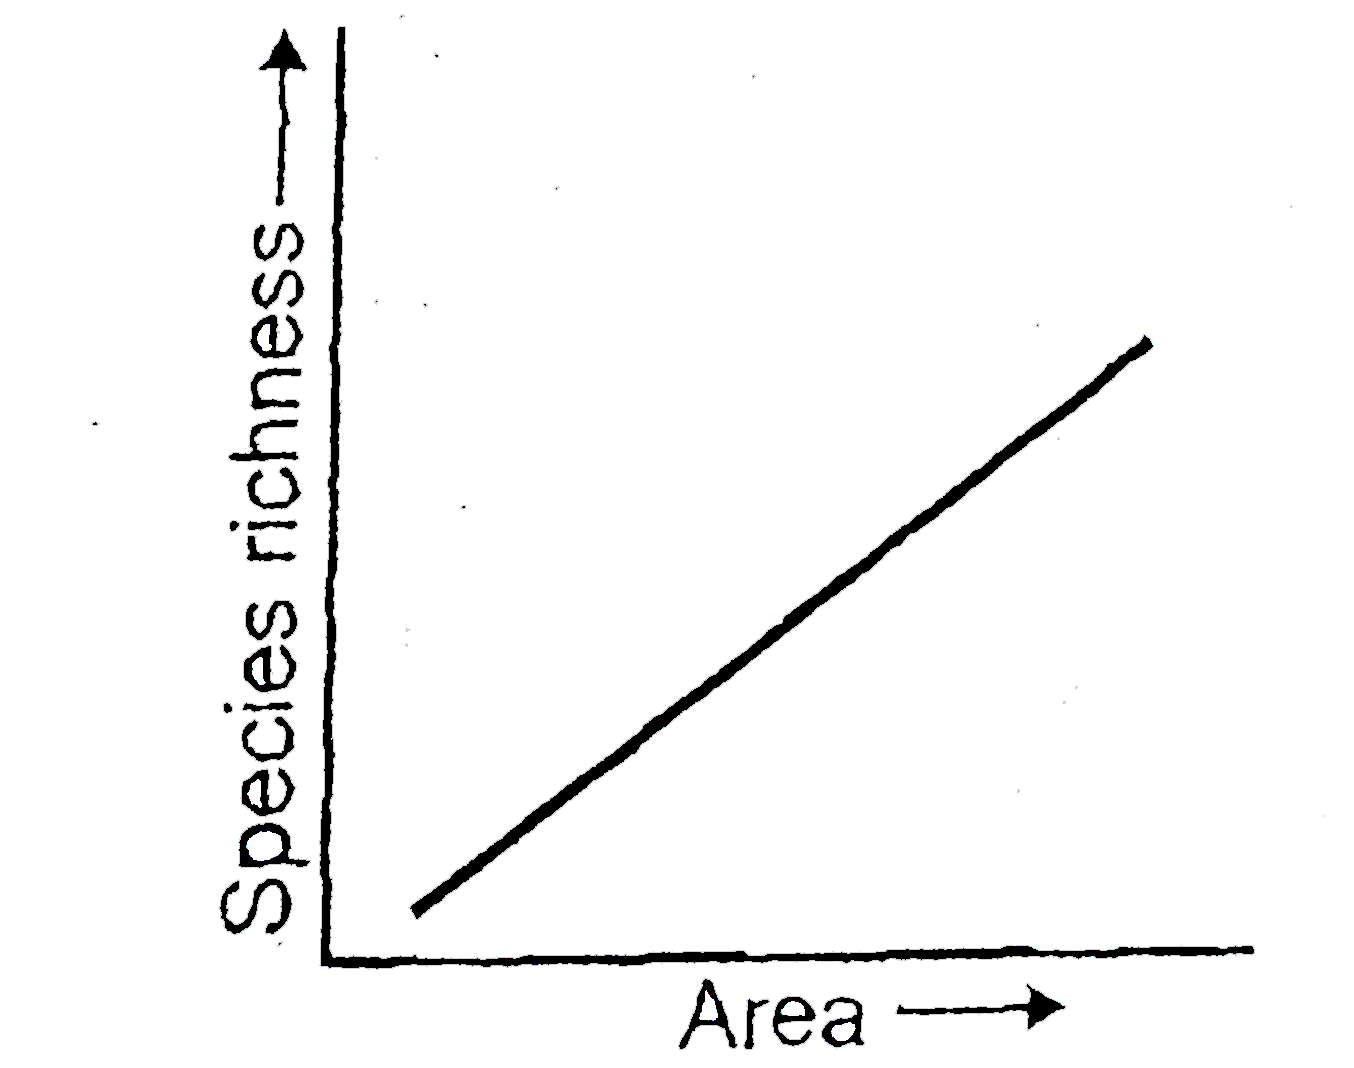
The graph formed by plotting species richness against area for a wide variety of taxa (angiosperm plants, birds , bats , fresh water fishes , etc) turns out to be a
AparabolaBstraight lineCRectangular hyperbolaDAny of the aboveThe relation between species richness and area is correctly depicted by
ALogS=logC−ZlogABLogS=ZlogACLogS=logC+ZlogADLogS=logC
Relationship between species richness (S) and area (A) represent in the following graph is described by the equation

View SolutionThe relation between specises richness and area is described on a logarithmic scale by the equation [where S = species richness, A = area, Z = slope of the line (regression coefficient ), C= Y - intercept]
View SolutionThe relation between specles richness and area Is described on a logarithmic scale by the equaton (where 8 - specles richness, A= area, Z = slope of the line (regression co-efficient), C=Y-Intercept].
View SolutionWhich of the statement are in accordance with the observation of geographer Alexander von Humboldt ?
I. Within a region species, richness increases with increasing explored area but within a limit.
II. The relation between species richness and area is a rectangular hyperbole.
III. The richness of species decreases with the increasing explored area.
IV. There is no relation between the explored area and species richness .
View SolutionAlexander von Humboldt gave the relationship between the species richness and its geographical area . Which of the following is the correct logarithmic equation for his findings ?
View Solution
