Consider two plots , where plot 'X' is having less species compared to plot 'Z', Select the true statement regarding X and Z .
Plot 'X' shows less year to year variation in total biomass
Plot 'Z' is less resistant to natural disturbance
Plot, 'X' has more productivity than plot 'X'
Plot 'Z' has more productivity then plot 'X'
The correct Answer is:D
To solve the question regarding the two plots X and Z, we need to analyze the information provided about the species composition and productivity of each plot.
1. Understanding the Plots:
- Plot X has fewer species compared to Plot Z.
- This implies that Plot Z has a higher species richness.
2. Analyzing Productivity:
- Generally, ecosystems with more species (like Plot Z) tend to have higher productivity. This is due to the complementary use of resources by different species, which can lead to more efficient energy capture and biomass production.
- Conversely, Plot X, with fewer species, is likely to have lower productivity.
3. Resistance to Disturbance:
- Ecosystems with higher biodiversity (like Plot Z) are often more resilient to disturbances. This means they can recover more quickly from environmental changes or disruptions.
- Plot X, with fewer species, may be less resilient and more susceptible to disturbances.
4. Year-to-Year Variation:
- While it is not directly stated, ecosystems with fewer species (like Plot X) may show less variation in total biomass year-to-year because they rely on fewer species to maintain biomass levels.
- However, this point is not clearly measurable without specific data.
5. Conclusion:
- Based on the analysis, the most accurate statement regarding the two plots is that Plot Z has higher productivity due to its greater species richness.
Final Answer:
The true statement regarding Plot X and Plot Z is that Plot Z has more productivity.
- Plot X has fewer species compared to Plot Z.
- This implies that Plot Z has a higher species richness.
- Generally, ecosystems with more species (like Plot Z) tend to have higher productivity. This is due to the complementary use of resources by different species, which can lead to more efficient energy capture and biomass production.
- Conversely, Plot X, with fewer species, is likely to have lower productivity.
- Ecosystems with higher biodiversity (like Plot Z) are often more resilient to disturbances. This means they can recover more quickly from environmental changes or disruptions.
- Plot X, with fewer species, may be less resilient and more susceptible to disturbances.
- While it is not directly stated, ecosystems with fewer species (like Plot X) may show less variation in total biomass year-to-year because they rely on fewer species to maintain biomass levels.
- However, this point is not clearly measurable without specific data.
- Based on the analysis, the most accurate statement regarding the two plots is that Plot Z has higher productivity due to its greater species richness.
The true statement regarding Plot X and Plot Z is that Plot Z has more productivity.
Topper's Solved these Questions
Similar Questions
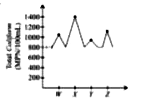
In a study, water samples of Yamuna river were collected from four different cities (W, X, Y and Z) to check the presence of Coliform bacteria. The result obtained was plotted in the given graph.
Select the incorrect statement regarding this.

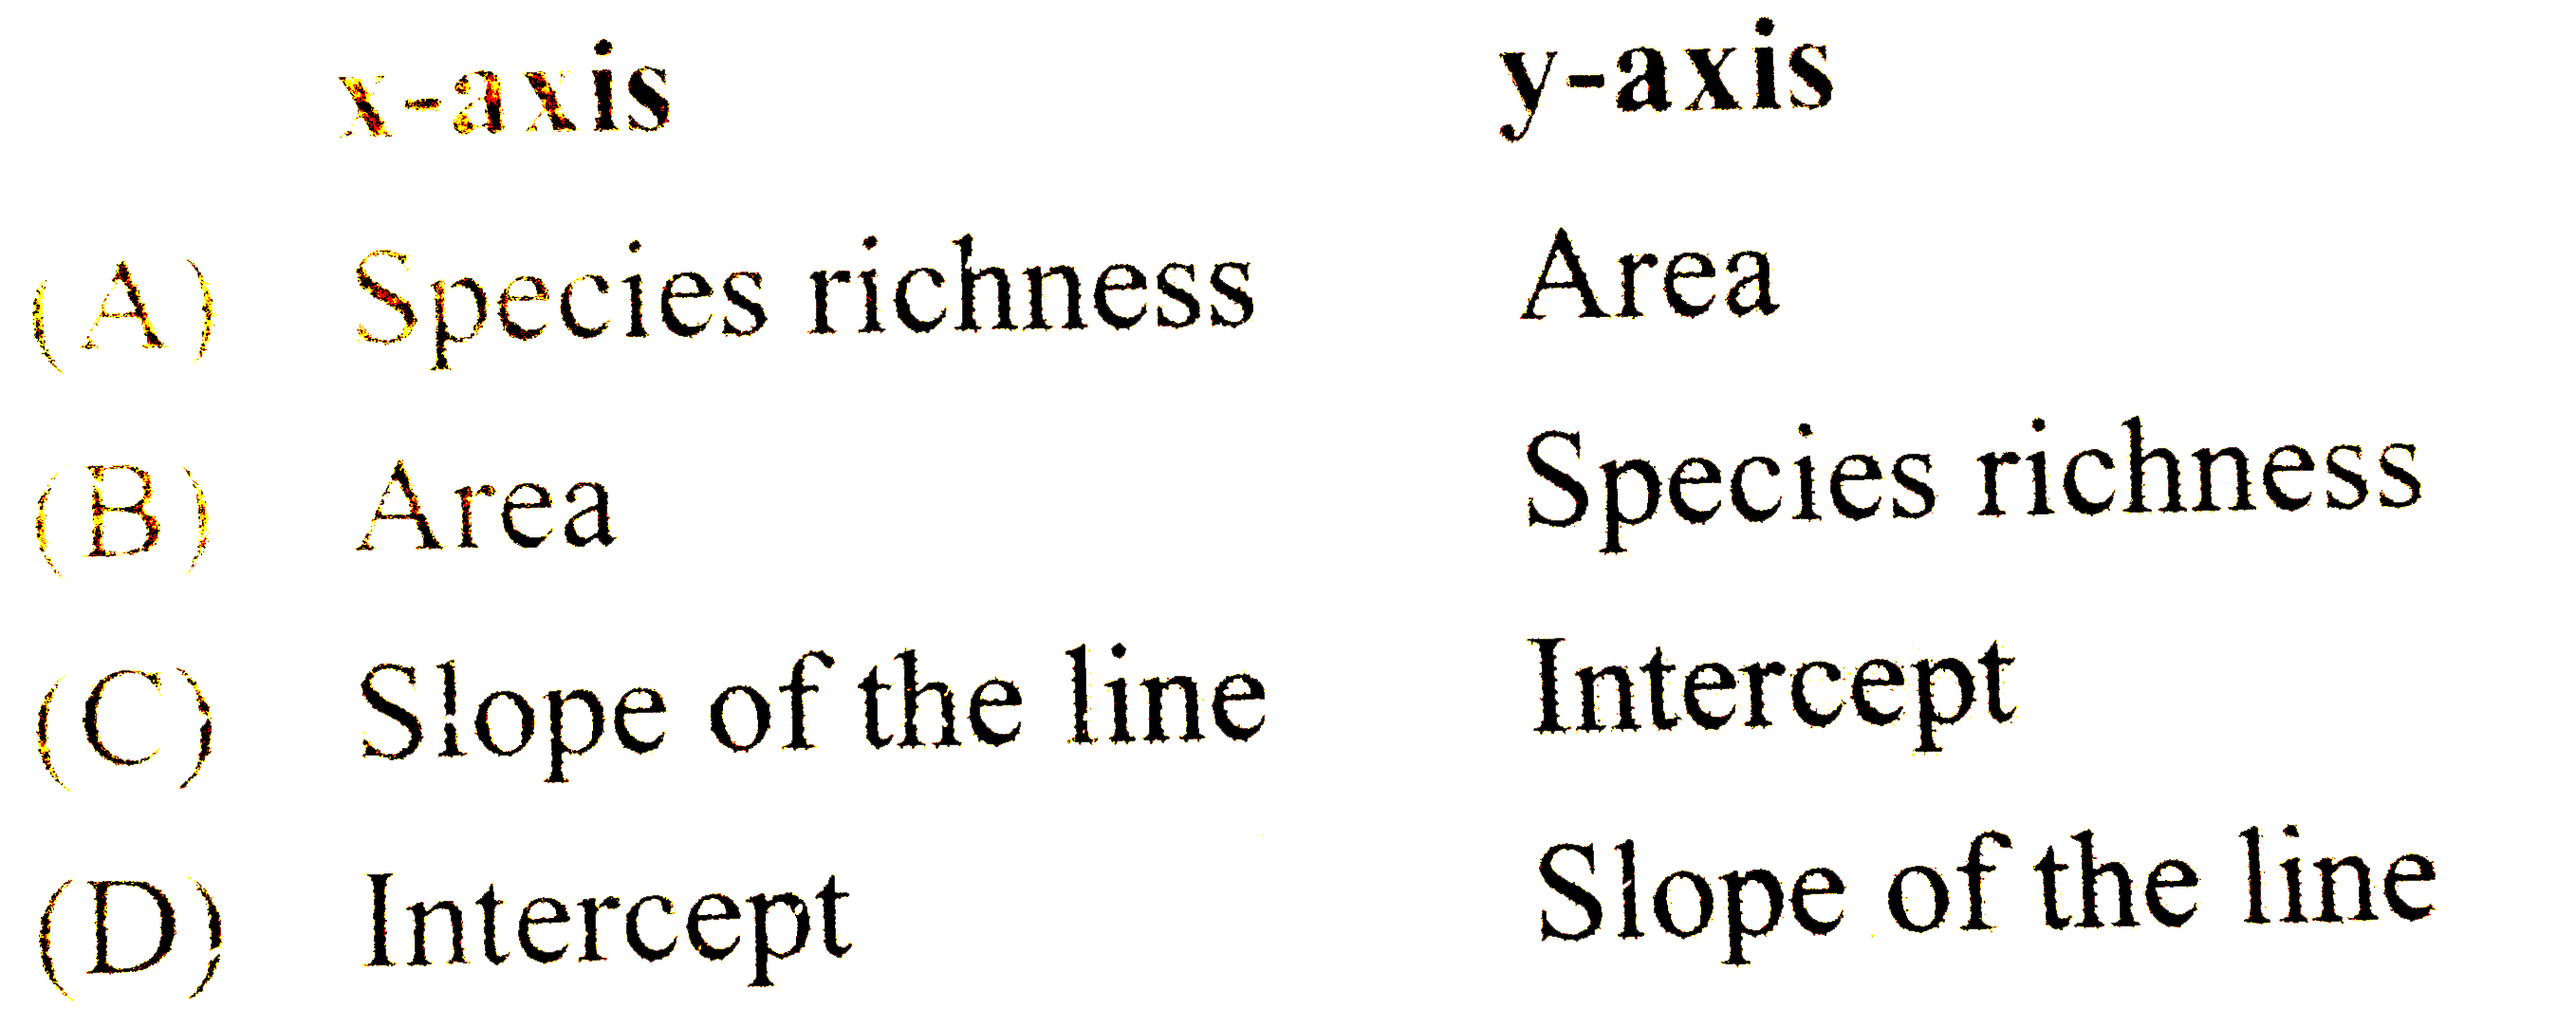
View SolutionIn the plot of the species-area relationship the x and y axess represents

View Solution
Knowledge Check
Among two plots, plot ' H' is having less species compared to plot 'K' . Identify the statement that is correct for plot H and plot K.
APlot 'X' shown less year tow year variation in total biomassBPlot 'K' is. less resistant to natural disturbanceCPlot 'H' has more productivity than plot 'K'DPlot 'K' has more productivity than plot 'H'The plot of √v vs Z is
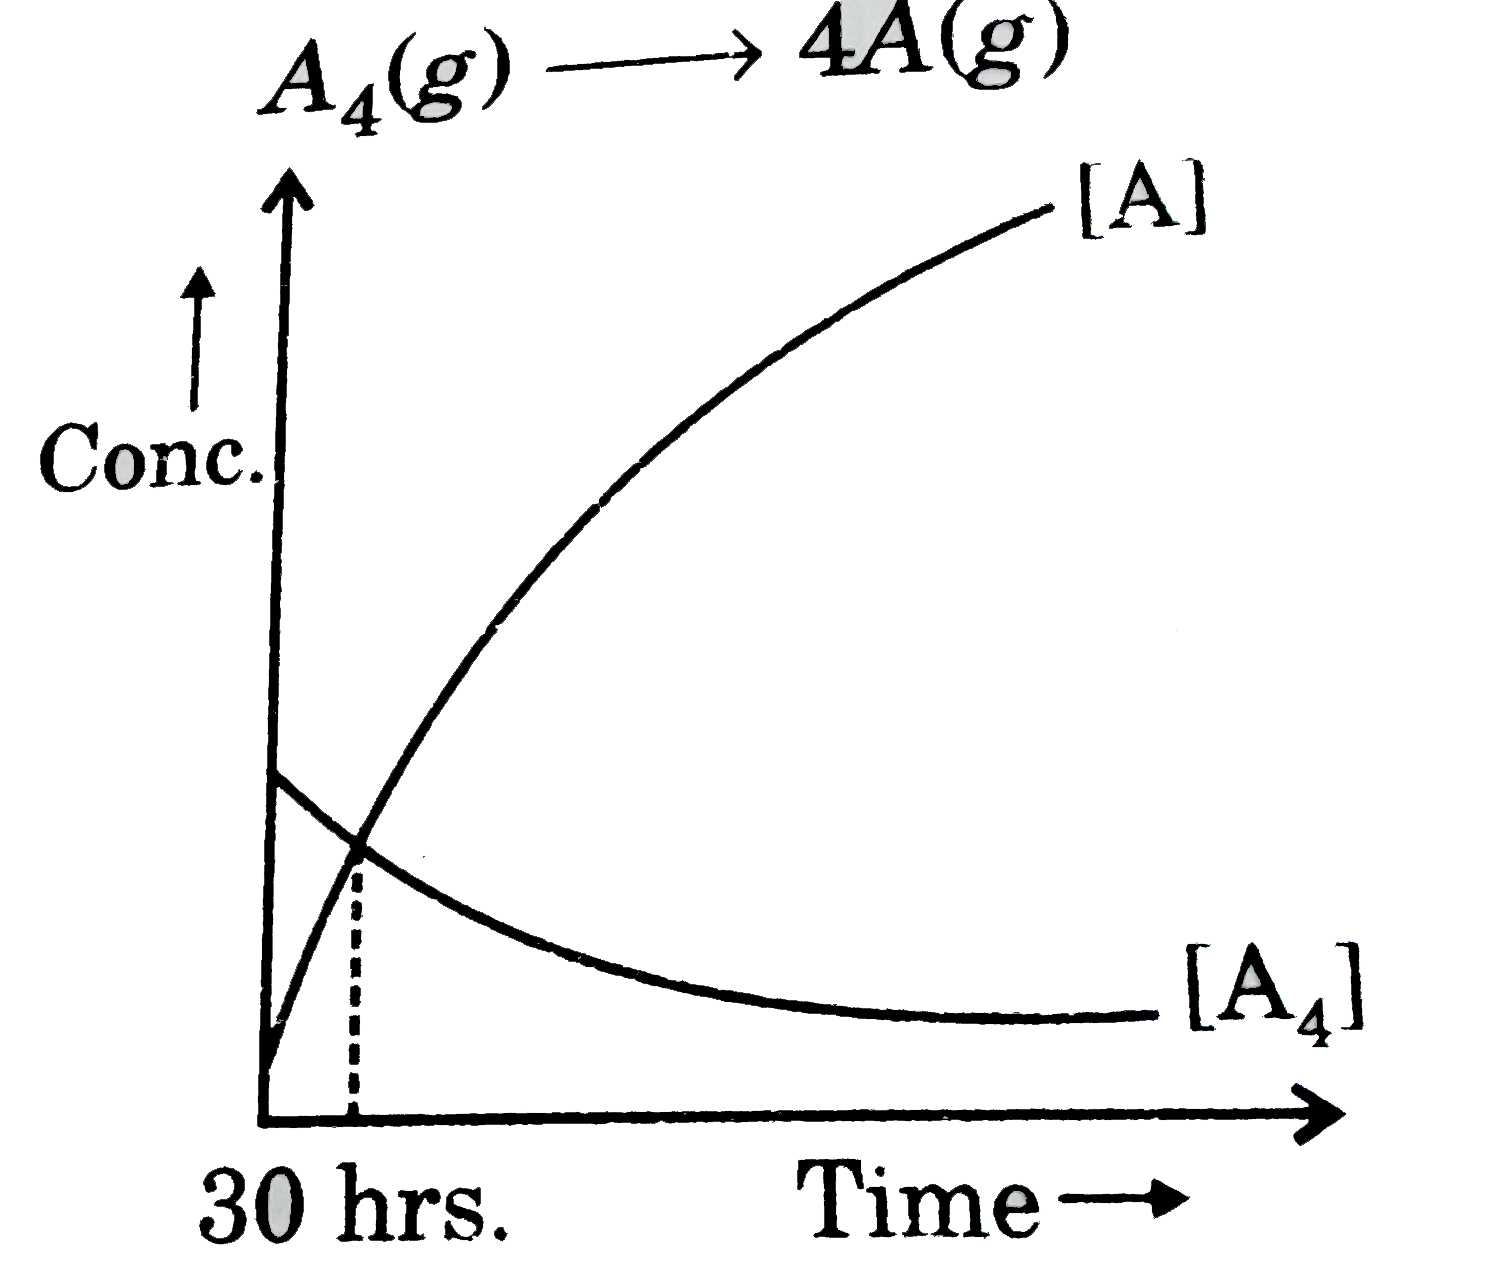
AStraight lineBExponential curveCHyperbolicDCurve with -ve slopeConsider the following first order decomposition and the accompanying concentration-time plot. Which of the following statements regarding the decomposition reaction is/are true?
 AAt 30 hrs, only 20% reaction is completeBHalf-life of the reaction is 90 hrs (approximately)CRate of decomposition decreasing linearly with timeDChanging initial concentration will changethe time at which the two curves are intersecting
Select the incorrect statements about the plots of ln K vs 1/T
View Solution
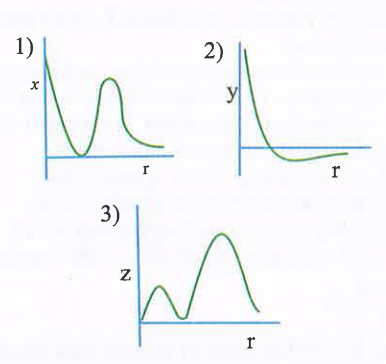
Plots for 2s orbital are
X, Y and Z respectively.
View SolutionCondider the following plots for 2s-orbital:
 x,y and z are respectively.
View SolutionAccording to Moseley, a straight line graph is obtained on plotting:
Where, v is frequency and Z is atomic number.
View SolutionA radicactive sample consider of two distinct species having equial number initially . The mean life time of one species is τ and that of the other is 5τ . The decay prodects in both cases are stable . A plot is made of the total number of radioactive nuclei as a function of time , which of the following figure best represent the from of this plot?
View Solution
