The daily wages (in) of 15 workers in a factory are given below
Arrange the above data in ascending order and prepare the frequency table
400,360,300,300,260,360,360,400,300,260,360,360,400,300,360
To solve the problem of arranging the daily wages of 15 workers in ascending order and preparing a frequency table, follow these steps:
1. List the Daily Wages:
The daily wages of the workers are:
400, 360, 300, 300, 260, 360, 360, 400, 300, 260, 360, 360, 400, 300, 360
2. Arrange the Data in Ascending Order:
To arrange the data in ascending order, we start from the smallest value to the largest:
- The smallest wage is 260.
- Next is 300.
- Then comes 360.
- Finally, the largest wage is 400.
Arranging these values gives us:
260, 260, 300, 300, 300, 300, 360, 360, 360, 360, 360, 360, 400, 400, 400
3. Count the Frequency of Each Wage:
Now we need to count how many times each wage appears in the arranged data:
- 260 appears 2 times.
- 300 appears 4 times.
- 360 appears 6 times.
- 400 appears 3 times.
4. Prepare the Frequency Table:
We will create a frequency table with two columns: one for the daily wages and one for their frequencies.
| Daily Wages (in Rupees) | Frequency |
|--------------------------|-----------|
| 260 | 2 |
| 300 | 4 |
| 360 | 6 |
| 400 | 3 |
Final Answer:
The frequency table for the daily wages of the workers is as follows:
| Daily Wages (in Rupees) | Frequency |
|--------------------------|-----------|
| 260 | 2 |
| 300 | 4 |
| 360 | 6 |
| 400 | 3 |
The daily wages of the workers are:
400, 360, 300, 300, 260, 360, 360, 400, 300, 260, 360, 360, 400, 300, 360
To arrange the data in ascending order, we start from the smallest value to the largest:
- The smallest wage is 260.
- Next is 300.
- Then comes 360.
- Finally, the largest wage is 400.
260, 260, 300, 300, 300, 300, 360, 360, 360, 360, 360, 360, 400, 400, 400
Now we need to count how many times each wage appears in the arranged data:
- 260 appears 2 times.
- 300 appears 4 times.
- 360 appears 6 times.
- 400 appears 3 times.
We will create a frequency table with two columns: one for the daily wages and one for their frequencies.
|--------------------------|-----------|
| 260 | 2 |
| 300 | 4 |
| 360 | 6 |
| 400 | 3 |
The frequency table for the daily wages of the workers is as follows:
|--------------------------|-----------|
| 260 | 2 |
| 300 | 4 |
| 360 | 6 |
| 400 | 3 |
Topper's Solved these Questions
- COLLECTION AND ORGANISATION OF DATA (MEAN, MEDIAN AND MODE)BOOK - RS AGGARWALCHAPTER - COLLECTION AND ORGANISATION OF DATA (MEAN, MEDIAN AND MODE)EXERCISE - EXERCISE 21B
10 Videos
- COLLECTION AND ORGANISATION OF DATA (MEAN, MEDIAN AND MODE)BOOK - RS AGGARWALCHAPTER - COLLECTION AND ORGANISATION OF DATA (MEAN, MEDIAN AND MODE)EXERCISE - EXERCISE 21C
5 Videos
- COLLECTION AND ORGANISATION OF DATA (MEAN, MEDIAN AND MODE)BOOK - RS AGGARWALCHAPTER - COLLECTION AND ORGANISATION OF DATA (MEAN, MEDIAN AND MODE)EXERCISE - SOLVED EXAMPLES
8 Videos
- BAR GRAPHSBOOK - RS AGGARWALCHAPTER - BAR GRAPHSEXERCISE - EXERCISE 22
22 Videos
- CONGRUENCEBOOK - RS AGGARWALCHAPTER - CONGRUENCEEXERCISE - EXERCISE
18 Videos
Similar Questions
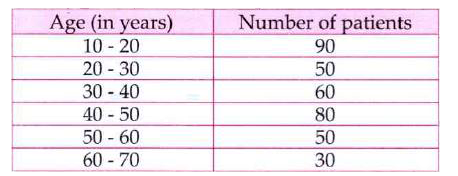
The ages (in years) of 360 patients treated in a hospital on a particular day are given below:

Draw a histogram for the given data.
View SolutionIn a hospital the ages of 360 patients for getting medical treatment on a day are as under:

Find the mean of given frequency distribution table
View Solution
Knowledge Check
400, 396, 392, 380, 360, 330, 288
A1. 380B2. 396C3. 400D4. 288
The following table gives the daily income of ten workers in a factory. Find the arithmetic mean.
WorkersABCDEFGHIJDaily Income(in Rs.)120150180200250300220350370260
View SolutionThe following table gives the daily income of ten workers in a factory. Find the arithmetic mean.
WorkersABCDEFGHIJDaily Income(in Rs.)120150180200250300220350370260
View SolutionThe size of land holdings of 380 families in a village is given below . Find the median size of land holdings.
Size of Land Holidings (in acres)Less than 100100−200200−300300−400400 and aboveNumber of Families 40 89 148 64 39
View SolutionHow many numbers greater than 10 lacs be formed from 2,3,0,3,4,2,3? 420 b. 360 c. 400 d. 300
View SolutionThe median of the following data is 525. Find the missing frequency, if it is given that there are 100 observations in the data: Class interval Frequency Class interval Frequency 0 100 2 500 600 20 100 200 5 600 700 f2 200 300 f1 700 800 9 300 400 12 800 900 7 400 500 17 900 1000 4
View SolutionFind the HCF and the LCM of 300, 360, 600.
View SolutionThe electricity bills (in rupees) of 25 houses of a certain locality for a month are given below:
324, 700, 617, 400, 356, 365, 435, 506, 548, 738, 780, 378, 570, 685, 312, 630, 584, 674, 754, 776, 596, 747, 565, 763, 472.
Arrange the above data in increasing order and form a frequency table using equal class intervals, starting from 300-400, where 400 is not included.
View Solution
