Reading the bar graph containing the no of boys out of 6000 students
Step by step video & image solution for Reading the bar graph containing the no of boys out of 6000 students by Maths experts to help you in doubts & scoring excellent marks in Class 14 exams.
Updated on:21/07/2023Similar Questions
Knowledge Check
In a class of 30 students, the average weight of boys is 20kg and the average weight of the girls is 25kg. The fraction of boys out of the total students of the class is :
A44320B44352C44289DData insufficientIn a class of 30 students, the average weight of boys is 20 kg and the average weight of the girls is 25 kg. The fraction of boys out of the total students of the class is :
A45B56C34Ddata insufficient
Reading of line graphs containing the no of girls in a three different school in a given period
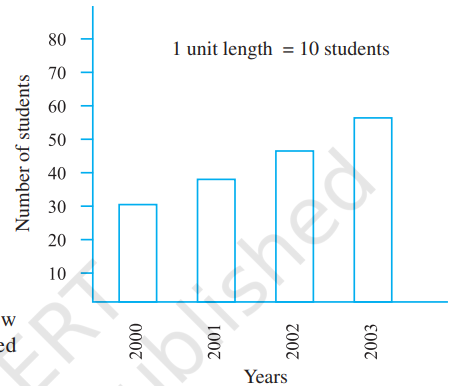
View SolutionRead the adjoining bar graph showing the number ofstudents in a particular class of a school. Answer thefollowing questions :(a) What is the scale of this graph?(b) How many new students are added every year?(c) Is the number of students in the year 2003 twice that in the year 2000?

View SolutionReading of line graphs containing the profit earned in different year by two company
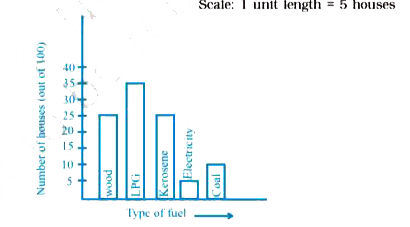
View SolutionThe following bar graph shows the number of houses (out of 100) in a town using different types of fuels for cooking.
Read the bar graph and answer the following questions:

How many houses are using coal as fuel?
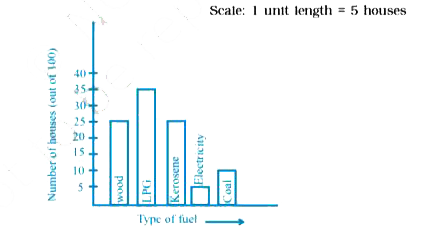
View SolutionThe following bar graph shows the number of houses (out of 100) in a town using different types of fuels for cooking.
Read the bar graph and answer the following questions:

Which fuel is used in maximum number of houses?
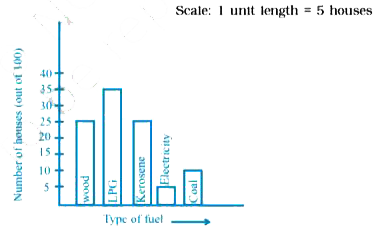
View SolutionThe following bar graph shows the number of houses (out of 100) in a town using different types of fuels for cooking.
Read the bar graph and answer the following questions:

Suppose that the total number of houses in the town is 1 lakh. From the above graph estimate the number of houses using electricity.
View Solution
