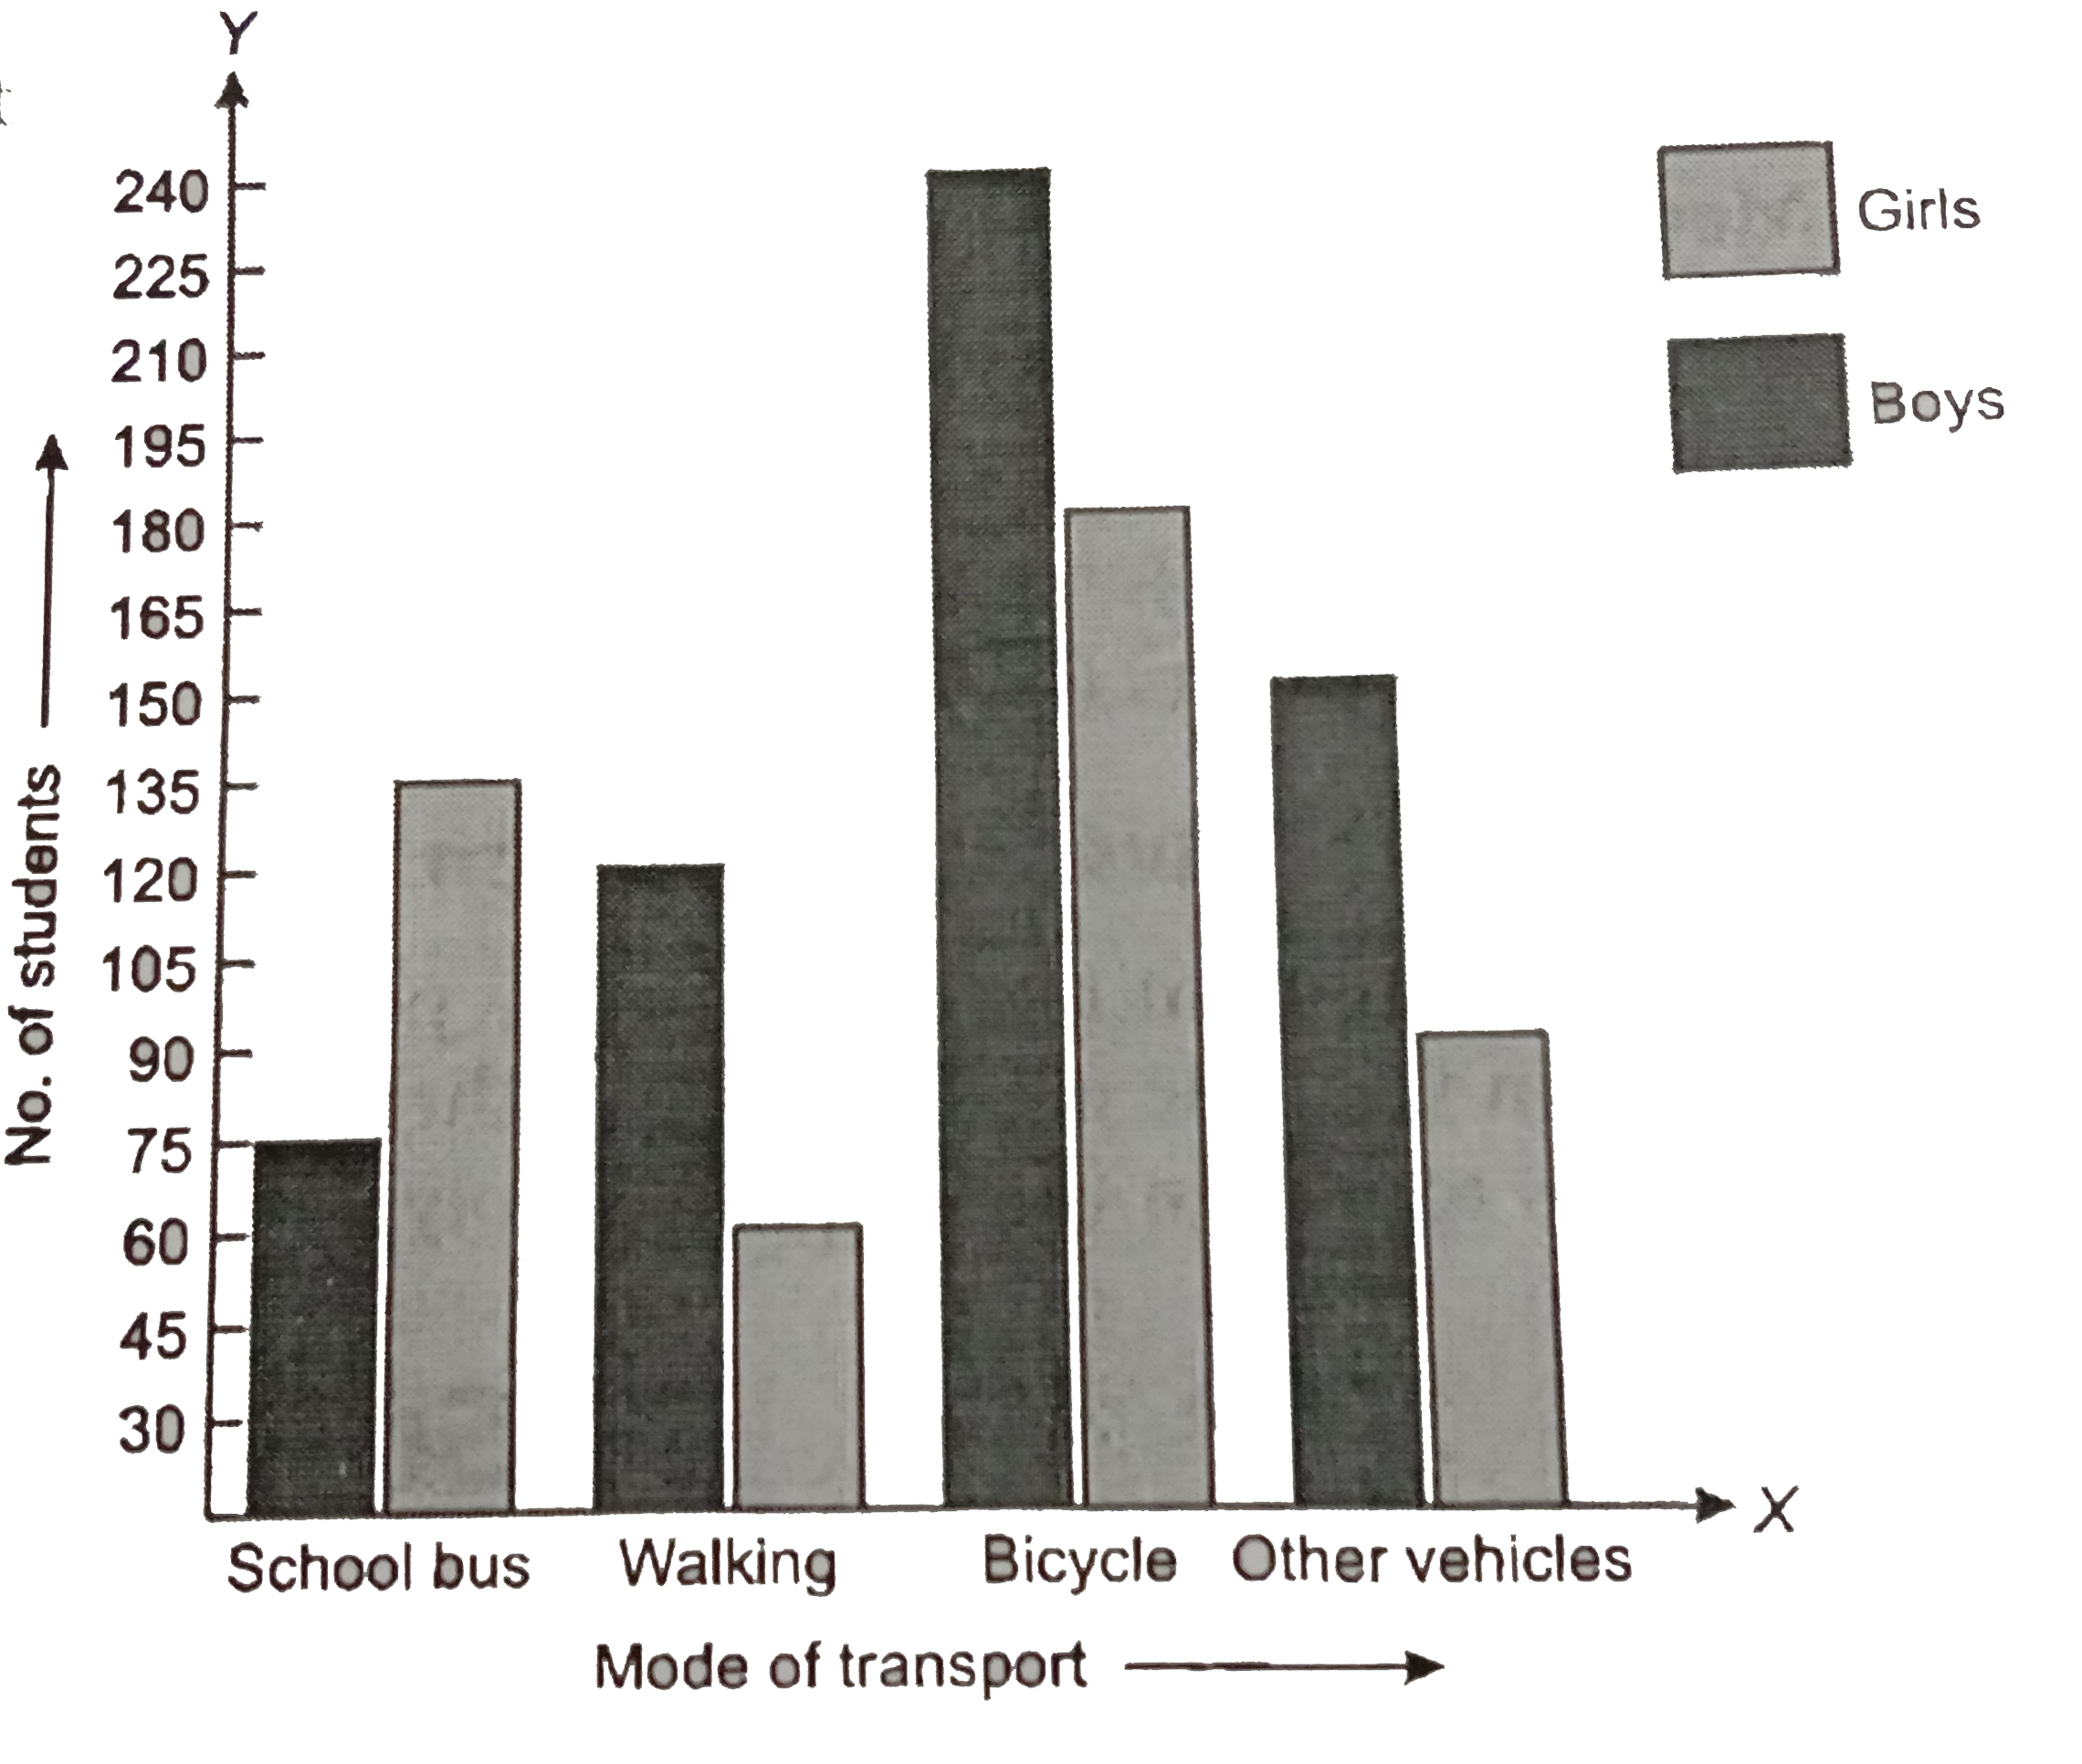
Given below is the data of school going students (boys and girls):

Draw the bar graph to represent the above data.
The Required bar graph is given :

Topper's Solved these Questions
- BOOK - NAGEEN PRAKASHANCHAPTER - STATISTICSEXERCISE - Problems From NCERT/exemplar22videos
STATISTICS
- BOOK - NAGEEN PRAKASHANCHAPTER - STATISTICSEXERCISE - Exercise 14a10videos
STATISTICS
- BOOK - NAGEEN PRAKASHANCHAPTER - QUADRILATERALSEXERCISE - Revision Exercise (long Answer Questions)5videos
QUADRILATERALS
- BOOK - NAGEEN PRAKASHANCHAPTER - SURFACE AREA AND VOLUMEEXERCISE - Revision Exercise (long Answer Questions)10videos
SURFACE AREA AND VOLUME
Similar Questions
Draw a pictograph to represent the data given below :
 View Solution
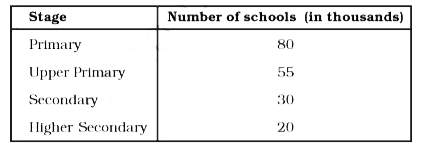
The following table gives the data of number of schools (stage-wise) of a country in the year 2002.

Draw a bar graph to represent the above data:View Solution70 students from a locality use different modes of transport to go to school as given below:

Draw the bar graph representing the above data.View Solution70 students from a locality use different modes of transport to go to school as given below:
 Draw the bar graph representing the above data.View Solution
The folliwng table shows the mode of transport used by boys and girls for going to the same school.

Draw a double bar graph representing the above data.View SolutionThe expenditure of a family of different heads in a month is given below

Draw a bar graph to represent the data above.View SolutionThe expenditure of a family of different heads in a month is given below

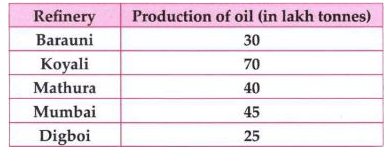
Draw a bar graph to represent the data above.View SolutionThe production of oil (in lakh tonnes) in some of the refineries in India during 2008 is given below :

Construct a bar graph to represent the above dataView SolutionThe population of four major cities in India in a particular year is given below: City: Mumbai Kolkata Delhi Chennai No. of Students: 120 130 150 80 Construct a bar graph to represent the above data.
View SolutionThe population of four major cities in India in a particular year is given below: City: Mumbai Kolkata Delhi Chennai No. of Students: 120 130 150 80 Construct a bar graph to represent the above data.
View Solution

