Reading of a pie chart for cost estimated by a family in renovation of their house
Step by step video & image solution for Reading of a pie chart for cost estimated by a family in renovation of their house by Maths experts to help you in doubts & scoring excellent marks in Class 14 exams.
Updated on:21/07/2023Similar Questions
Reading of pie-charts
View Solution(Questions 1 to 4): Study the following pie-chart carefully and answer the questions given below: Cost Estimated by a Family in Renovation of their House (FIGURE) What is the difference in the amount estimated by the family on interior decoration and that on architect’s fees? (a) Rs 10000 (b) Rs 9500 (c) Rs 7200 (d) Rs 9000 (e) None of these
View Solution
Knowledge Check
Study the chart and answer the question based, on the pie chart.
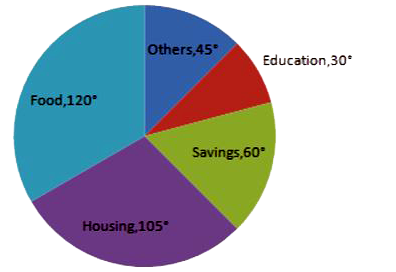
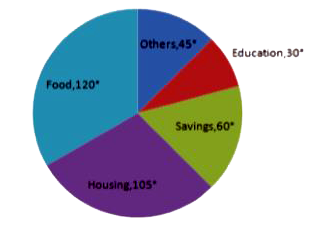
The pie chart given below shows expenditures incurred by a family on various items and savings in a month. Savings of the family is month. Savings of the family is ₹ 8,000 in a month.

How much more amount is spent on food than on housing ?A₹2,000B₹3,000C₹1,000D₹2,500Study the chart and answer the question based, on the pie chart.
The pie chart given below shows expenditures incurred by a family on various items and savings in a month. Savings of the family is ₹ 8,000 in a month.
 The ratio of the expenditure on food to the saving is : A2:1B3:4C3:2D4:3
What is a pie chart ?
View SolutionReading of a pie chart for the ratio of 2 mobile phones in different months
View SolutionOther than getting the discount of 12% on the estimated cost of furniture and the actual miscellaneous expenditure being Rs 10200 instead of the estimated one, the family’s estimated cost is correct. What is the total amount spend by the family in renovating its house? (a) Rs 116728 (b) Rs 115926 (c) Rs 119500 (d) Rs 116500 (e) None of these
View SolutionReading of pie chart for the % wise distribution of lectures in different subjects
View SolutionReading of pie chart for the angle wise distribution of different crops
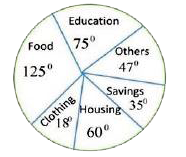
View SolutionThe following pie-chart shows the monthly expenditure incurred by a family on various items , and their , and their savings . Study the chart and answer the question that follows.

If the expenditure on education is ₹ 2,700 more than on housing , then the total expenditure on food and clothing is :
View Solution
