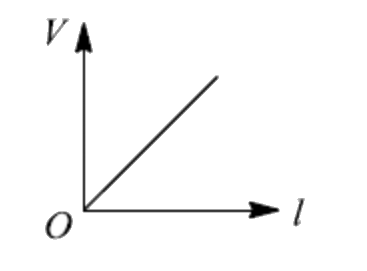
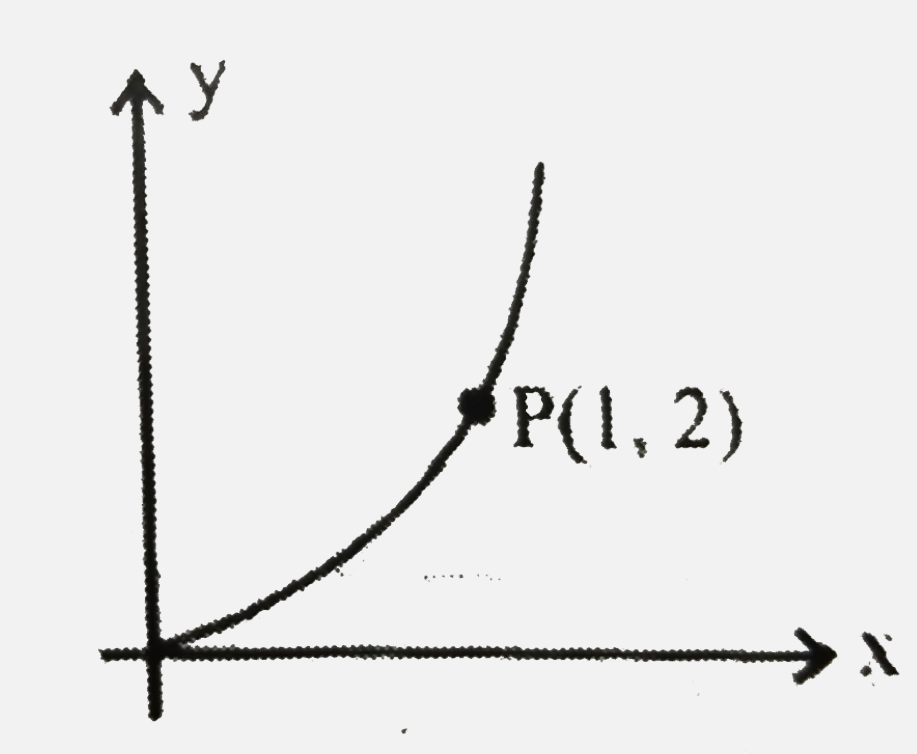
The equation of graph shown in figure is y=2x2. The slope of graph at point P is :
40√2N
20√2N
10√2N
15√2N
Step by step video & image solution for The equation of graph shown in figure is y=2x^(2). The slope of graph at point P is : by Physics experts to help you in doubts & scoring excellent marks in Class 12 exams.
Updated on:21/07/2023Topper's Solved these Questions
- LAWS OF MOTIONBOOK - AAKASH INSTITUTECHAPTER - LAWS OF MOTIONEXERCISE - Assignment (SECTION-A)
65 Videos
- LAWS OF MOTIONBOOK - AAKASH INSTITUTECHAPTER - LAWS OF MOTIONEXERCISE - Assignment (SECTION-B)
44 Videos
- LAWS OF MOTIONBOOK - AAKASH INSTITUTECHAPTER - LAWS OF MOTIONEXERCISE - Example
24 Videos
- KINETIC THEORYBOOK - AAKASH INSTITUTECHAPTER - KINETIC THEORYEXERCISE - EXERCISE (ASSIGNMENT) SECTION - D Assertion - Reason Type Questions
10 Videos
- MAGNETISM AND MATTER BOOK - AAKASH INSTITUTECHAPTER - MAGNETISM AND MATTER EXERCISE - ASSIGNMENT (SECTION D)
26 Videos
Similar Questions
Knowledge Check
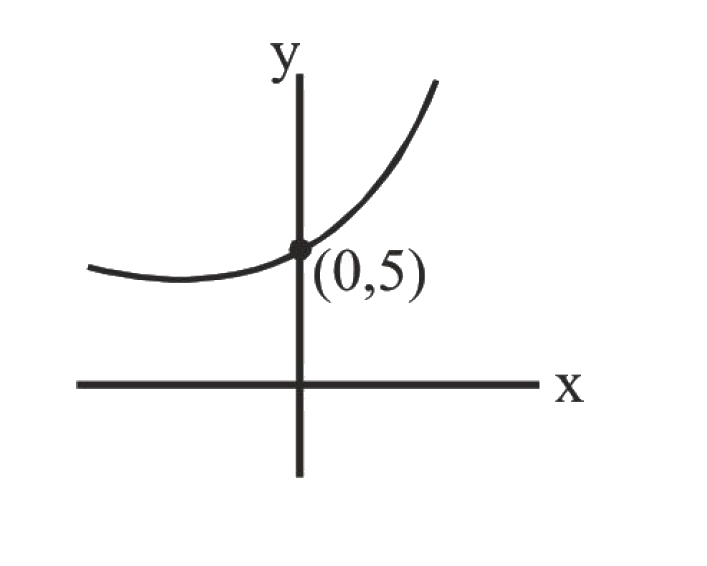
If the equation for graph shown in figure is y=aex then value of a is:-A−5B5C1Dcannot be determinedFor the shown graph slope of graph from point A to point B :
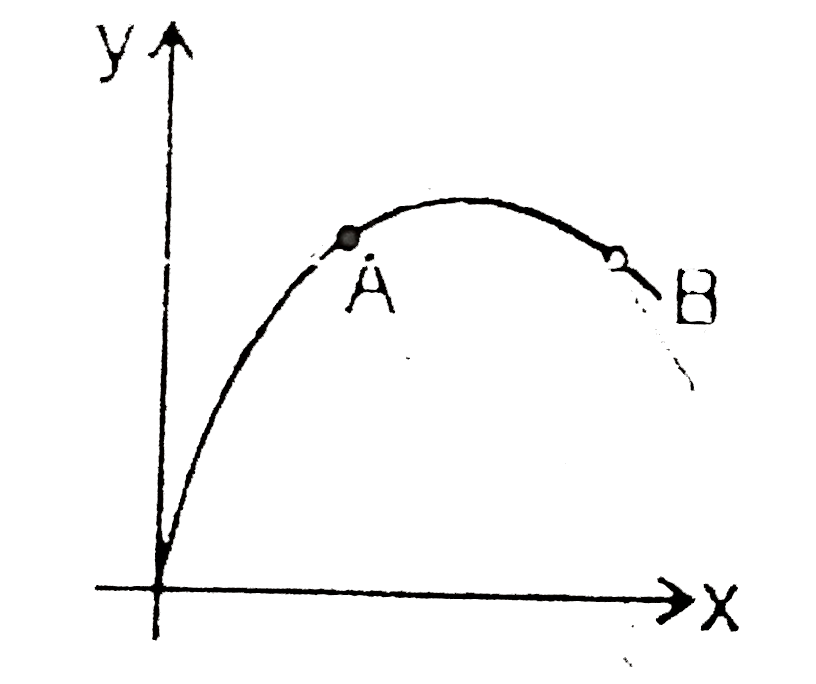 AContinuously decreasesBContinuously increasesCFirst increases then decreasesDFirst decreases then increases
The acceleration - velocity graph of a particle moving in a straight line is shown in figure. Then the slope of the velocity- displacement graph
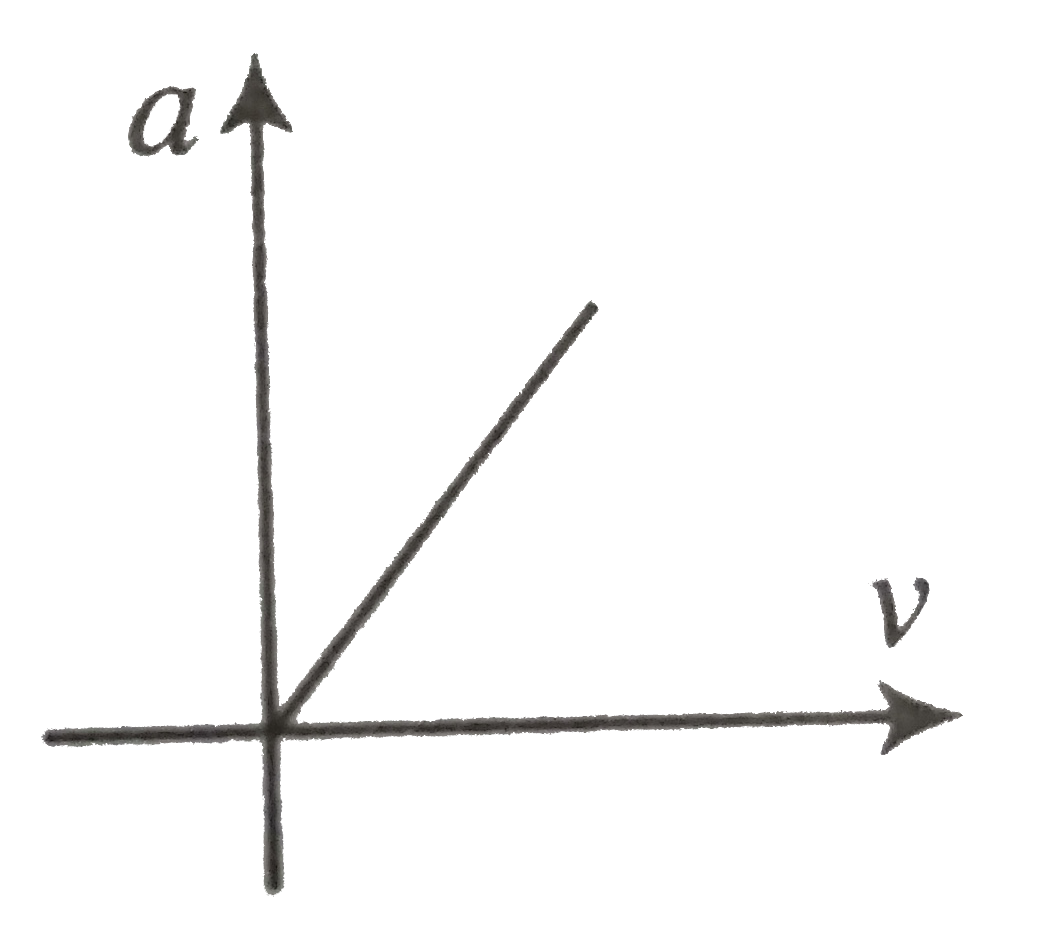 Aincreases linearlyBdecreases linearlyCis constantDincreases parabolically
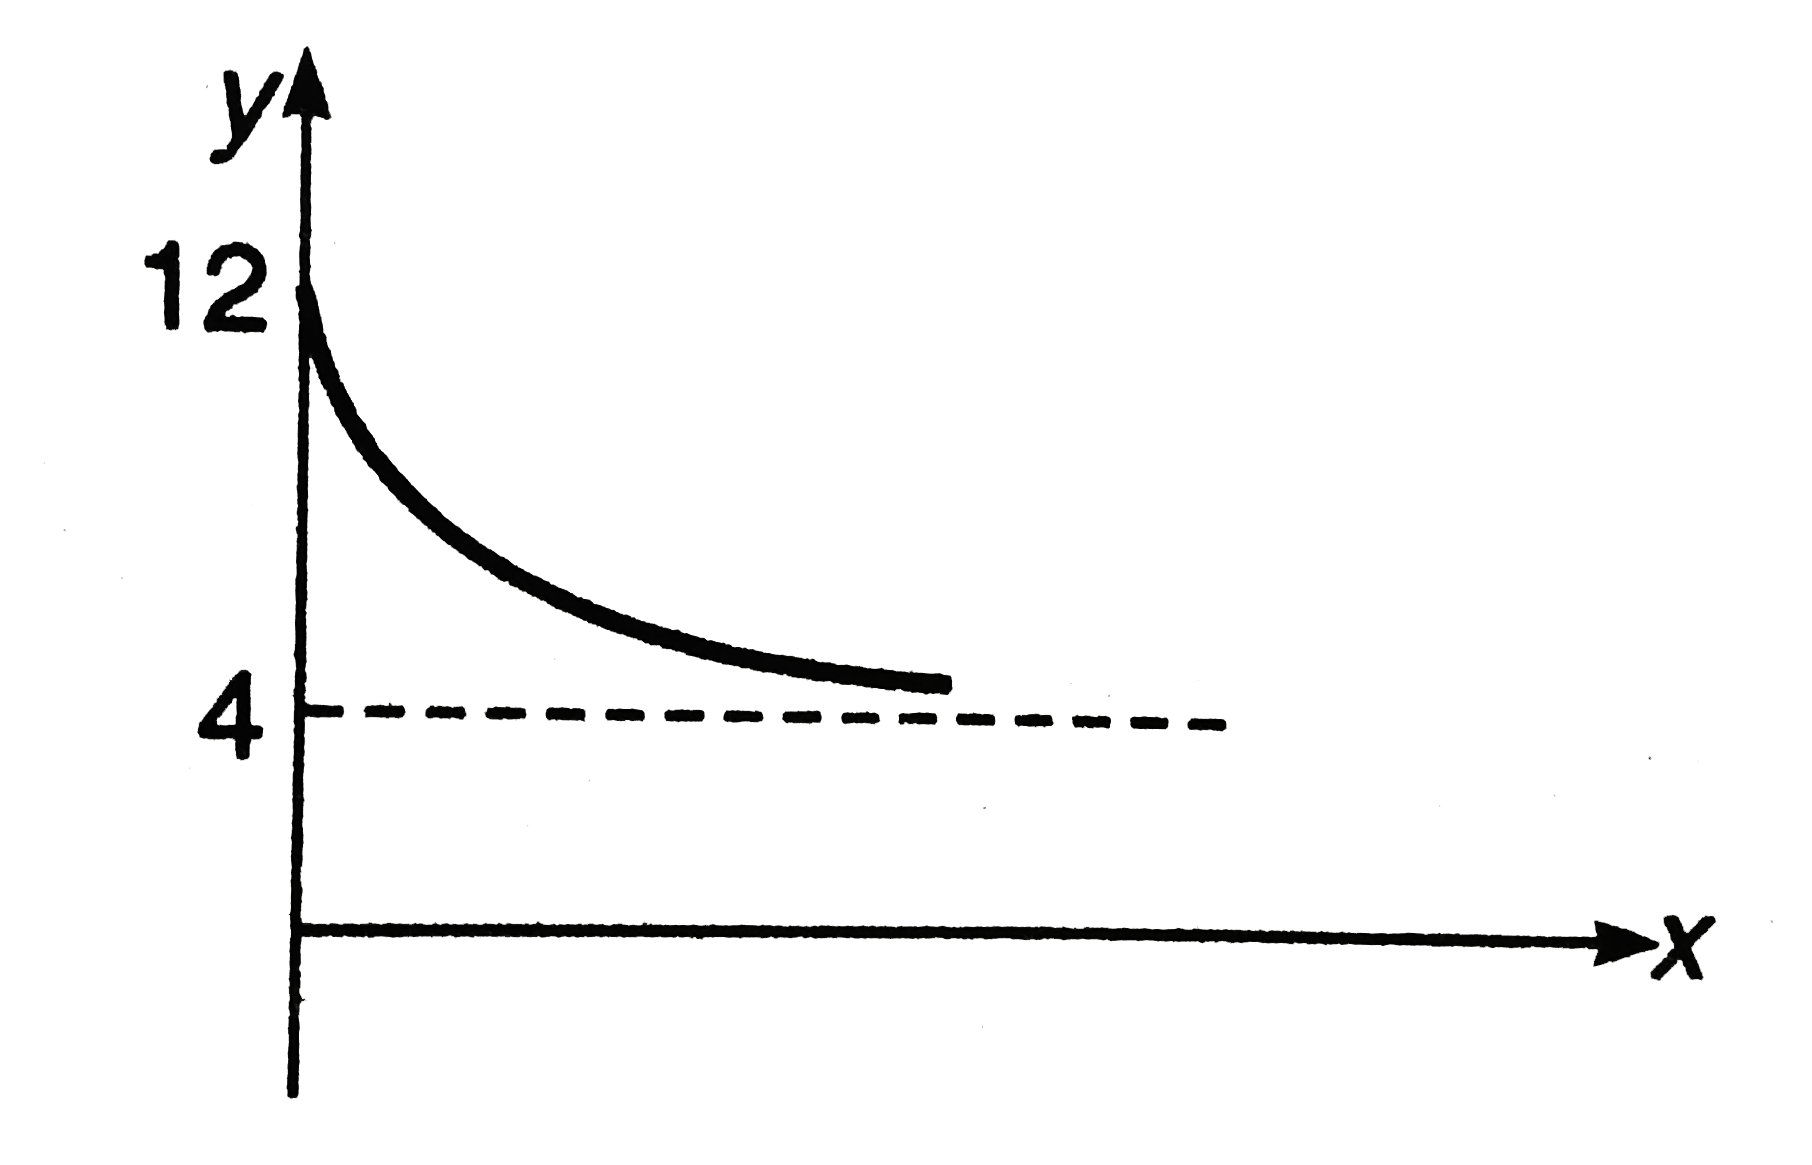
The graph shown in figure is exponential. Write down the equation corresponding to the graph.
View Solution(a) The velocity time graph of two bodies are shown in Figure. Slope of the graph for body A is positive. What does it signify ?
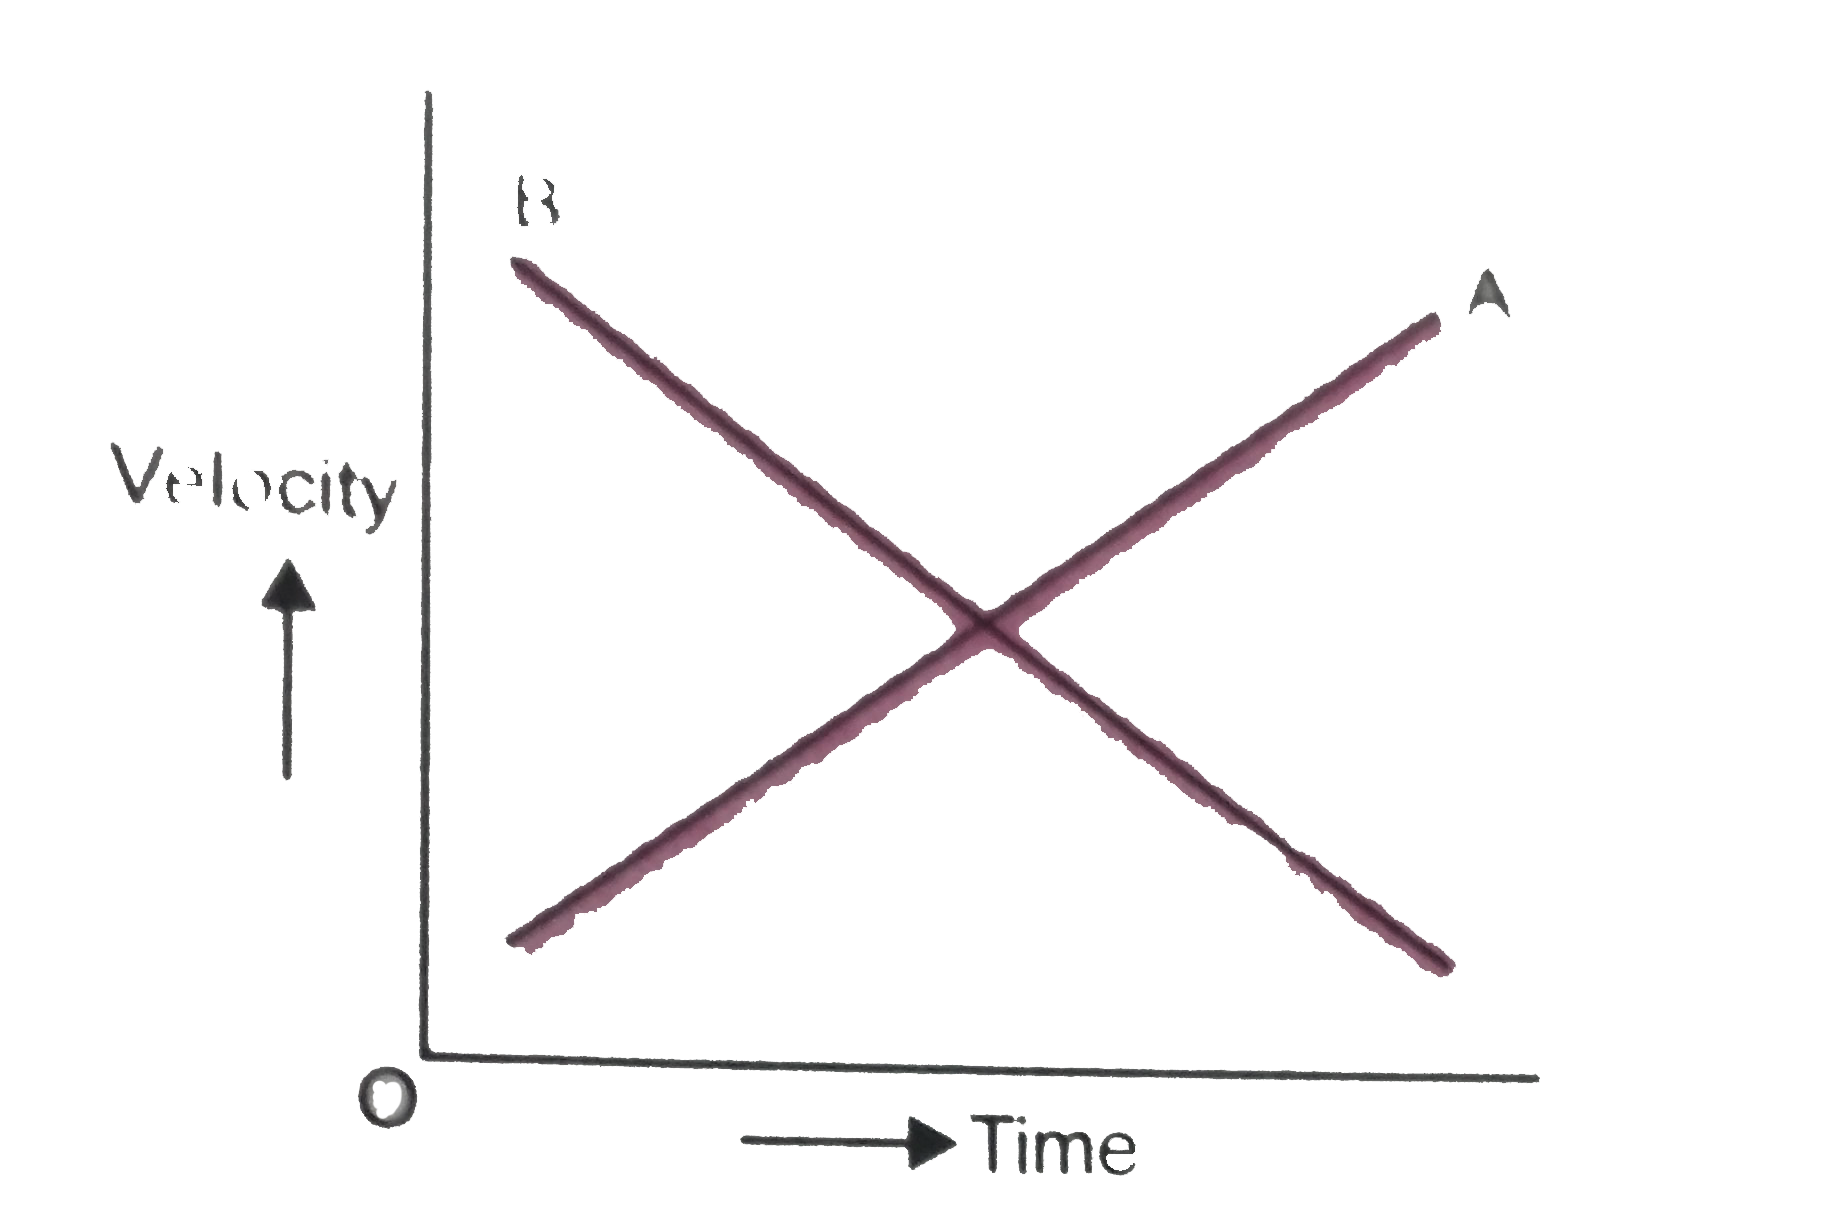
(b) The slope of velocity time graph of body B is negative. What does it represent ?
View SolutionThe graph of the function y=f(x) is as shown in the figure.
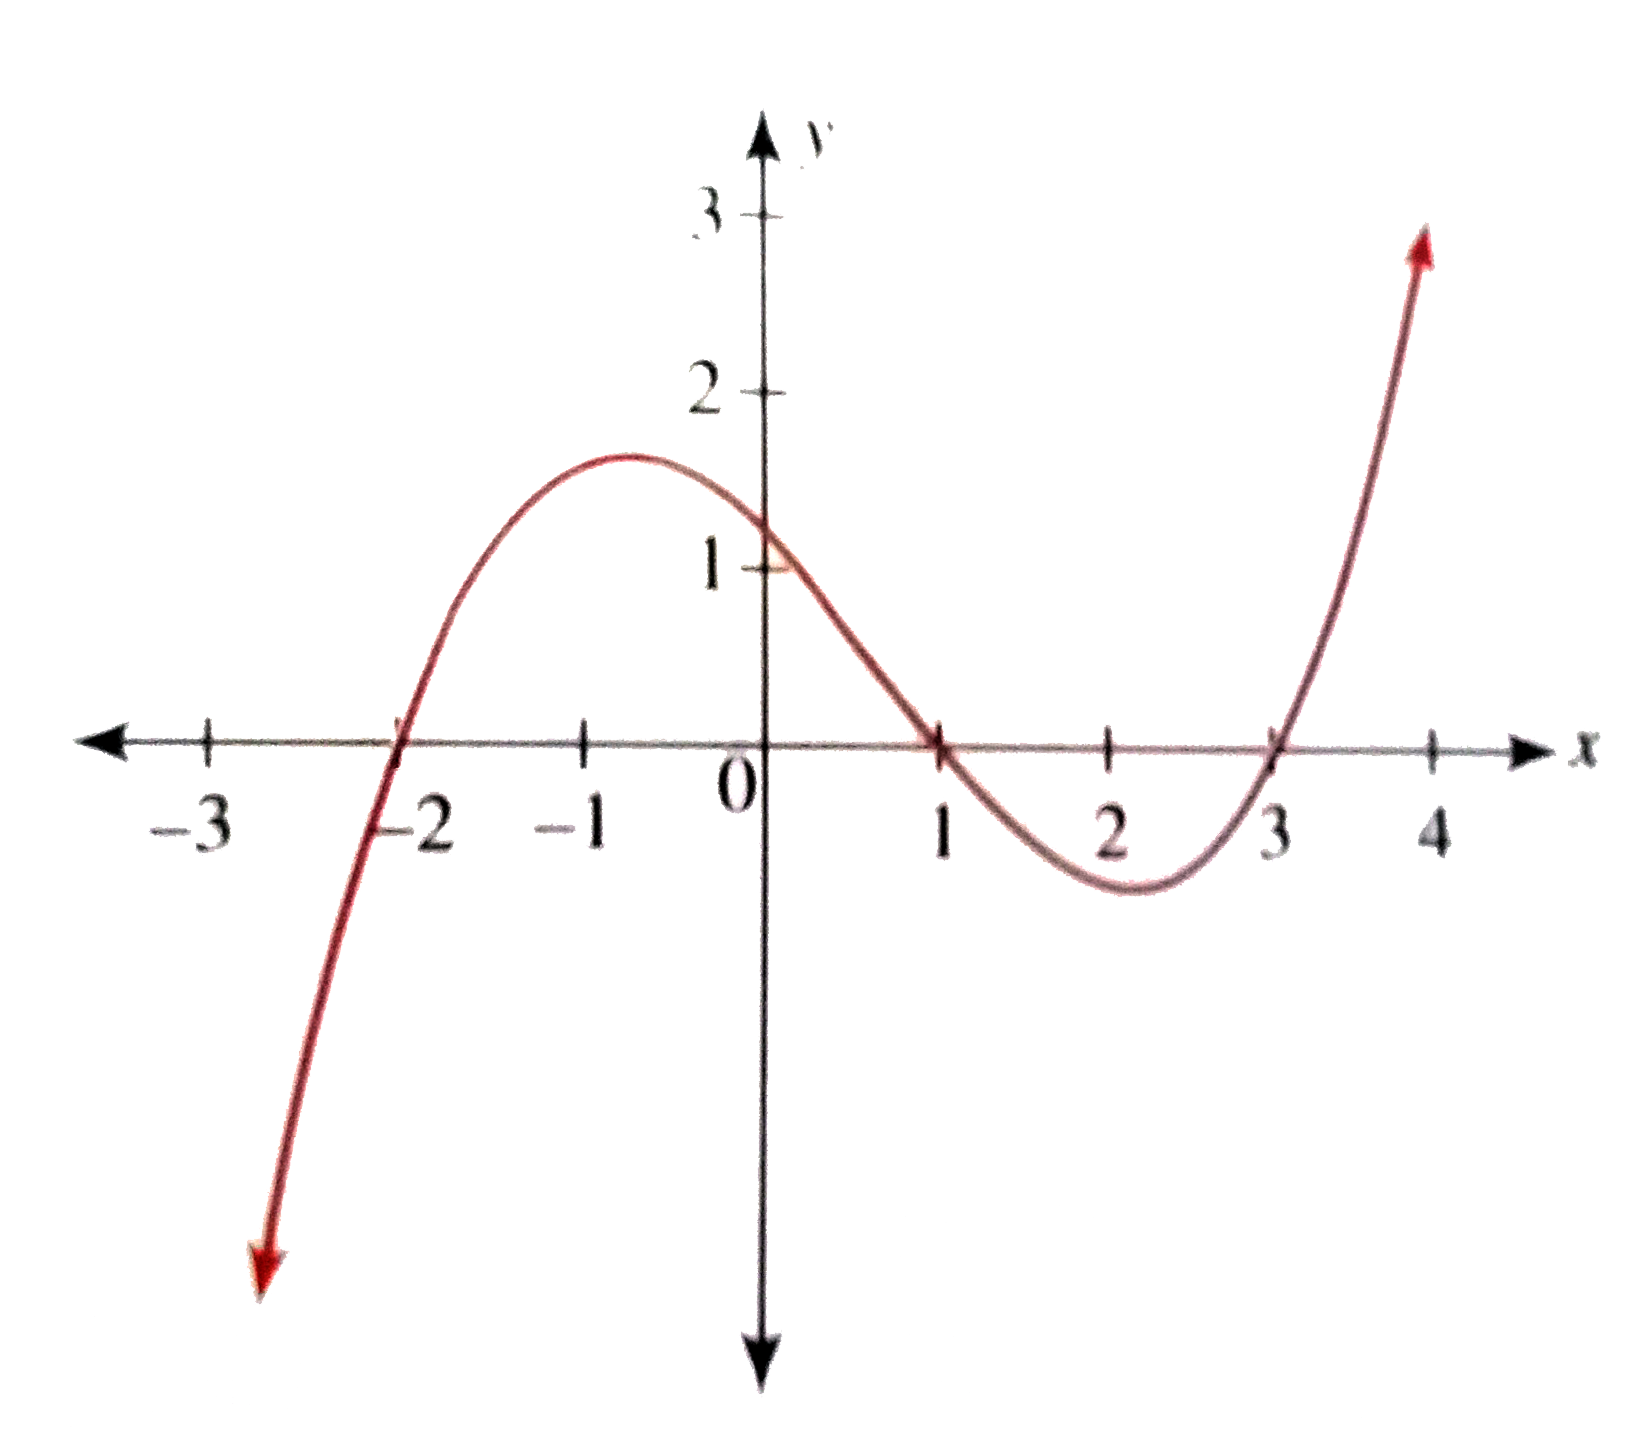
Then draw the graphs of
(i) |y|=sgn(f(x)) (ii) |y|=|f(x∣)|
(iii) y=xsgn(f(x))
View SolutionThe x-t graph of a particle moving along a straight line is shown in figure
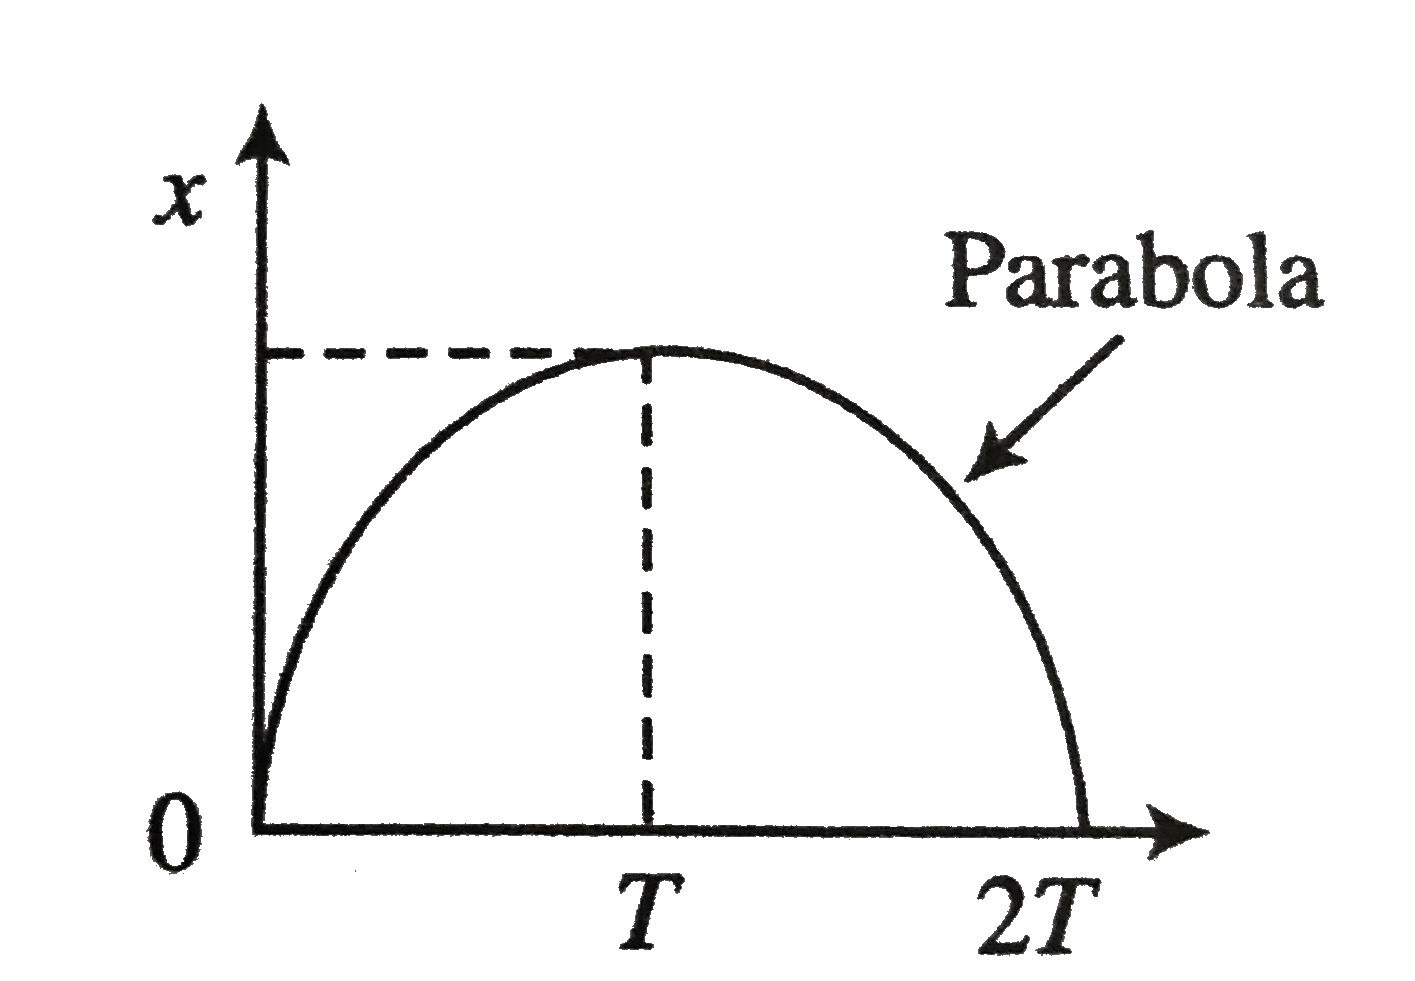
The speed-time graph of the particle is correctly shown by
View SolutionThe x-t graph of a particle moving along a straight line is shown in figure

The v-t graph of the particle is correctly shown by
View Solution

