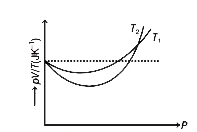
The figure shows the plot of PVnT vs P, for oxygen gas at two different temperatures then
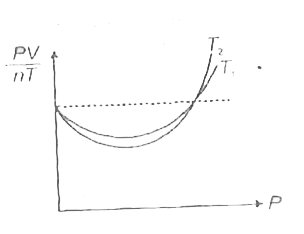
T1>T2
T2>T1
T1=T2
may be (1) & (2)
The correct Answer is:A
Step by step video, text & image solution for The figure shows the plot of (PV)/(nT) vs P, for oxygen gas at two different temperatures then by Physics experts to help you in doubts & scoring excellent marks in Class 12 exams.
Topper's Solved these Questions
- BOOK - AAKASH INSTITUTECHAPTER - KINETIC THEORYEXERCISE - EXERCISE (ASSIGNMENT) SECTION - A Objective Type Questions30videos
KINETIC THEORY
- BOOK - AAKASH INSTITUTECHAPTER - KINETIC THEORYEXERCISE - EXERCISE (ASSIGNMENT) SECTION - B Objective Type Questions30videos
KINETIC THEORY
- BOOK - AAKASH INSTITUTECHAPTER - KINETIC THEORYEXERCISE - EXERCISE (TRY YOURSELF)40videos
KINETIC THEORY
- BOOK - AAKASH INSTITUTECHAPTER - GRAVITATION EXERCISE - ASSIGNMENT SECTION - D (ASSERTION-REASON TYPE QUESTIONS)16videos
GRAVITATION
- BOOK - AAKASH INSTITUTECHAPTER - LAWS OF MOTIONEXERCISE - Assignment (SECTION-D) (Assertion-Reason Type Questions)15videos
LAWS OF MOTION
Similar Questions
Figure shows plot of PV/T versus Pfor1.00×10−3 kg of oxygen gas at two different temperatures.
(i) What does the dotted plot signify?
(ii) Which is true . T1>T2orT1<T2?
(iii) What is the value of PV/T where the curves meet on the y-axis?_E01_262_Q01.png) View Solution
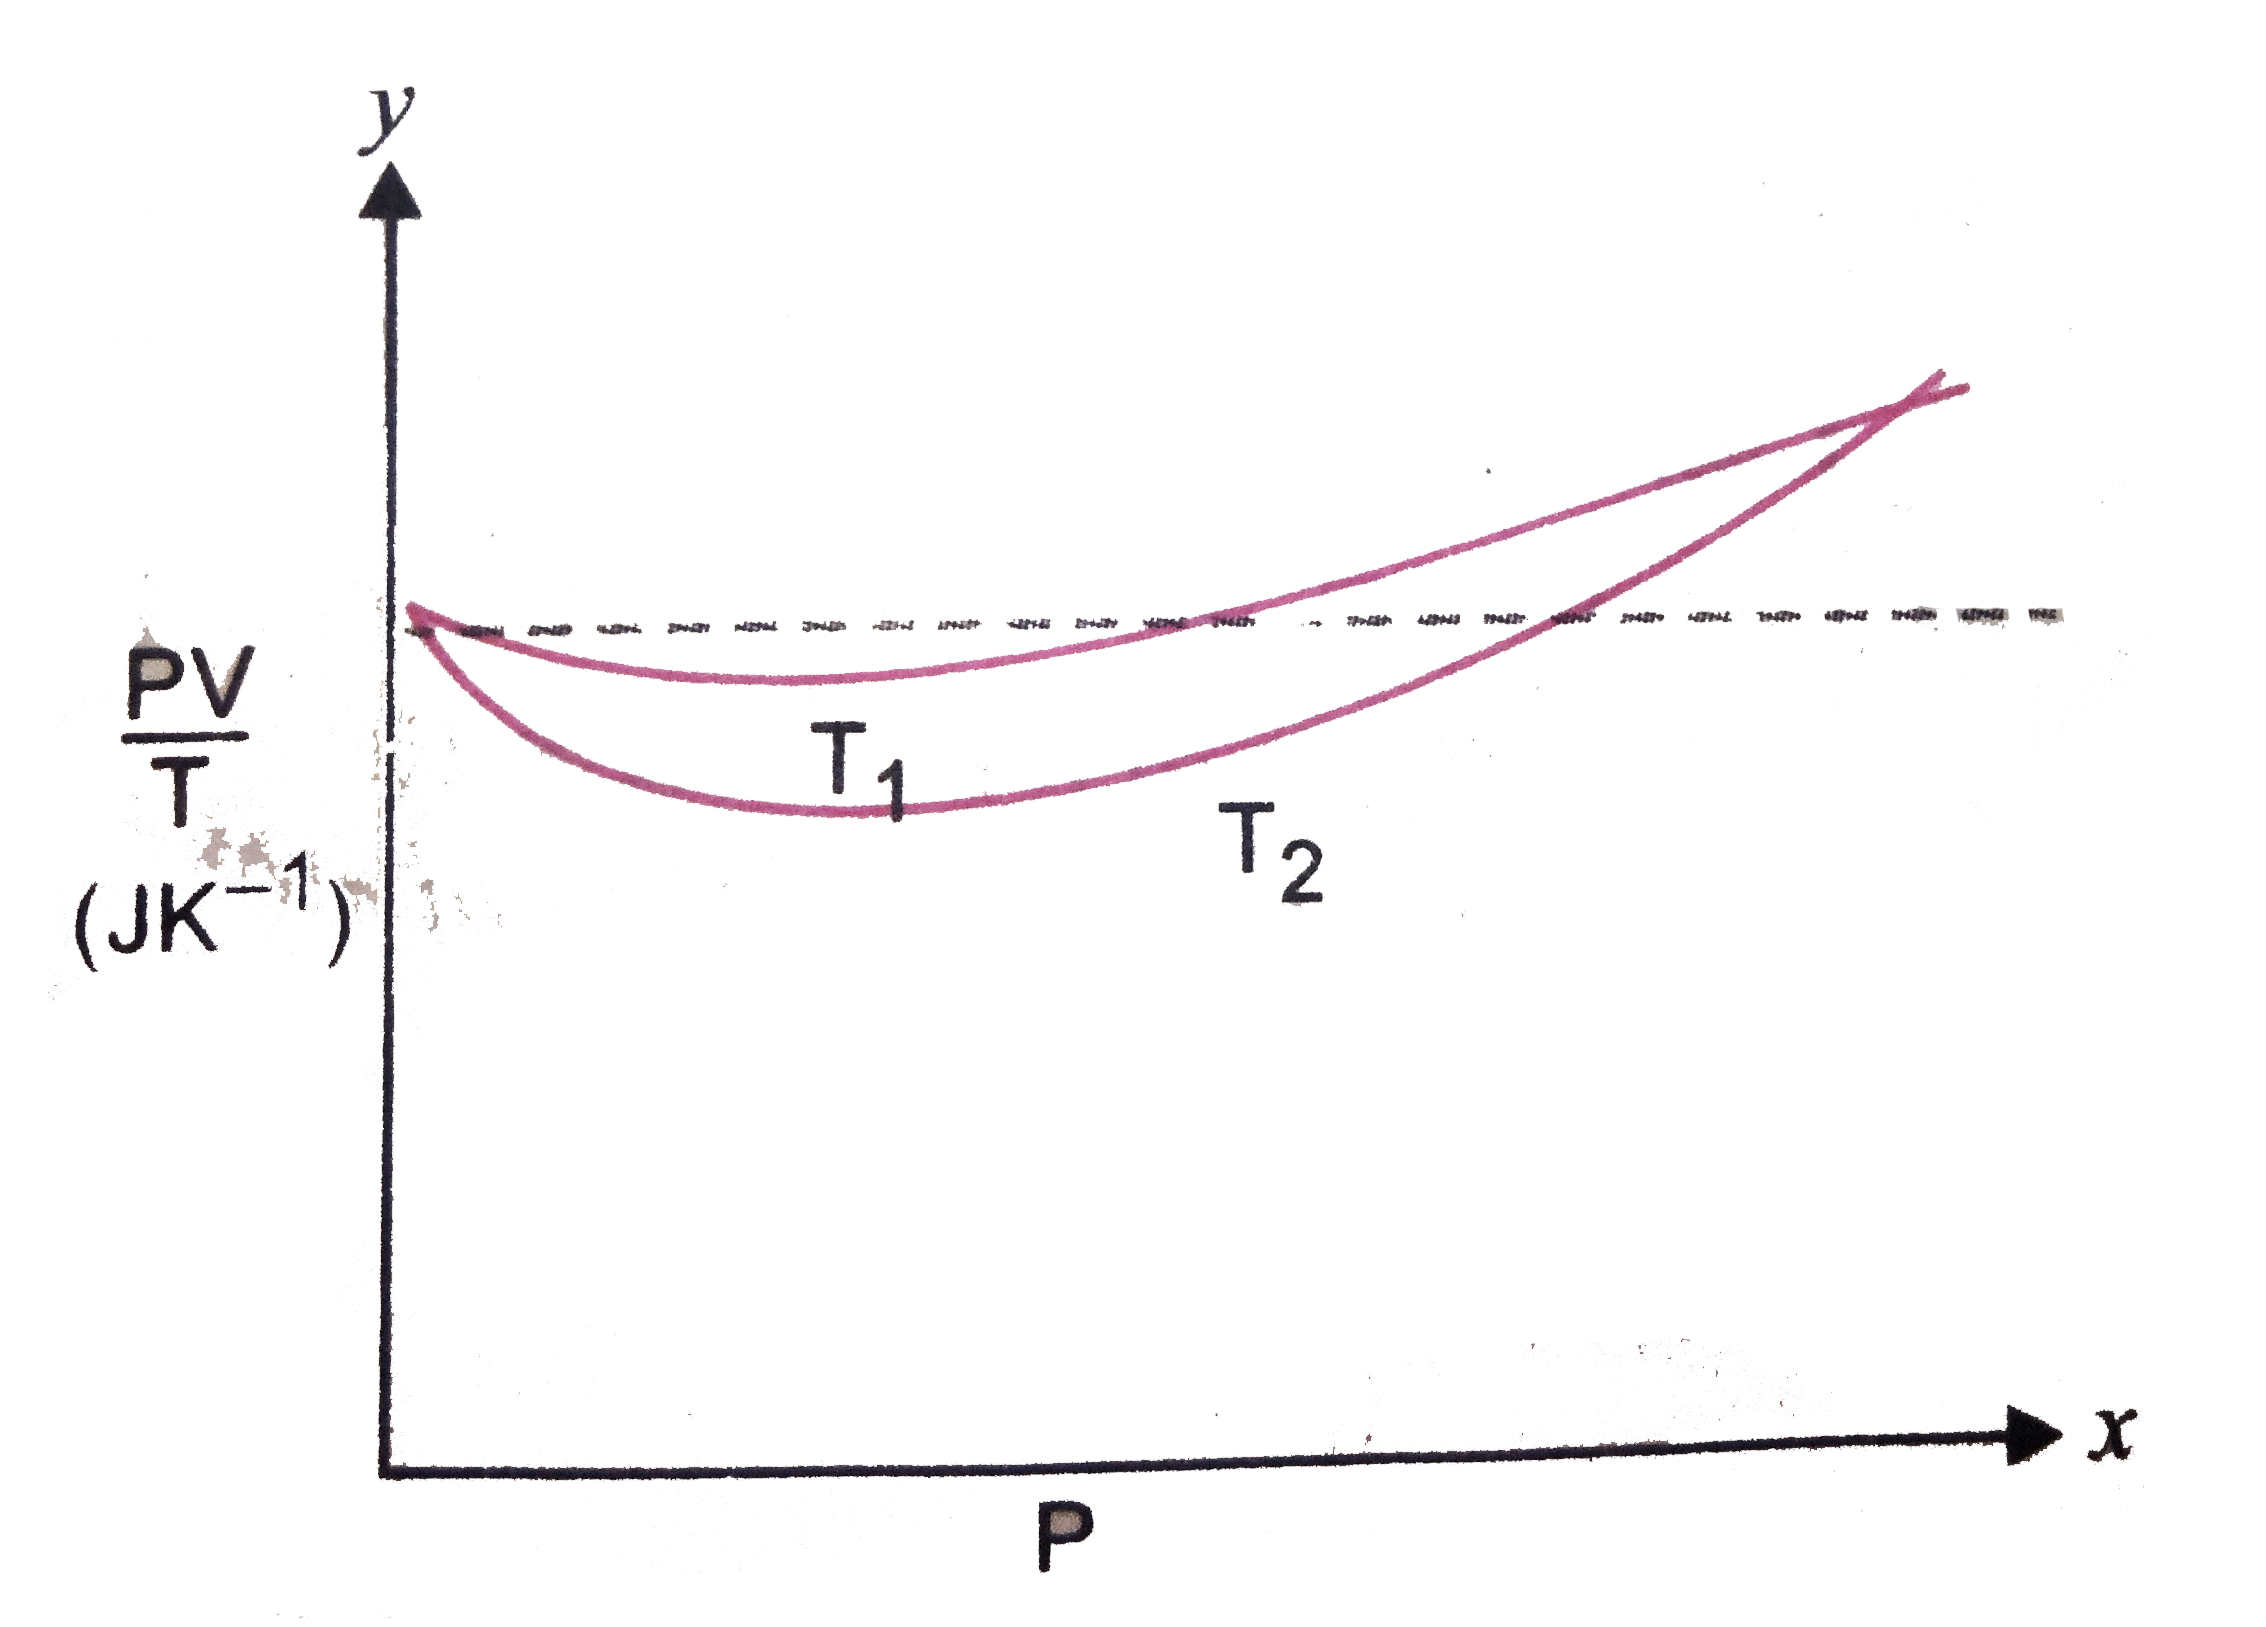
View SolutionFig shows of PV/T versus P for 1.00×10⁻³kg of oxygen gas at two different temperatures.
(a) What does the dotted plot signify ?
(b) Which is true : T1<T2orT2<T1?
( c) What is the value of PV/T where the curves meet on the Y-axis ?
(d) If we obtained similar plot for 1.00×10⁻³kg of hydrogen, would we get the same value of PV/T at the point where the curves meet on the y-axis ? If not, what mass of hydrogen yield the same value of PV/T (for low pressure high temperature region of the plot) ? (Molecular mass of H=2.02u, of O=32.0u,R=8.31Jmol−1K−1
 View Solution
Knowledge Check
- Question 1 - Select One
The figure below shows the plot of PVnT versus P for oxygen gas at two different temperatures
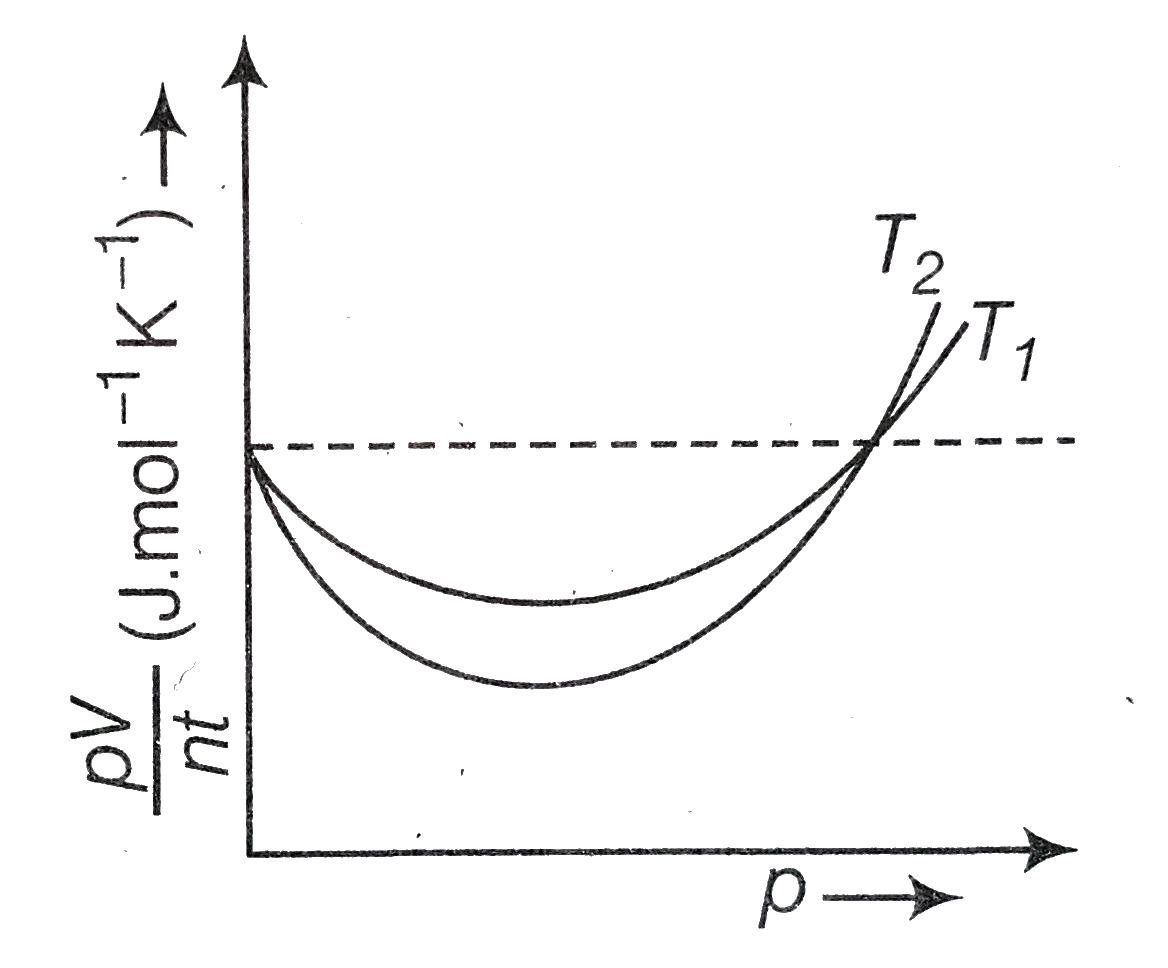
Read the following statements concerning the above curves.
(i) The dotted line corresponds to the ideal gas behaviour
(ii) T1>T2
The value of pVnT at the point where the curves meet on the y-axis is the same for all gases Which of the above statements is true ?A(i) onlyB(i) and (ii) onlyCAll of theseDNone of these - Question 2 - Select One
Given is the graph between PVT and P for 1 gm of oxygen gas at two different temperatures T1andT2 Fig. Given, density of oxygen =1.427kgm−3. The value of (PV)/(T) at the point A and the relation between T1andT2 are respectively :
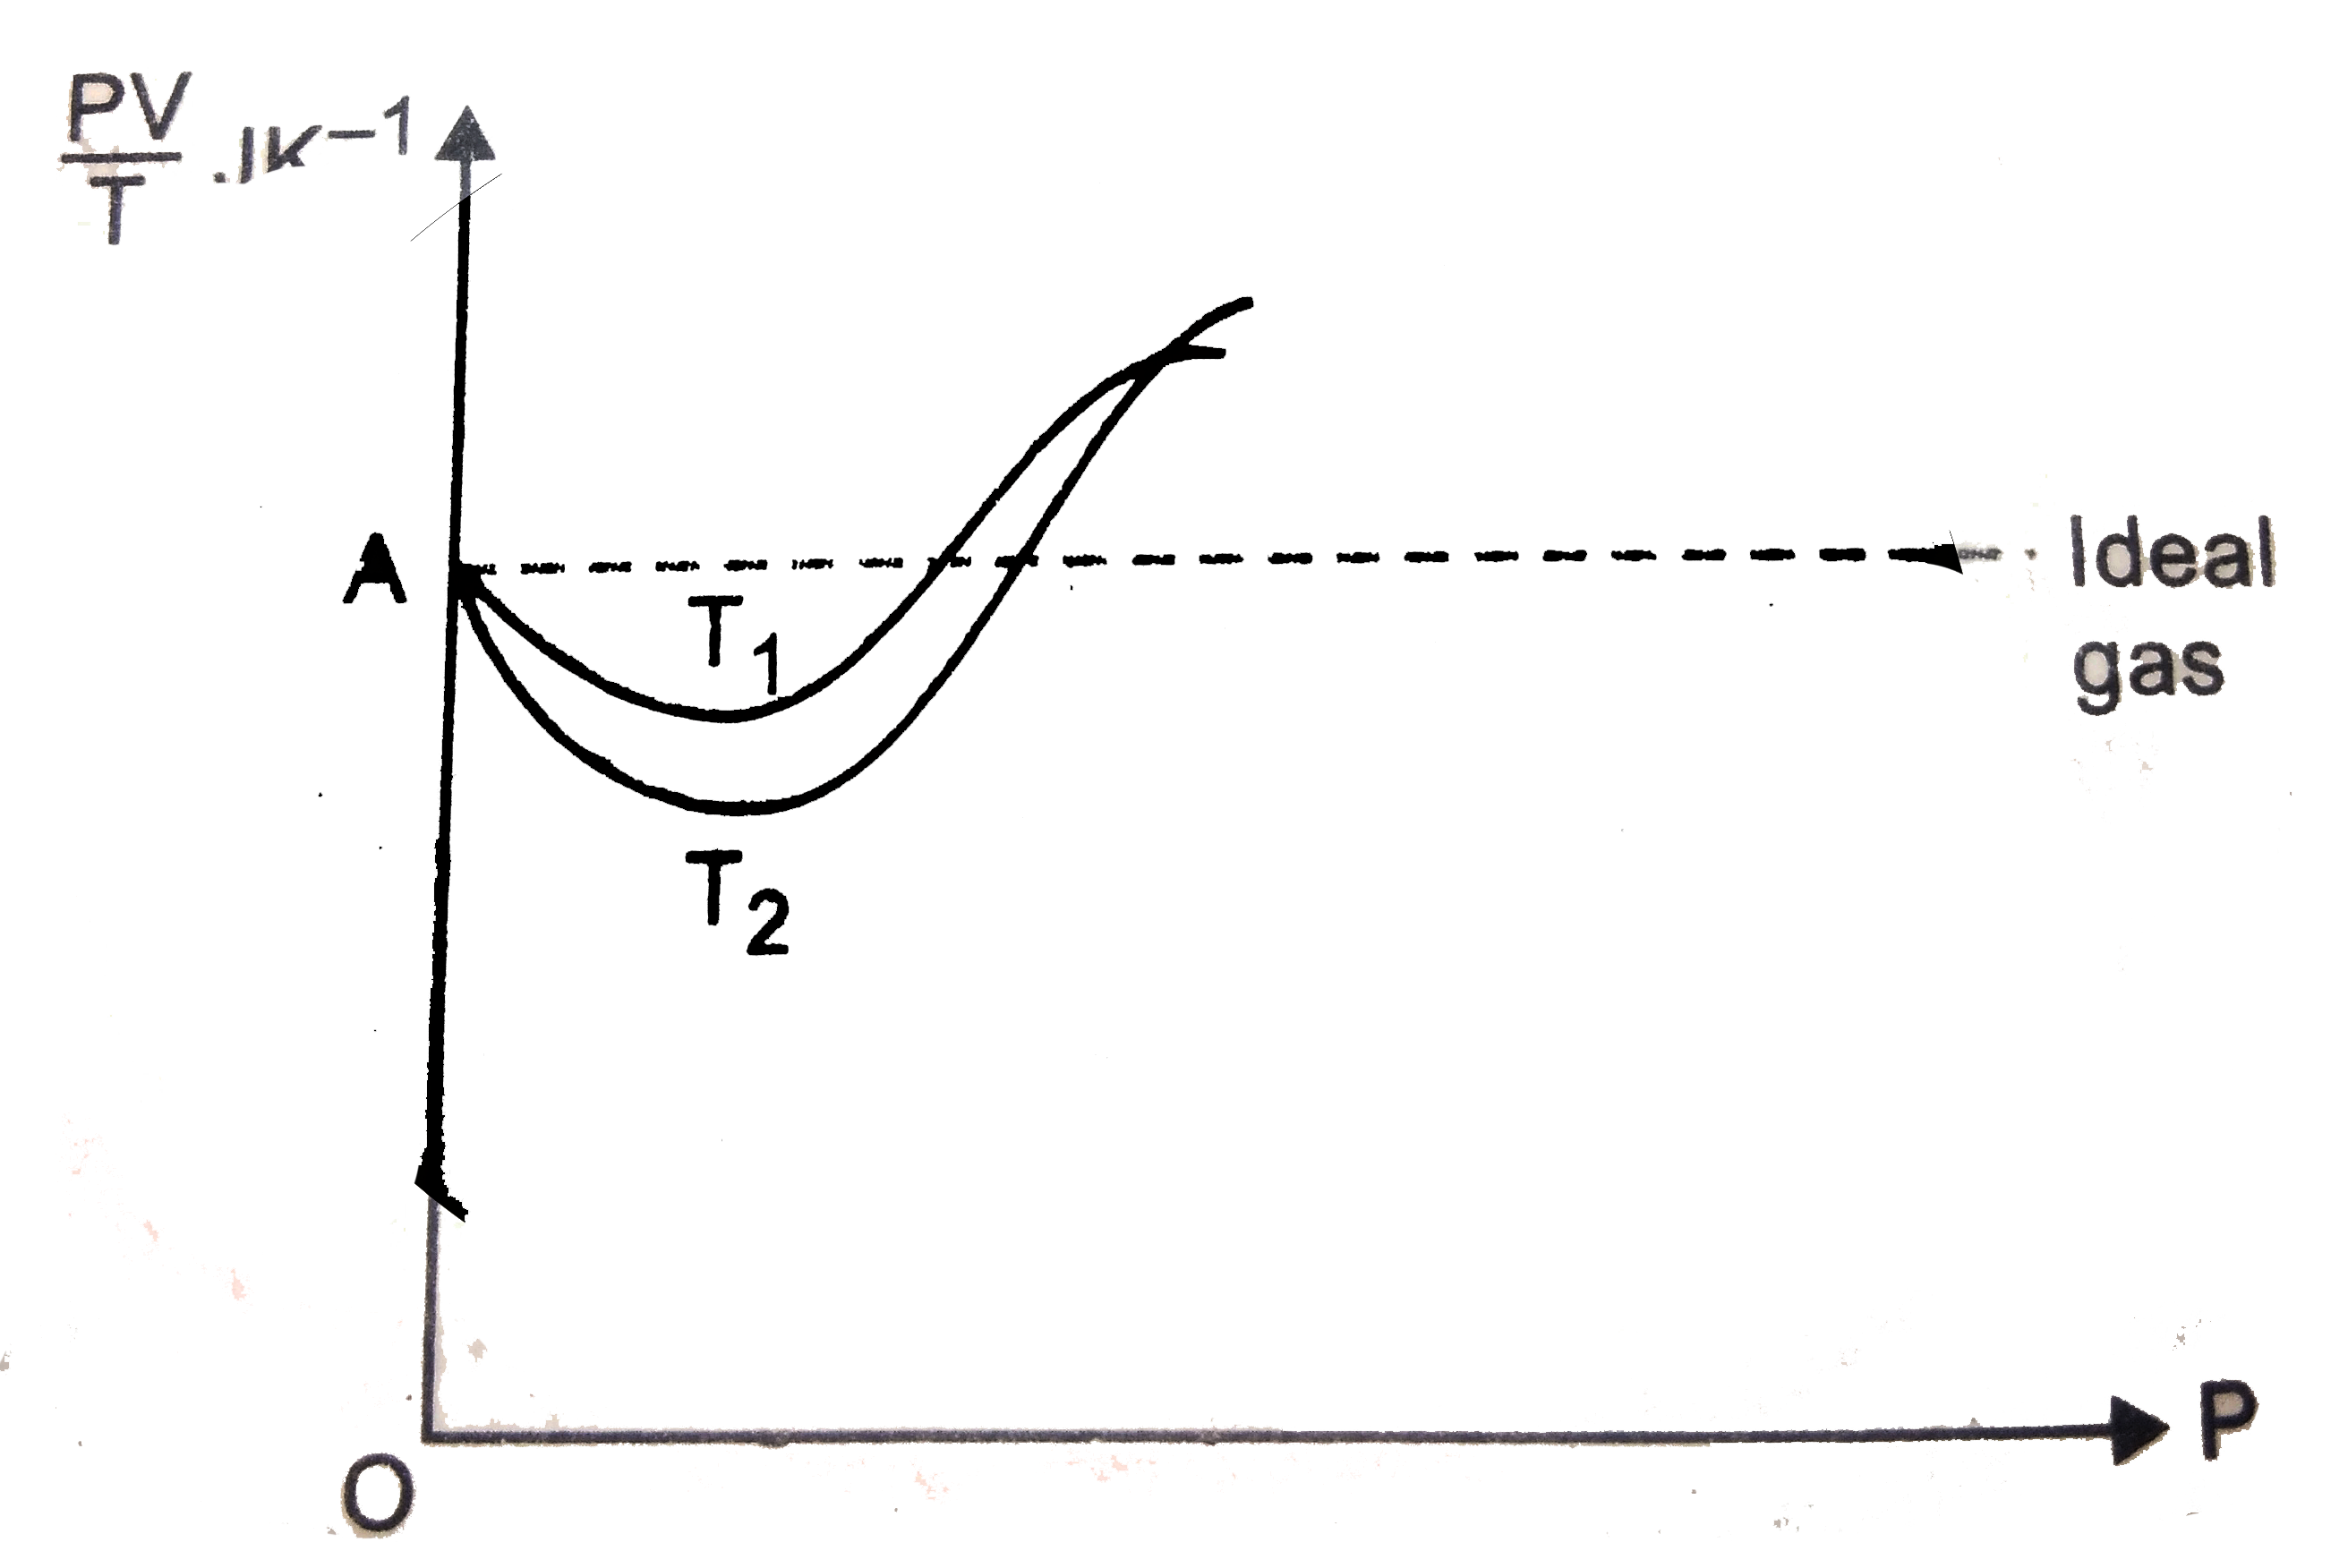 A0.256JK−1andT1<T(2)B8.314mol−1K−1andT1>T(2)C0.256JK−1andT1>T(2)D4.28JK−1andT1<T(2)
 - Question 3 - Select One
The figure shows the graph of pVT versus p for 2×10⁻⁴ kg of hydrogen gas at two different temperatures, where p,V andT represents pressure, volume and temperature respectively. Then, the value of pVT where the curve meet on the vertical axis, is
 AR5B2R3CR10DR15
The graph of (xm) vs P at two different temperature T1 and T2 is [where T1>T2]
View SolutionDraw the plot log P vs log V for Boyle's law.
View SolutionChoose the correct option for graphical representation of Boyle's Law, which shows a graph of pressure vs volume of gas at different temperatures:
View SolutionWhat is the nature of graph of PV versus P for a given mass of a gas at constant temperature?
View SolutionFigure shows graphs of pressure vs density for an ideal gas at two temperatures Tt and T2
View Solution

