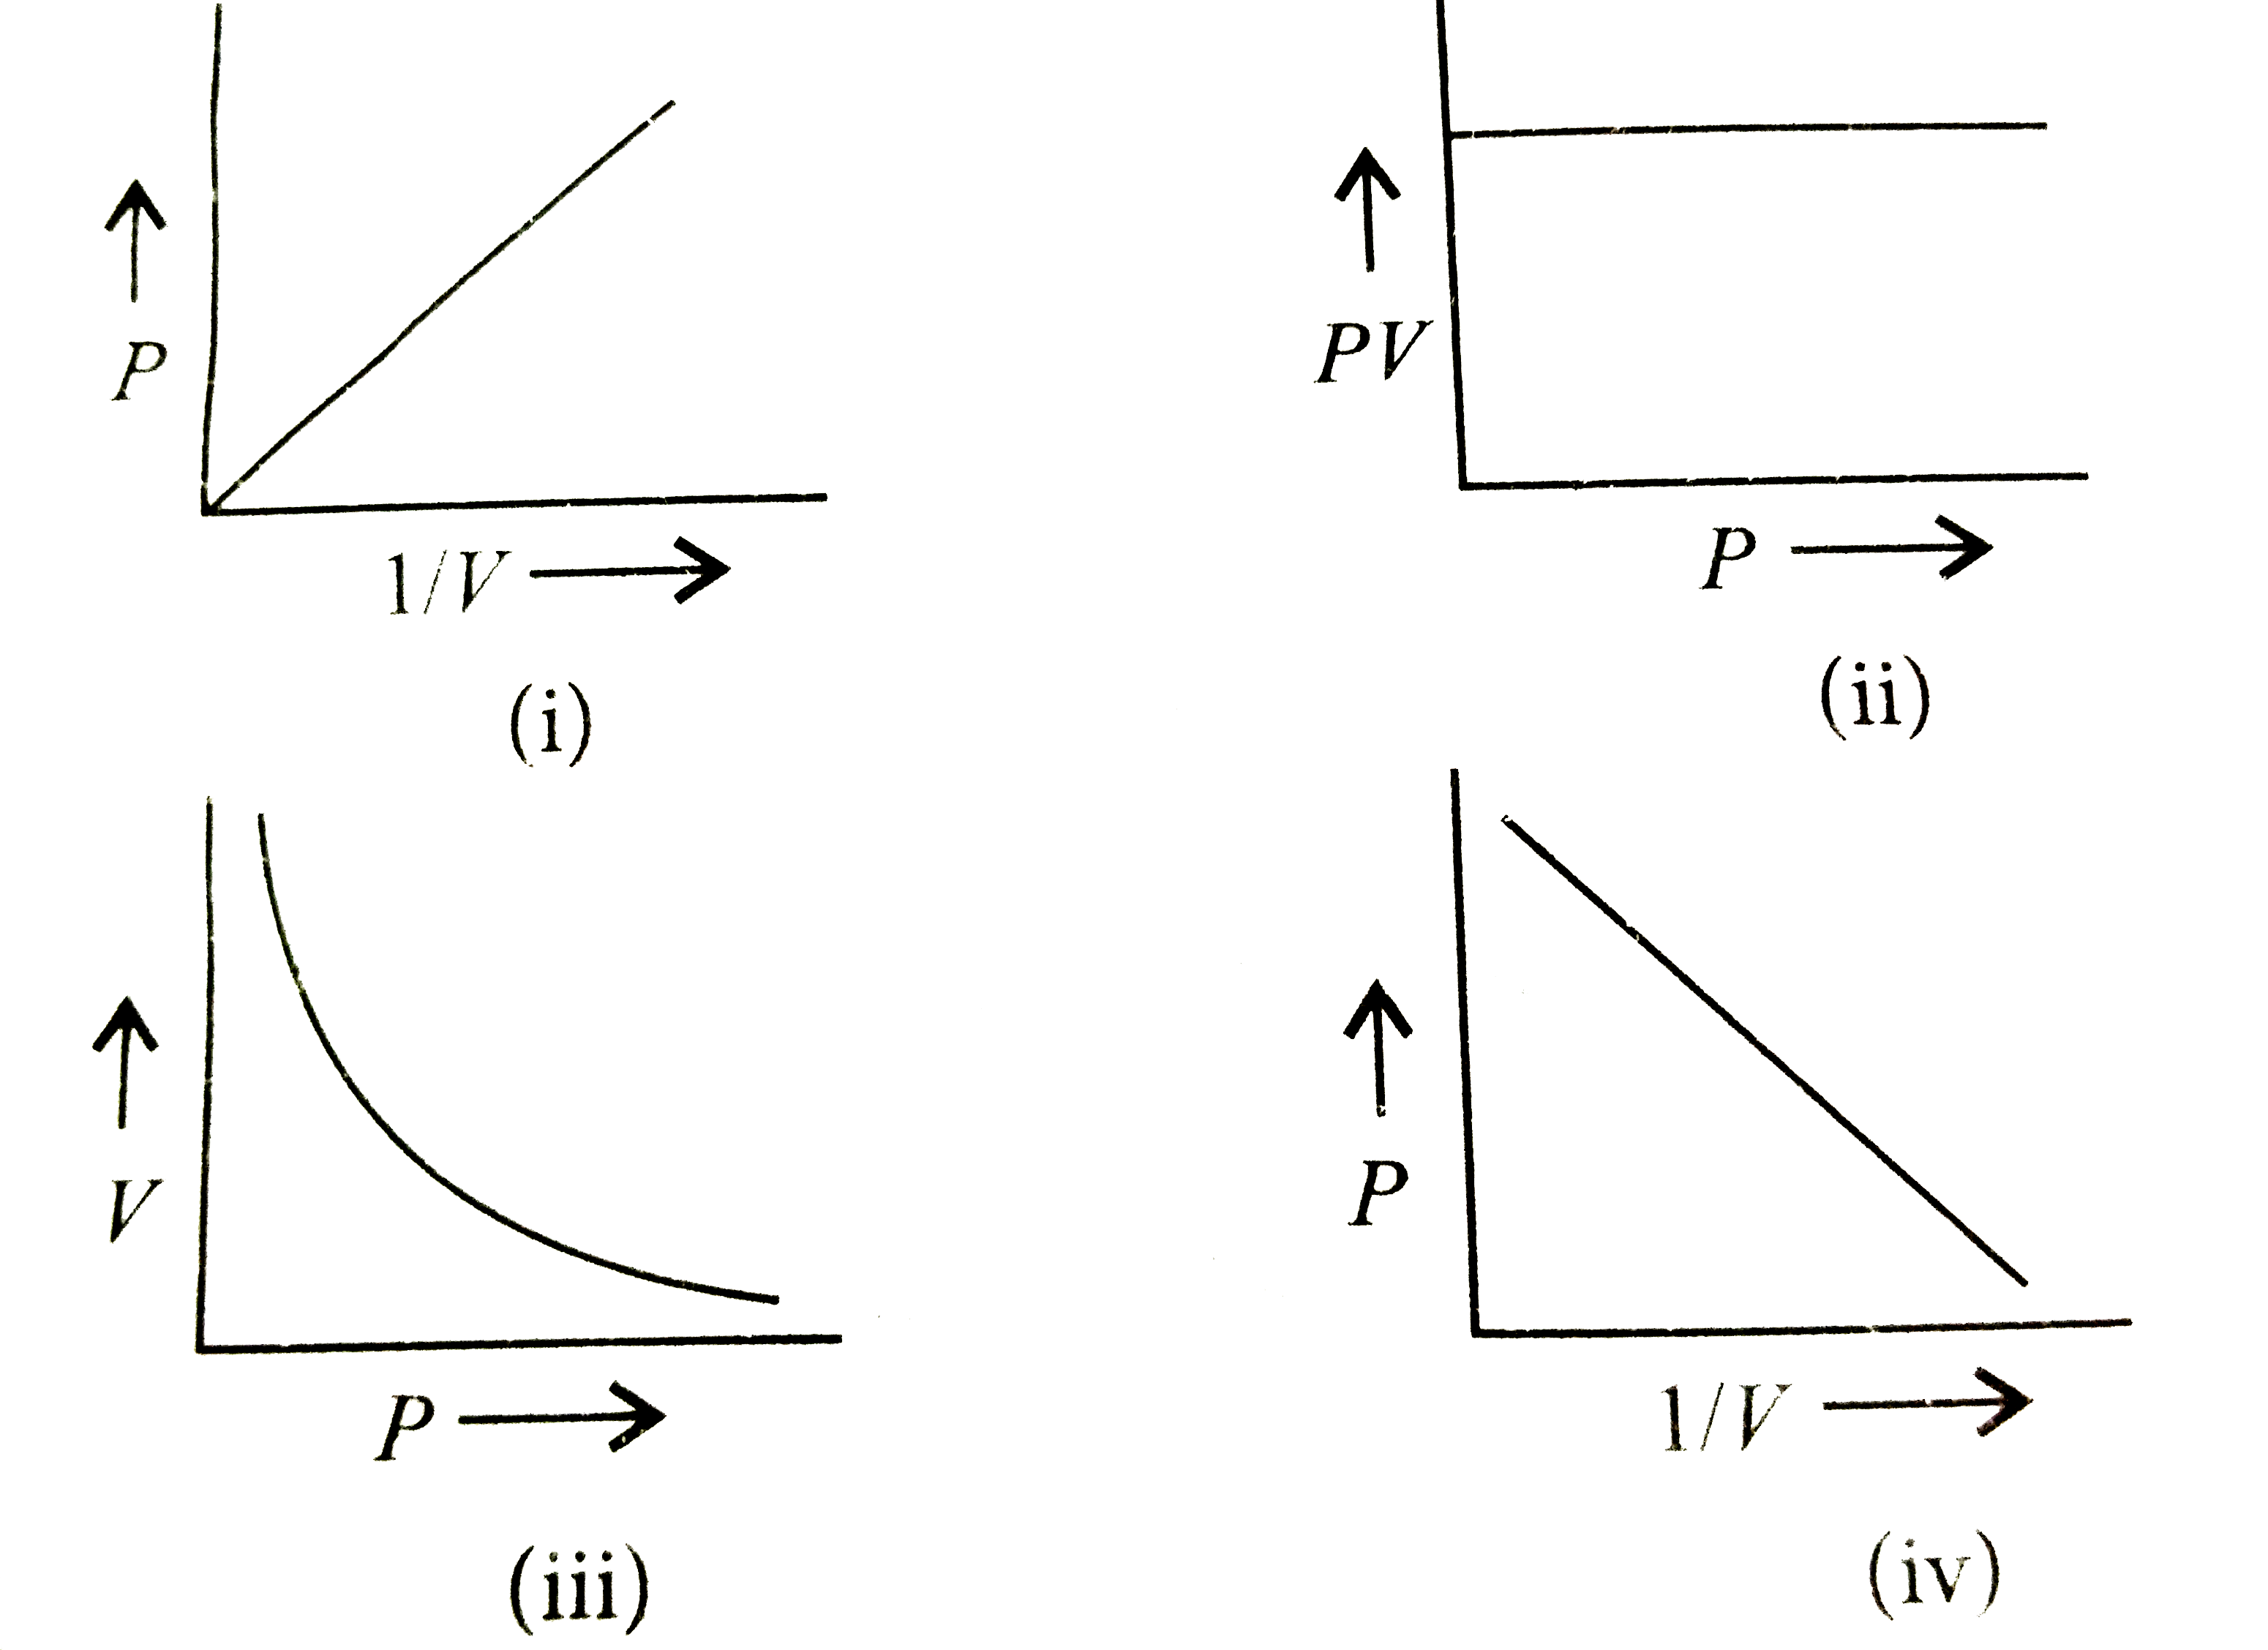
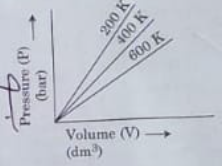
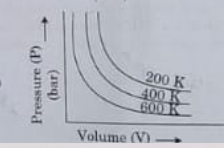
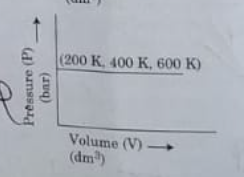
Choose the correct option for graphical representation of Boyle's Law, which shows a graph of pressure vs volume of gas at different temperatures:
To solve the question regarding the graphical representation of Boyle's Law, we need to understand the relationship between pressure (P) and volume (V) of a gas at constant temperature. Here’s a step-by-step breakdown:
Step 1: Understand Boyle's Law
Boyle's Law states that for a given mass of gas at constant temperature, the pressure of the gas is inversely proportional to its volume. Mathematically, this can be expressed as:
P∝1V
This means that if the volume increases, the pressure decreases, and vice versa, provided the temperature remains constant.
Step 2: Ideal Gas Equation
The ideal gas equation is given by:
PV=nRT
Where:
- P = pressure
- V = volume
- n = number of moles of gas
- R = universal gas constant
- T = temperature
For Boyle's Law, we keep n and T constant, which means nRT is a constant value.
Step 3: Graphical Representation
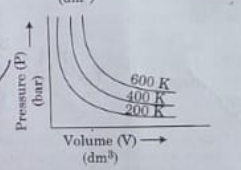
When plotting pressure (P) against volume (V) for a gas at constant temperature, the graph will be a hyperbola. This is because as volume increases, pressure decreases, creating a curve that approaches the axes but never touches them.
Step 4: Analyzing the Graph at Different Temperatures
In the context of the question, we are looking at the pressure vs. volume graph at different temperatures. As temperature increases, for a fixed volume, the pressure also increases. Thus, the curves for different temperatures will not only be hyperbolic but will also show that higher temperatures correspond to higher pressures at the same volume.
Step 5: Conclusion
From the analysis, we can conclude that the correct graphical representation will show multiple hyperbolas, each corresponding to a different temperature, with the hyperbola for the highest temperature being the furthest from the origin (indicating higher pressure at the same volume).
Final Answer
The correct option for the graphical representation of Boyle's Law, showing pressure vs. volume at different temperatures, is the one that depicts hyperbolas with the highest temperature curve being the farthest from the origin.
---
Boyle's Law states that for a given mass of gas at constant temperature, the pressure of the gas is inversely proportional to its volume. Mathematically, this can be expressed as:
P∝1V
This means that if the volume increases, the pressure decreases, and vice versa, provided the temperature remains constant.
The ideal gas equation is given by:
PV=nRT
Where:
- P = pressure
- V = volume
- n = number of moles of gas
- R = universal gas constant
- T = temperature
When plotting pressure (P) against volume (V) for a gas at constant temperature, the graph will be a hyperbola. This is because as volume increases, pressure decreases, creating a curve that approaches the axes but never touches them.
In the context of the question, we are looking at the pressure vs. volume graph at different temperatures. As temperature increases, for a fixed volume, the pressure also increases. Thus, the curves for different temperatures will not only be hyperbolic but will also show that higher temperatures correspond to higher pressures at the same volume.
From the analysis, we can conclude that the correct graphical representation will show multiple hyperbolas, each corresponding to a different temperature, with the hyperbola for the highest temperature being the furthest from the origin (indicating higher pressure at the same volume).
The correct option for the graphical representation of Boyle's Law, showing pressure vs. volume at different temperatures, is the one that depicts hyperbolas with the highest temperature curve being the farthest from the origin.
Topper's Solved these Questions
Similar Questions
Knowledge Check
Shows graphs of pressure vs density for an ideal gas at two temperaturesT1andT2
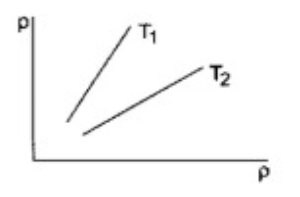 A(a)T1>T2B(b)T1=T2C(c)T1<T2D(d)Any of the three is possibe.
Which of the following graph represents Boyle's law ?
A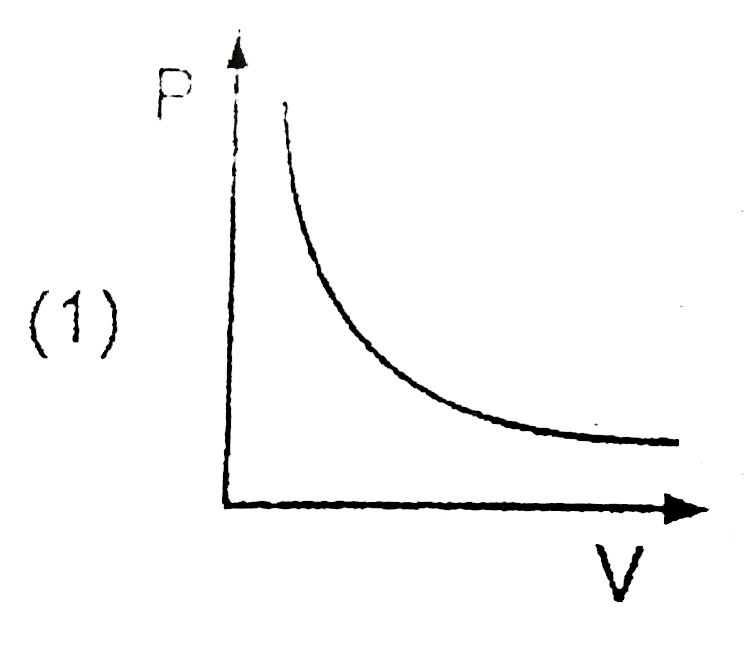 B
B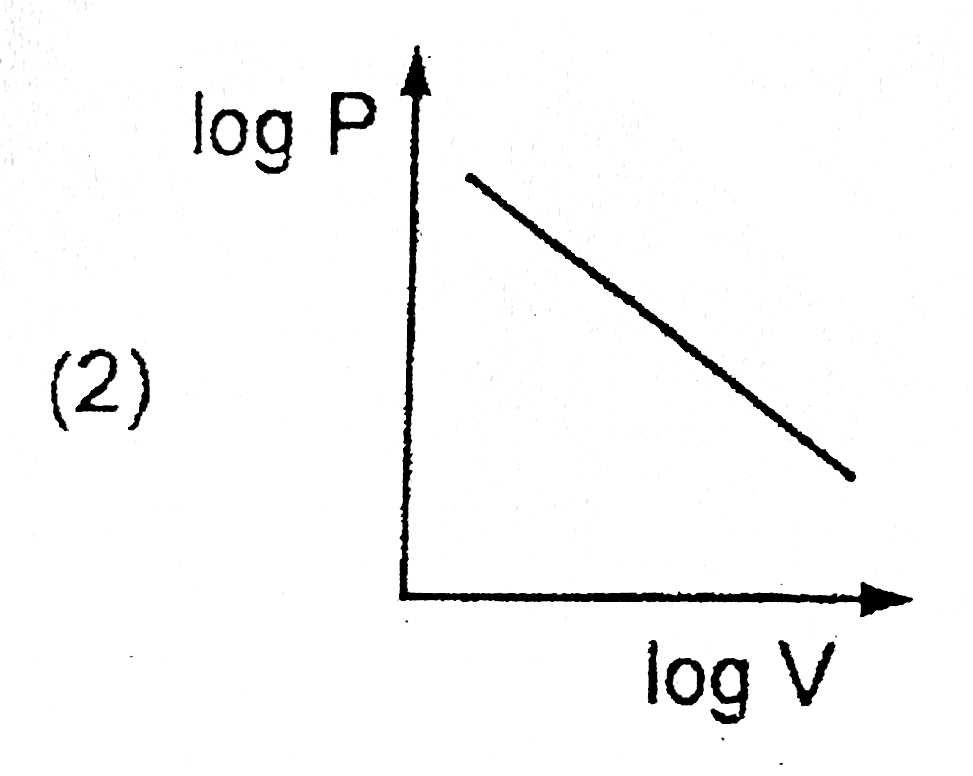 C
C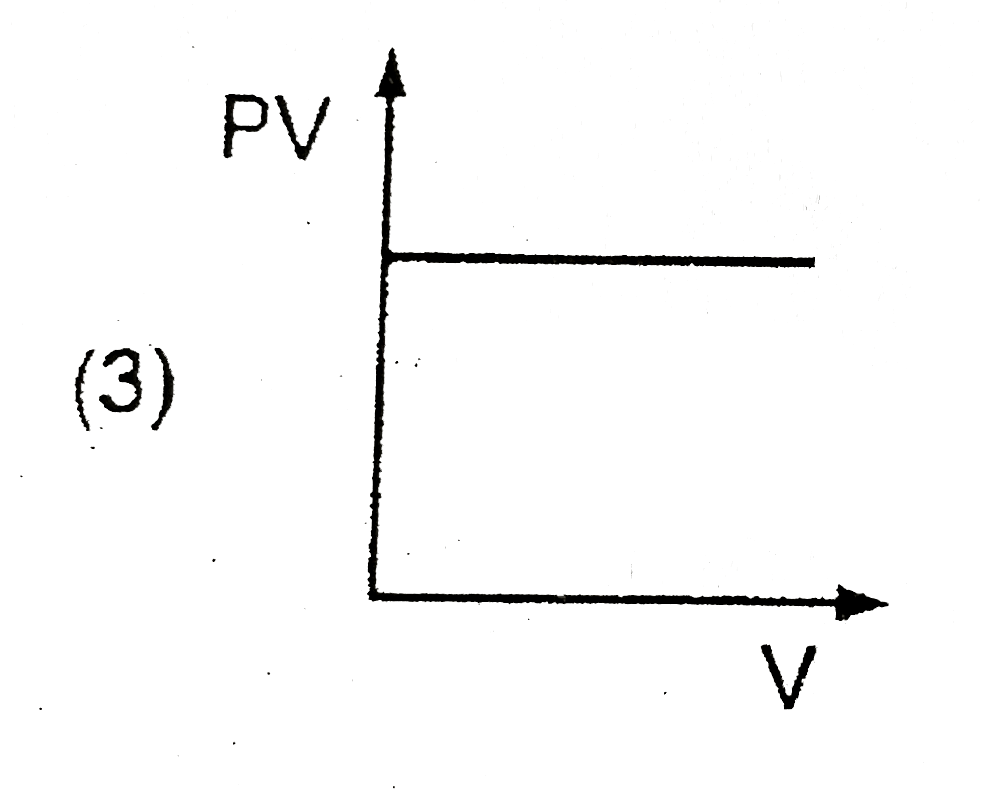 DAll of these
Which of the following graph represent Boyle's law ?
A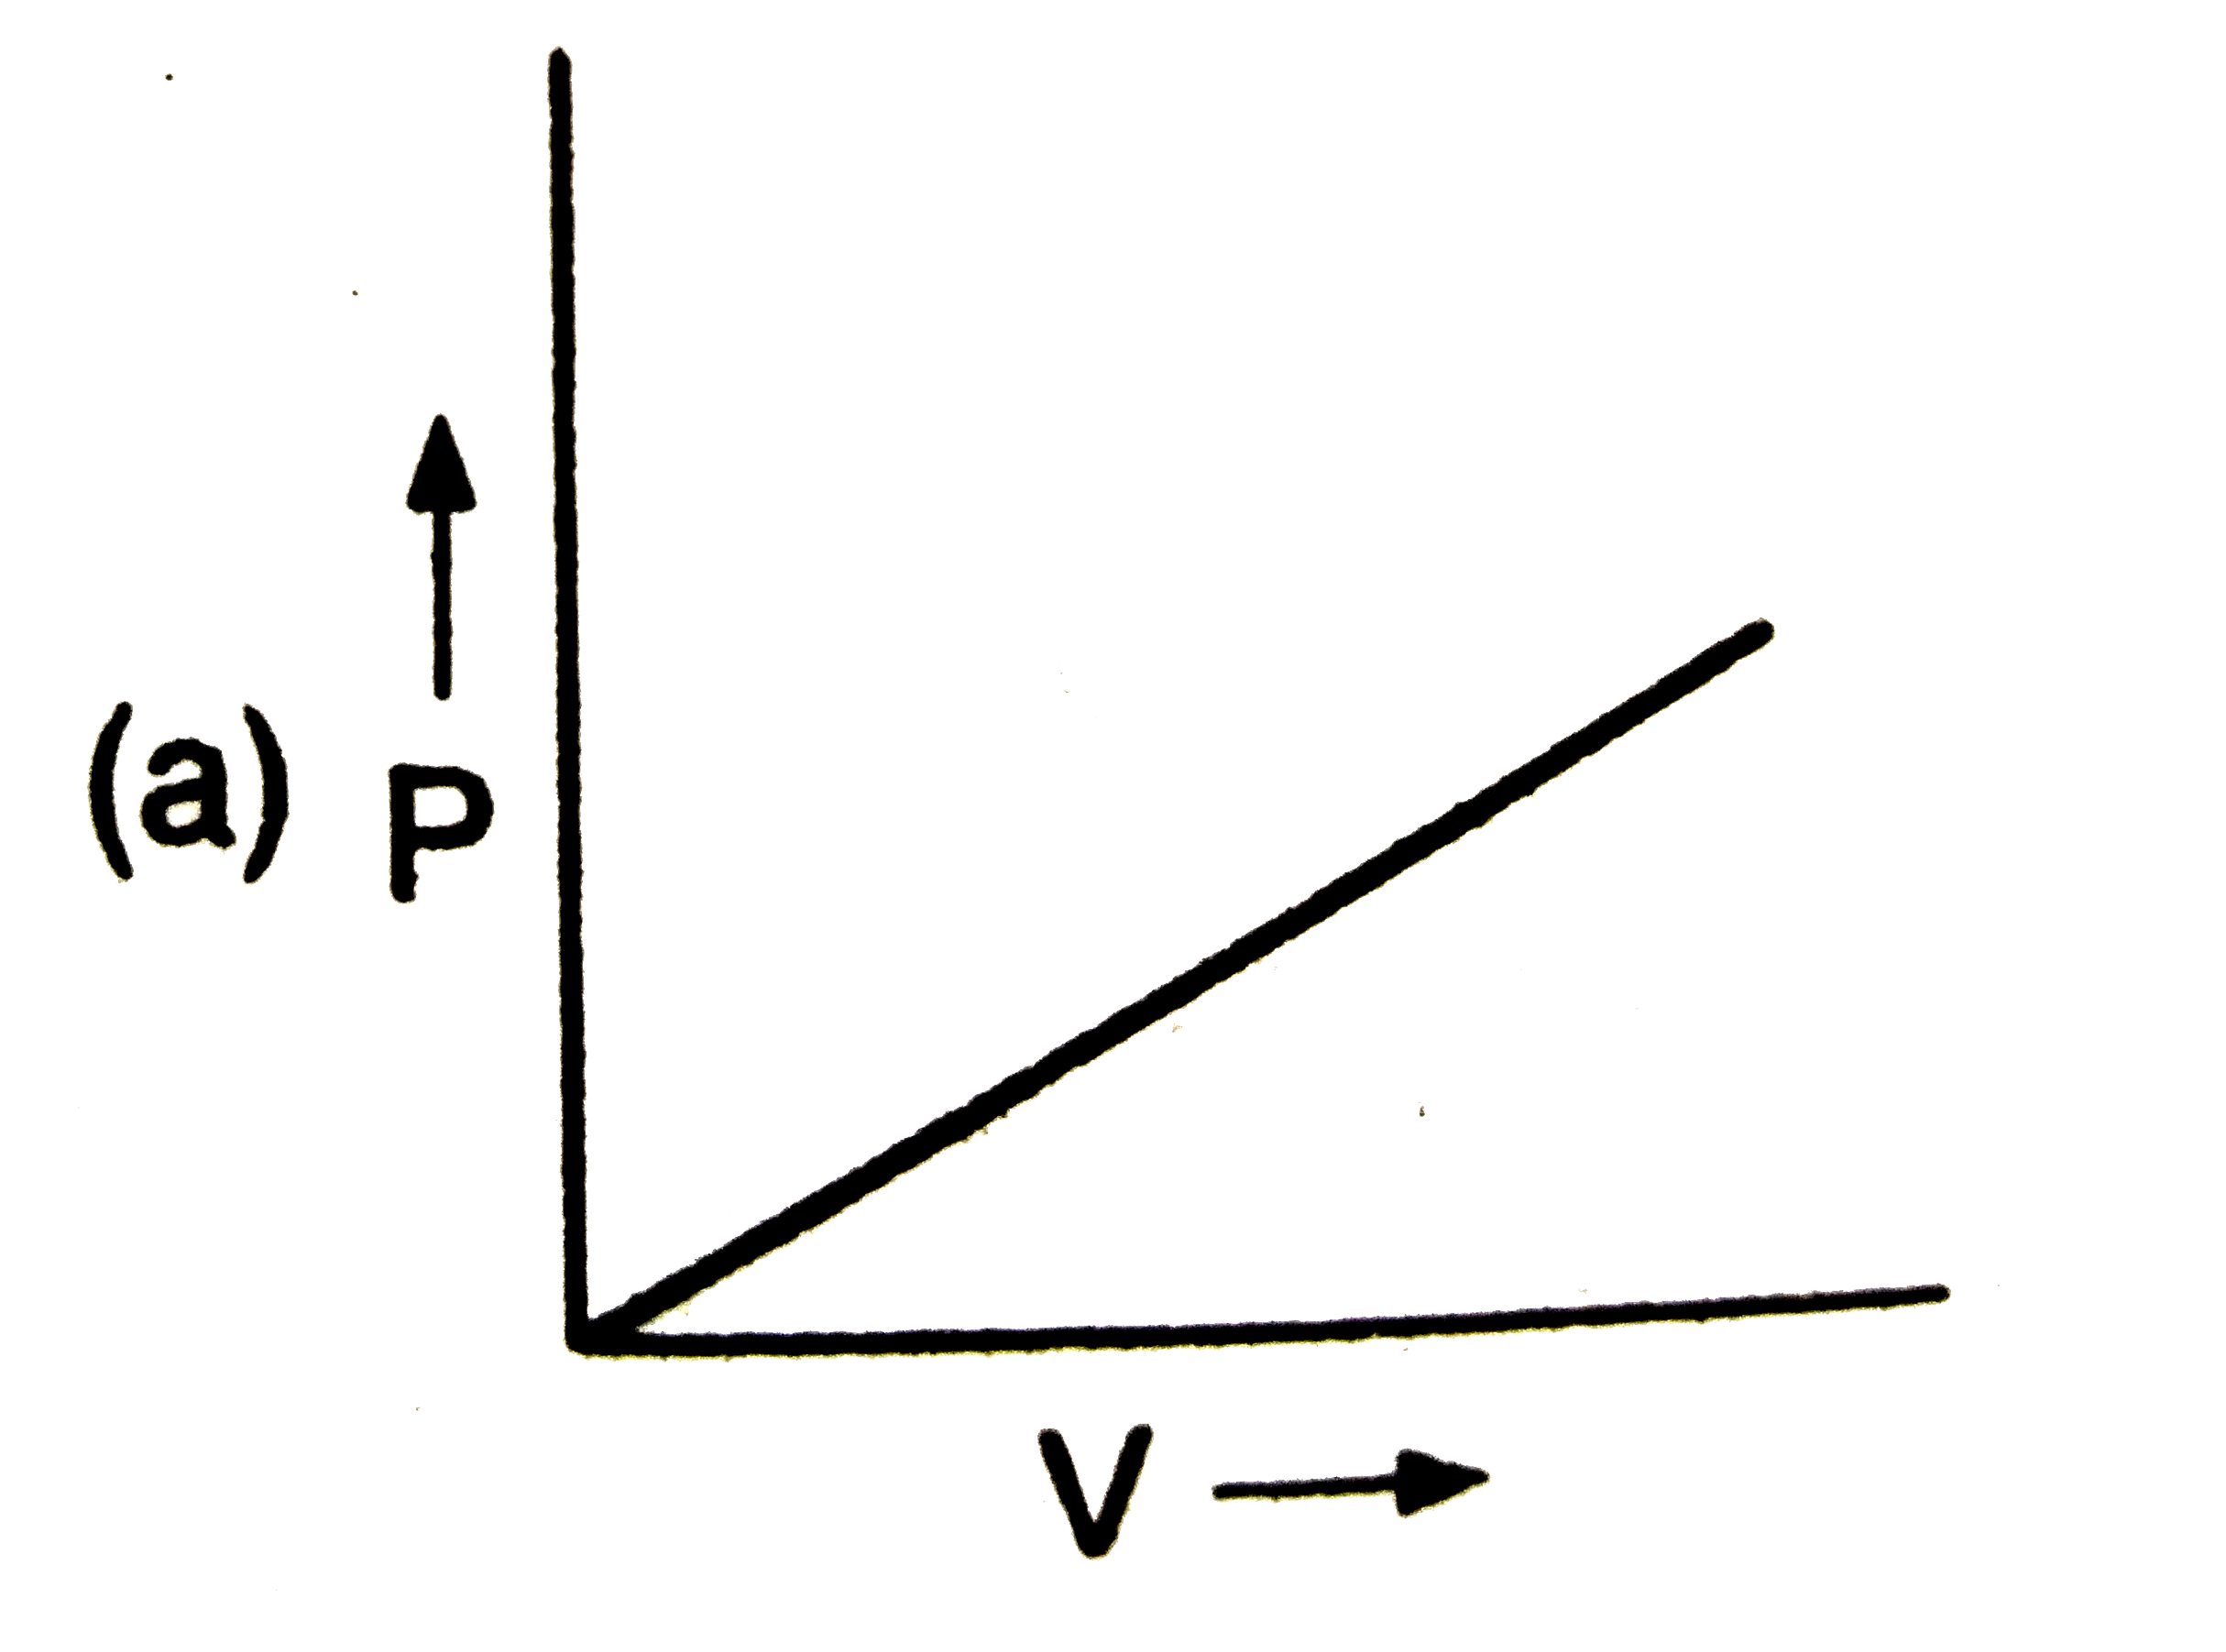 B
B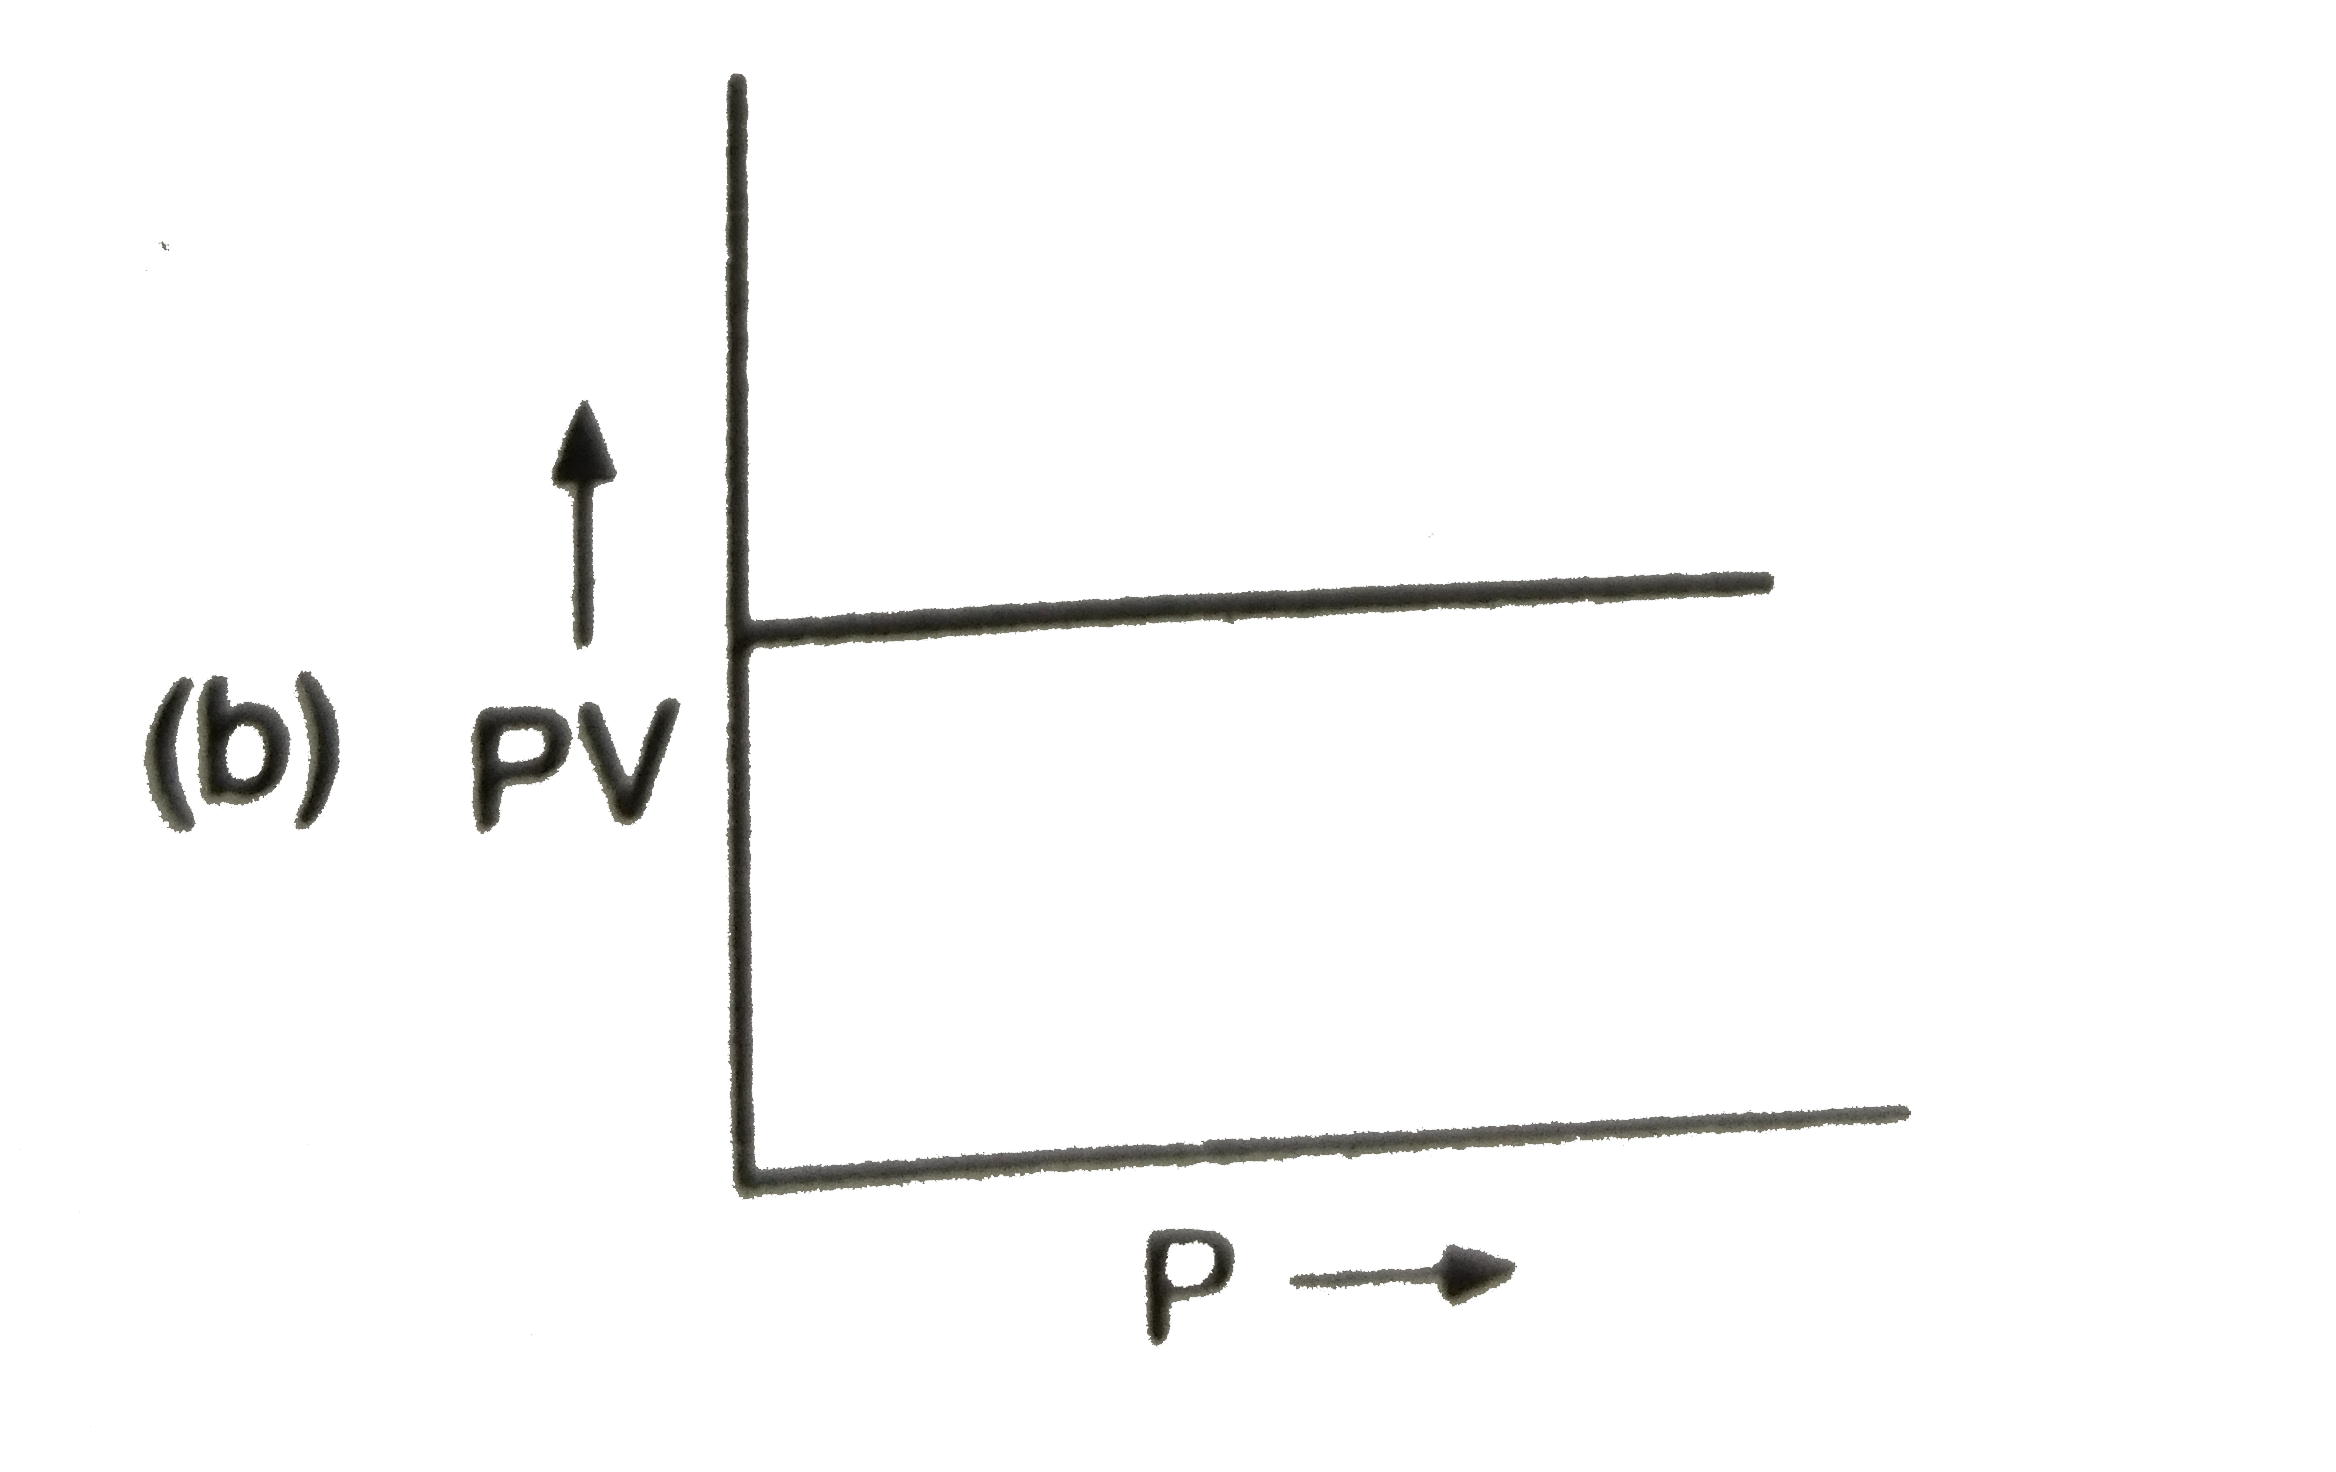 C
C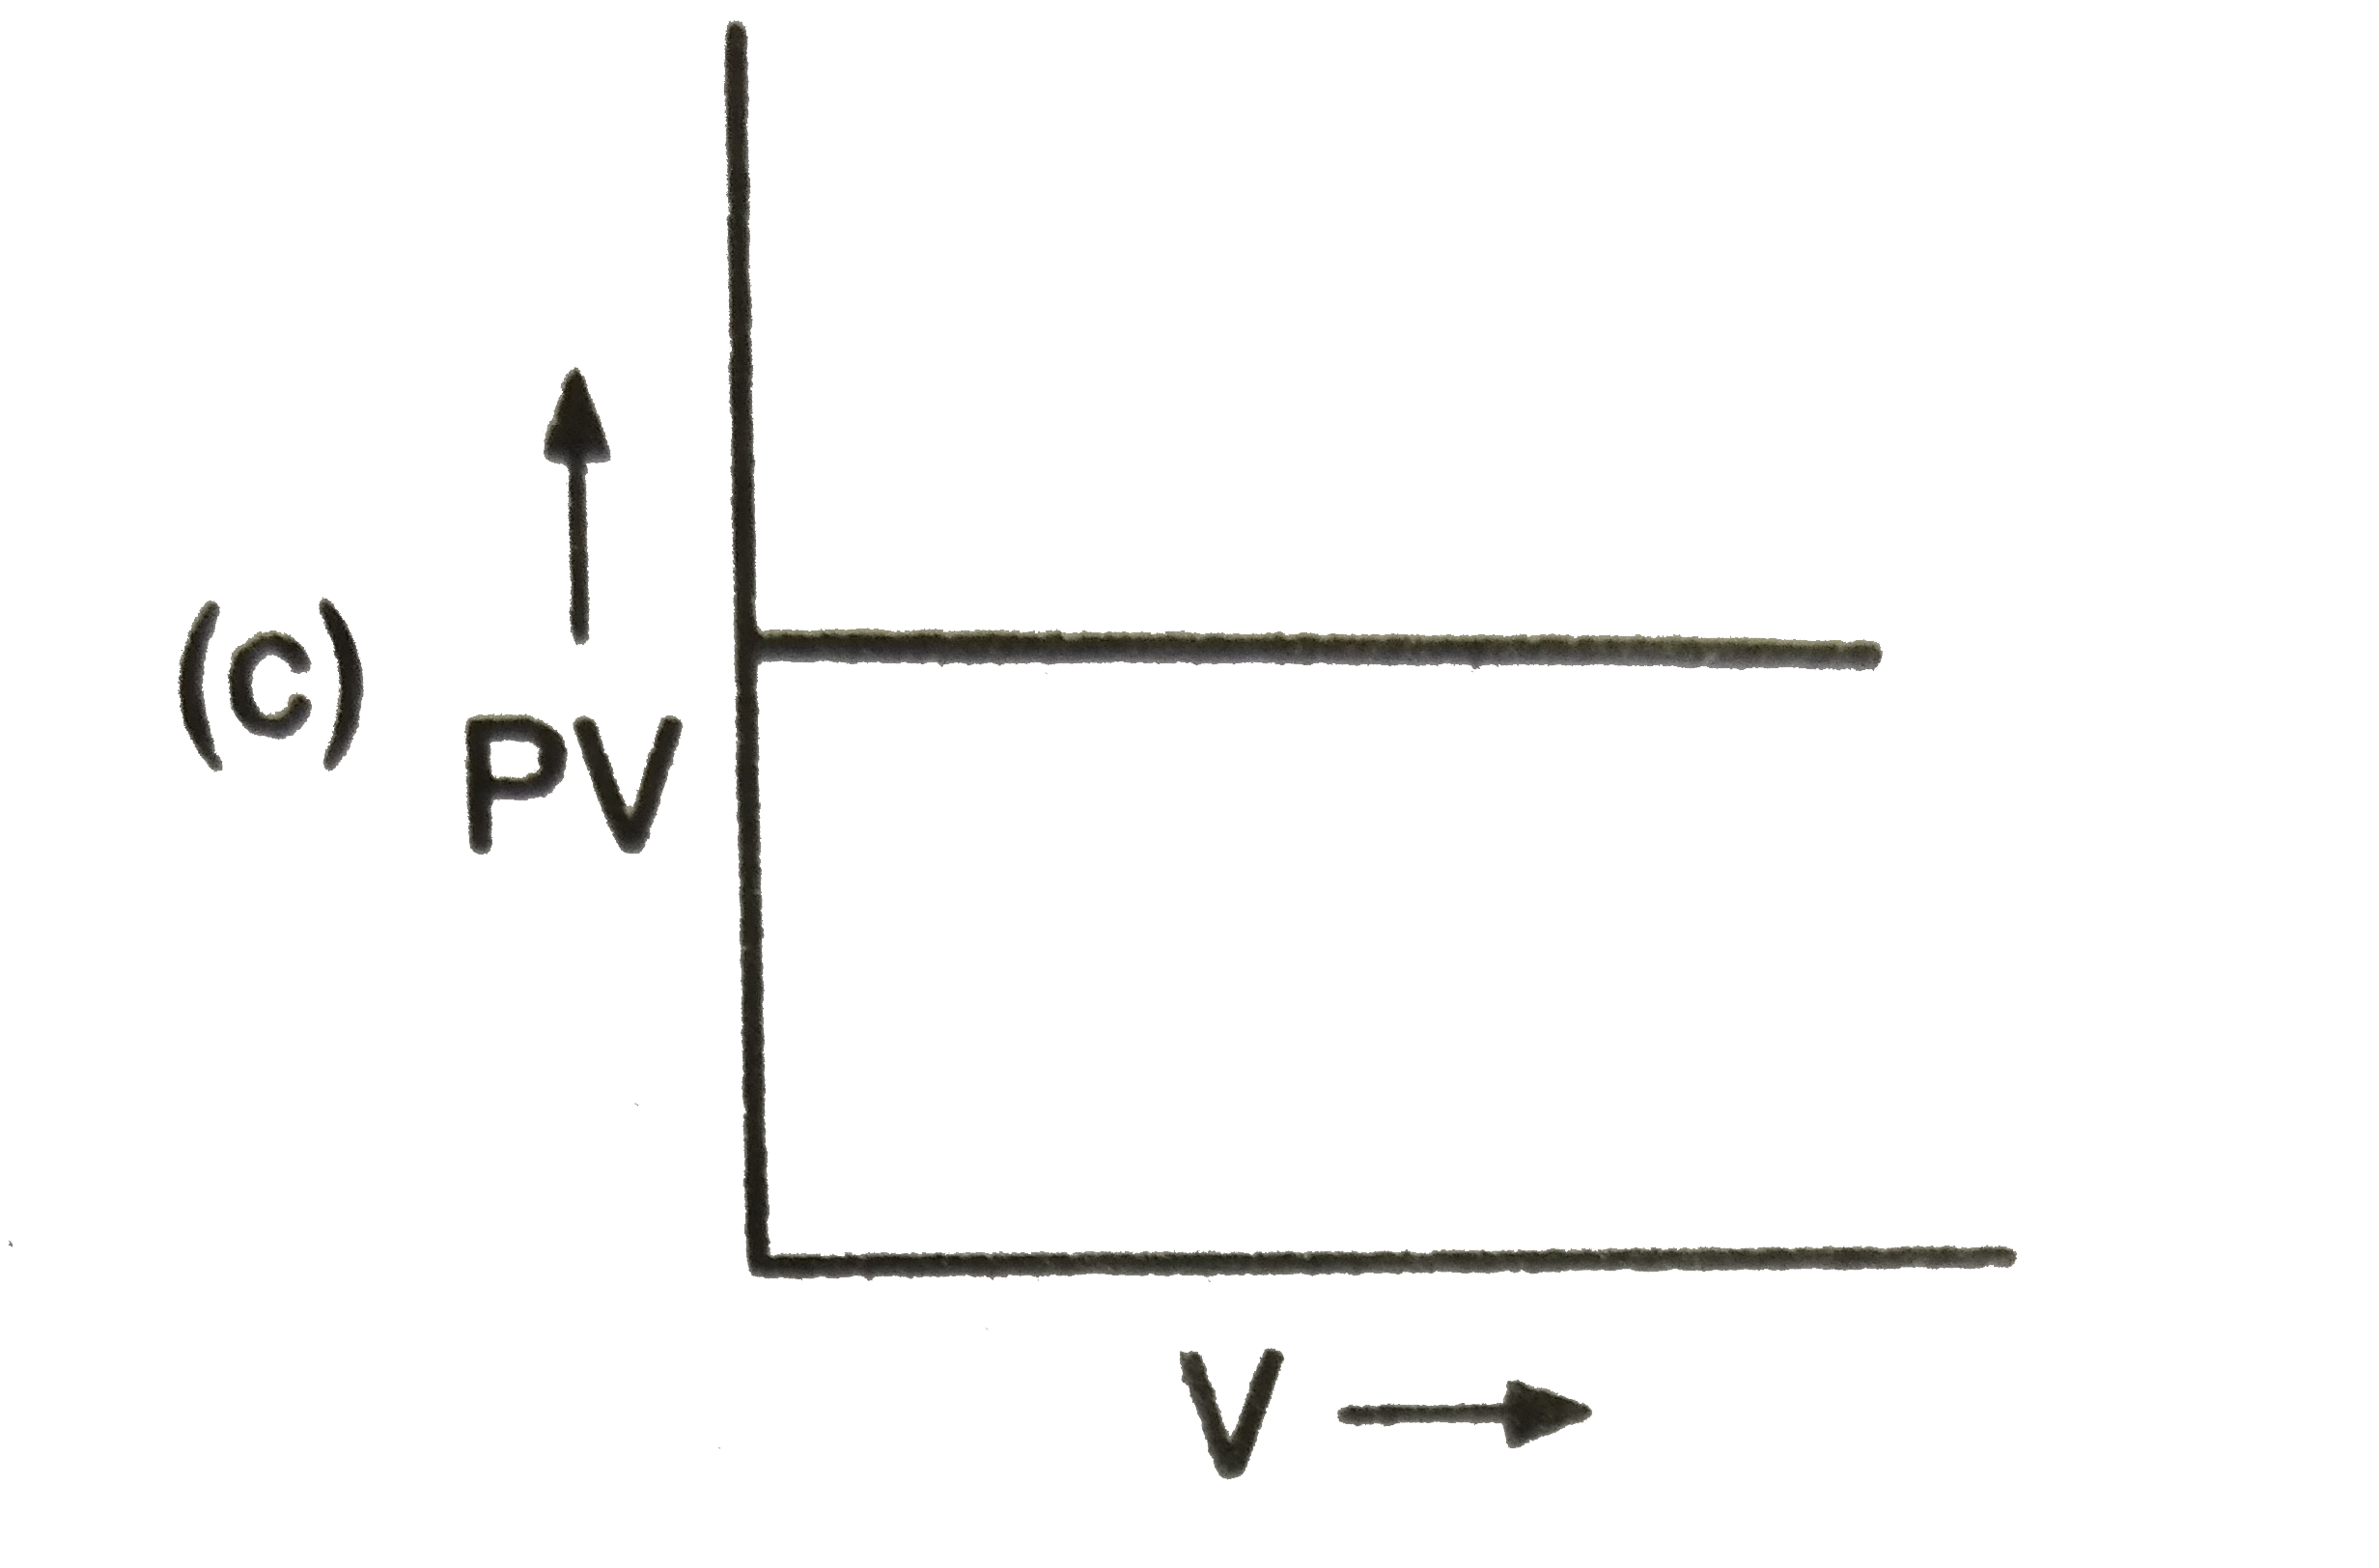 D
D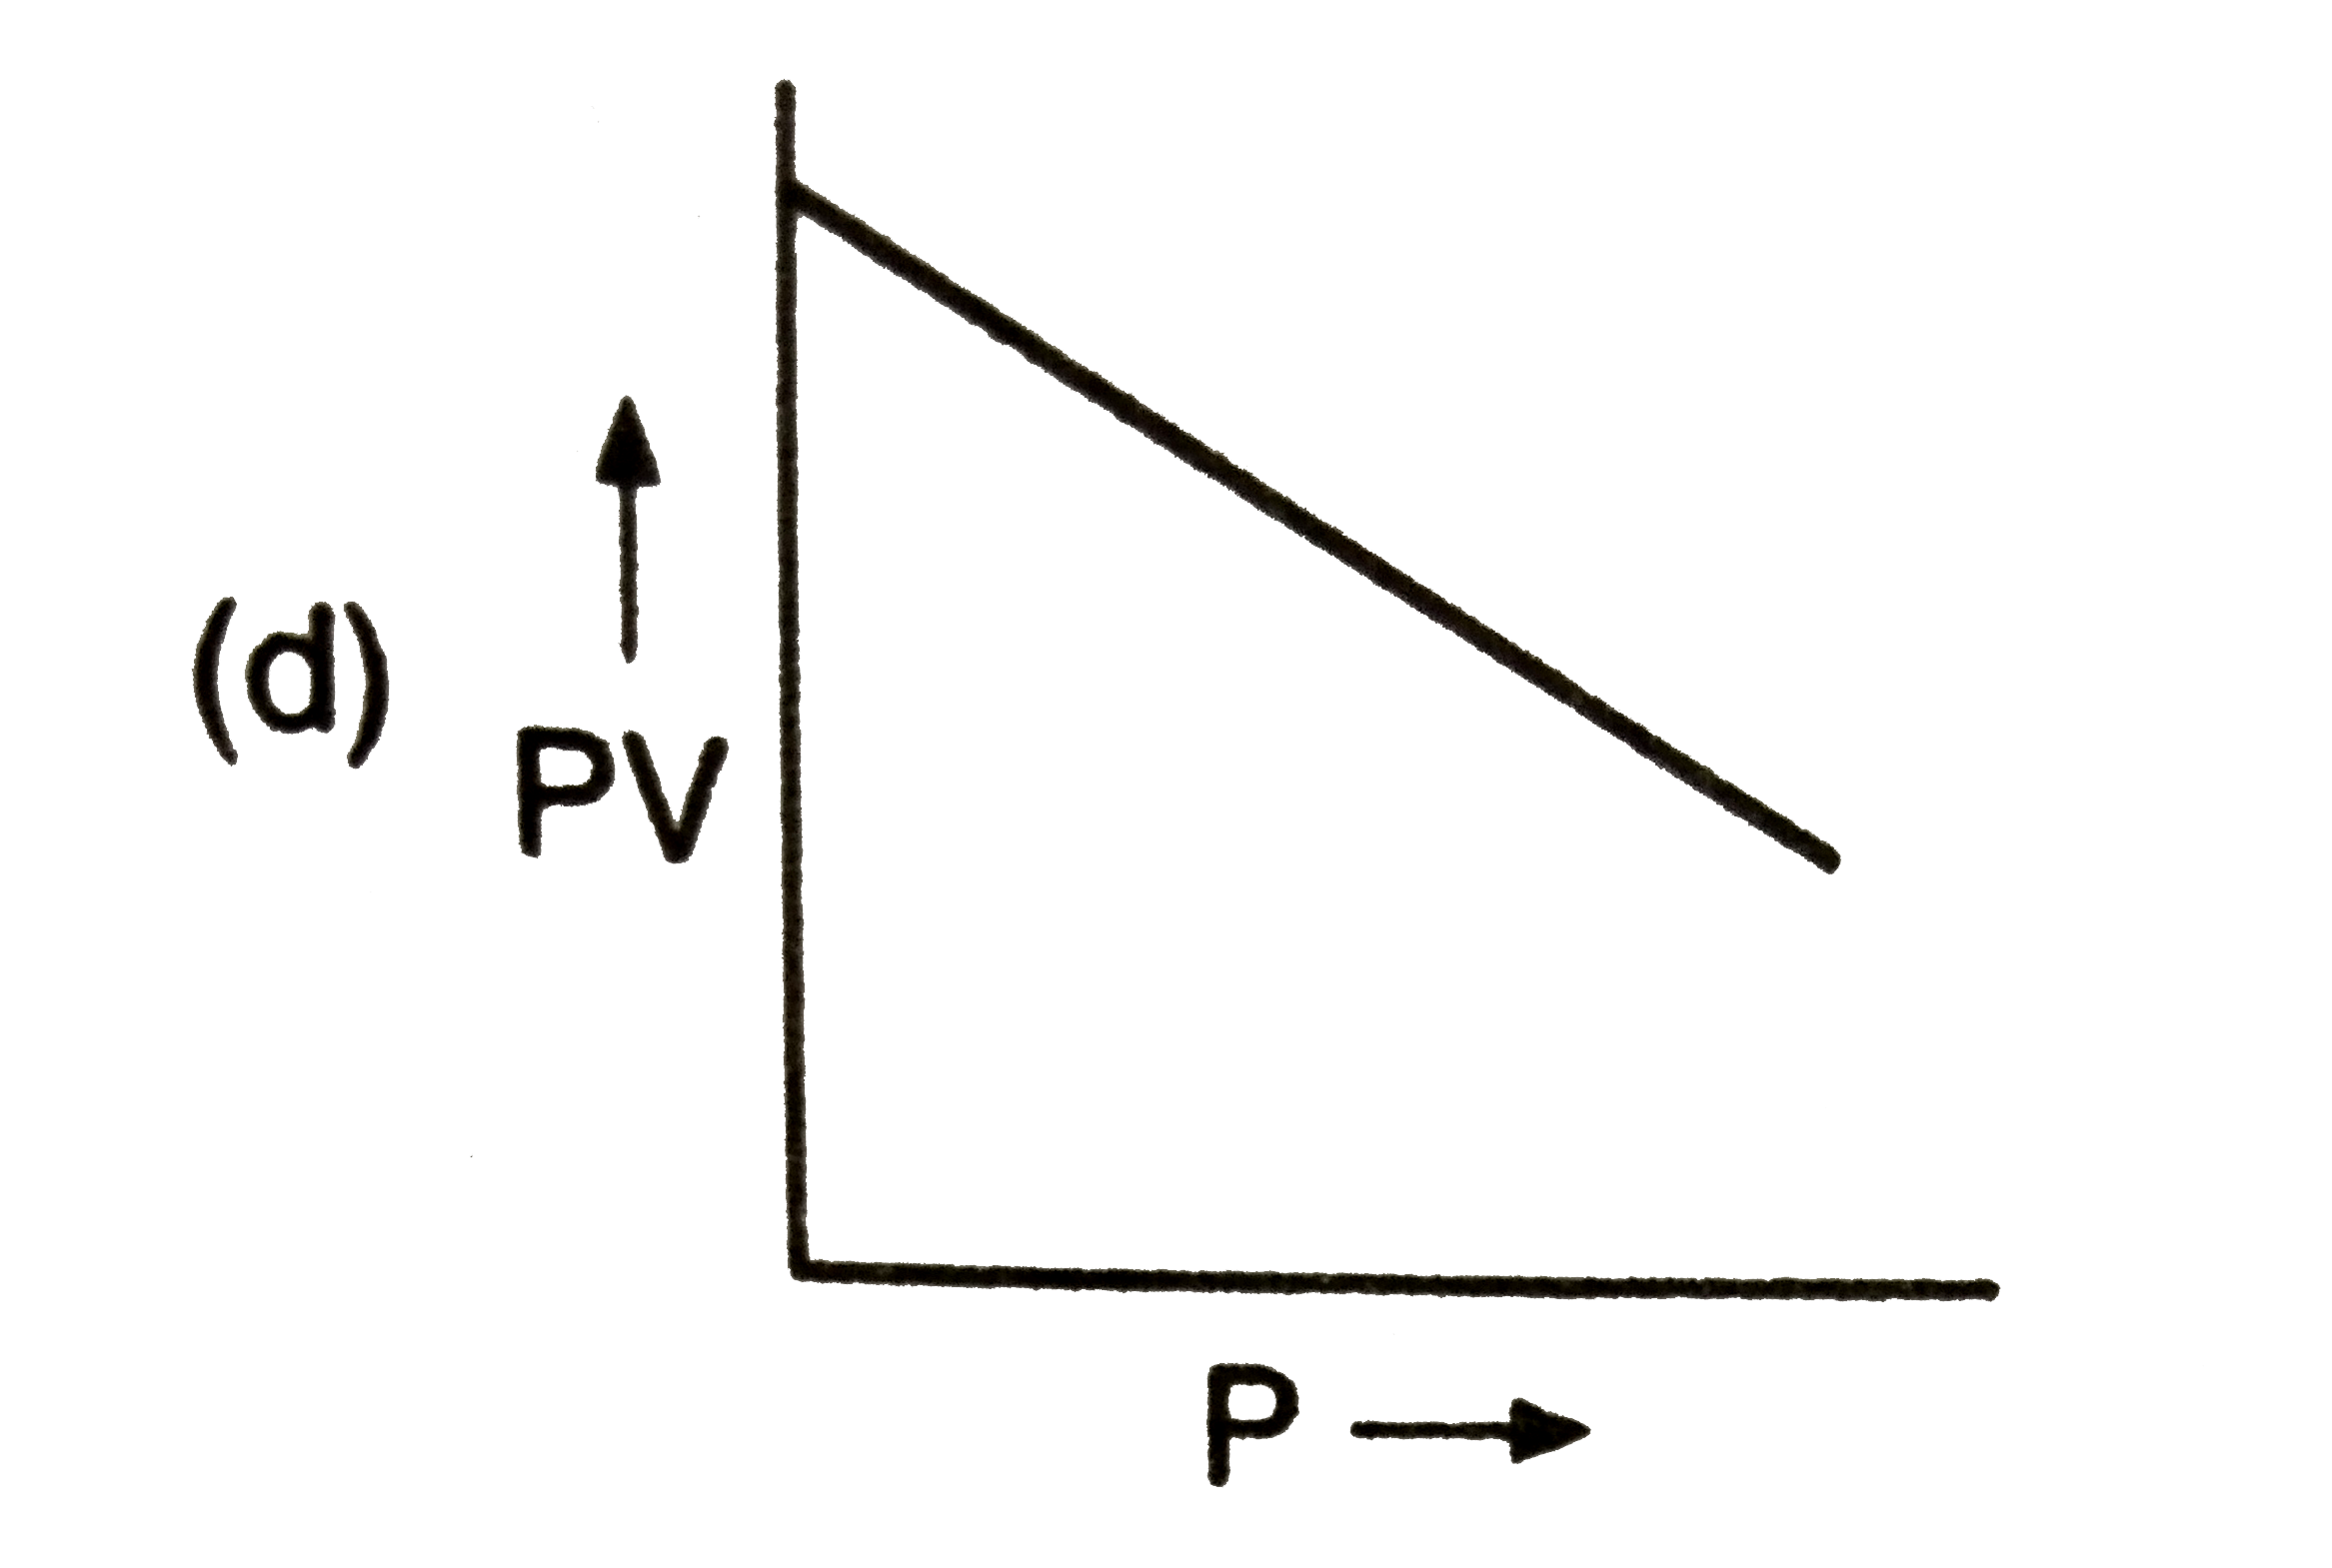
Name the gas law which relates volume and pressure of gas at constant temperature.
View SolutionPressure vs volume graph at constant temperature is known as…………….
View SolutionWhich of the following graph represents Boyle's law ?
View SolutionAccodring to Boyle's law, the product of pressure and volume is a constant. Hence,
View SolutionWhich among the following is the correct mathematical representation of Dalton's law of partial pressures?
View Solution

