Twenty students of Class XI have secured the following marks :

Present the data as a frequency array.
Following table presents these data in the form of a frequency array. The table shows that 3 students secured 11 marks, 4 students secured 14 marks, again 4 students secured 20 marks, and the like. As it is clear from the table, in such series the items are arranged in the ascending (or descending) order. Frequencies are noted in front of each item to signify the number of times that the item occurs in the series. In this table, the marks secured are shown in ascending order. Against these marks are shown their frequencies, that is, the number of students who have secured these marks.
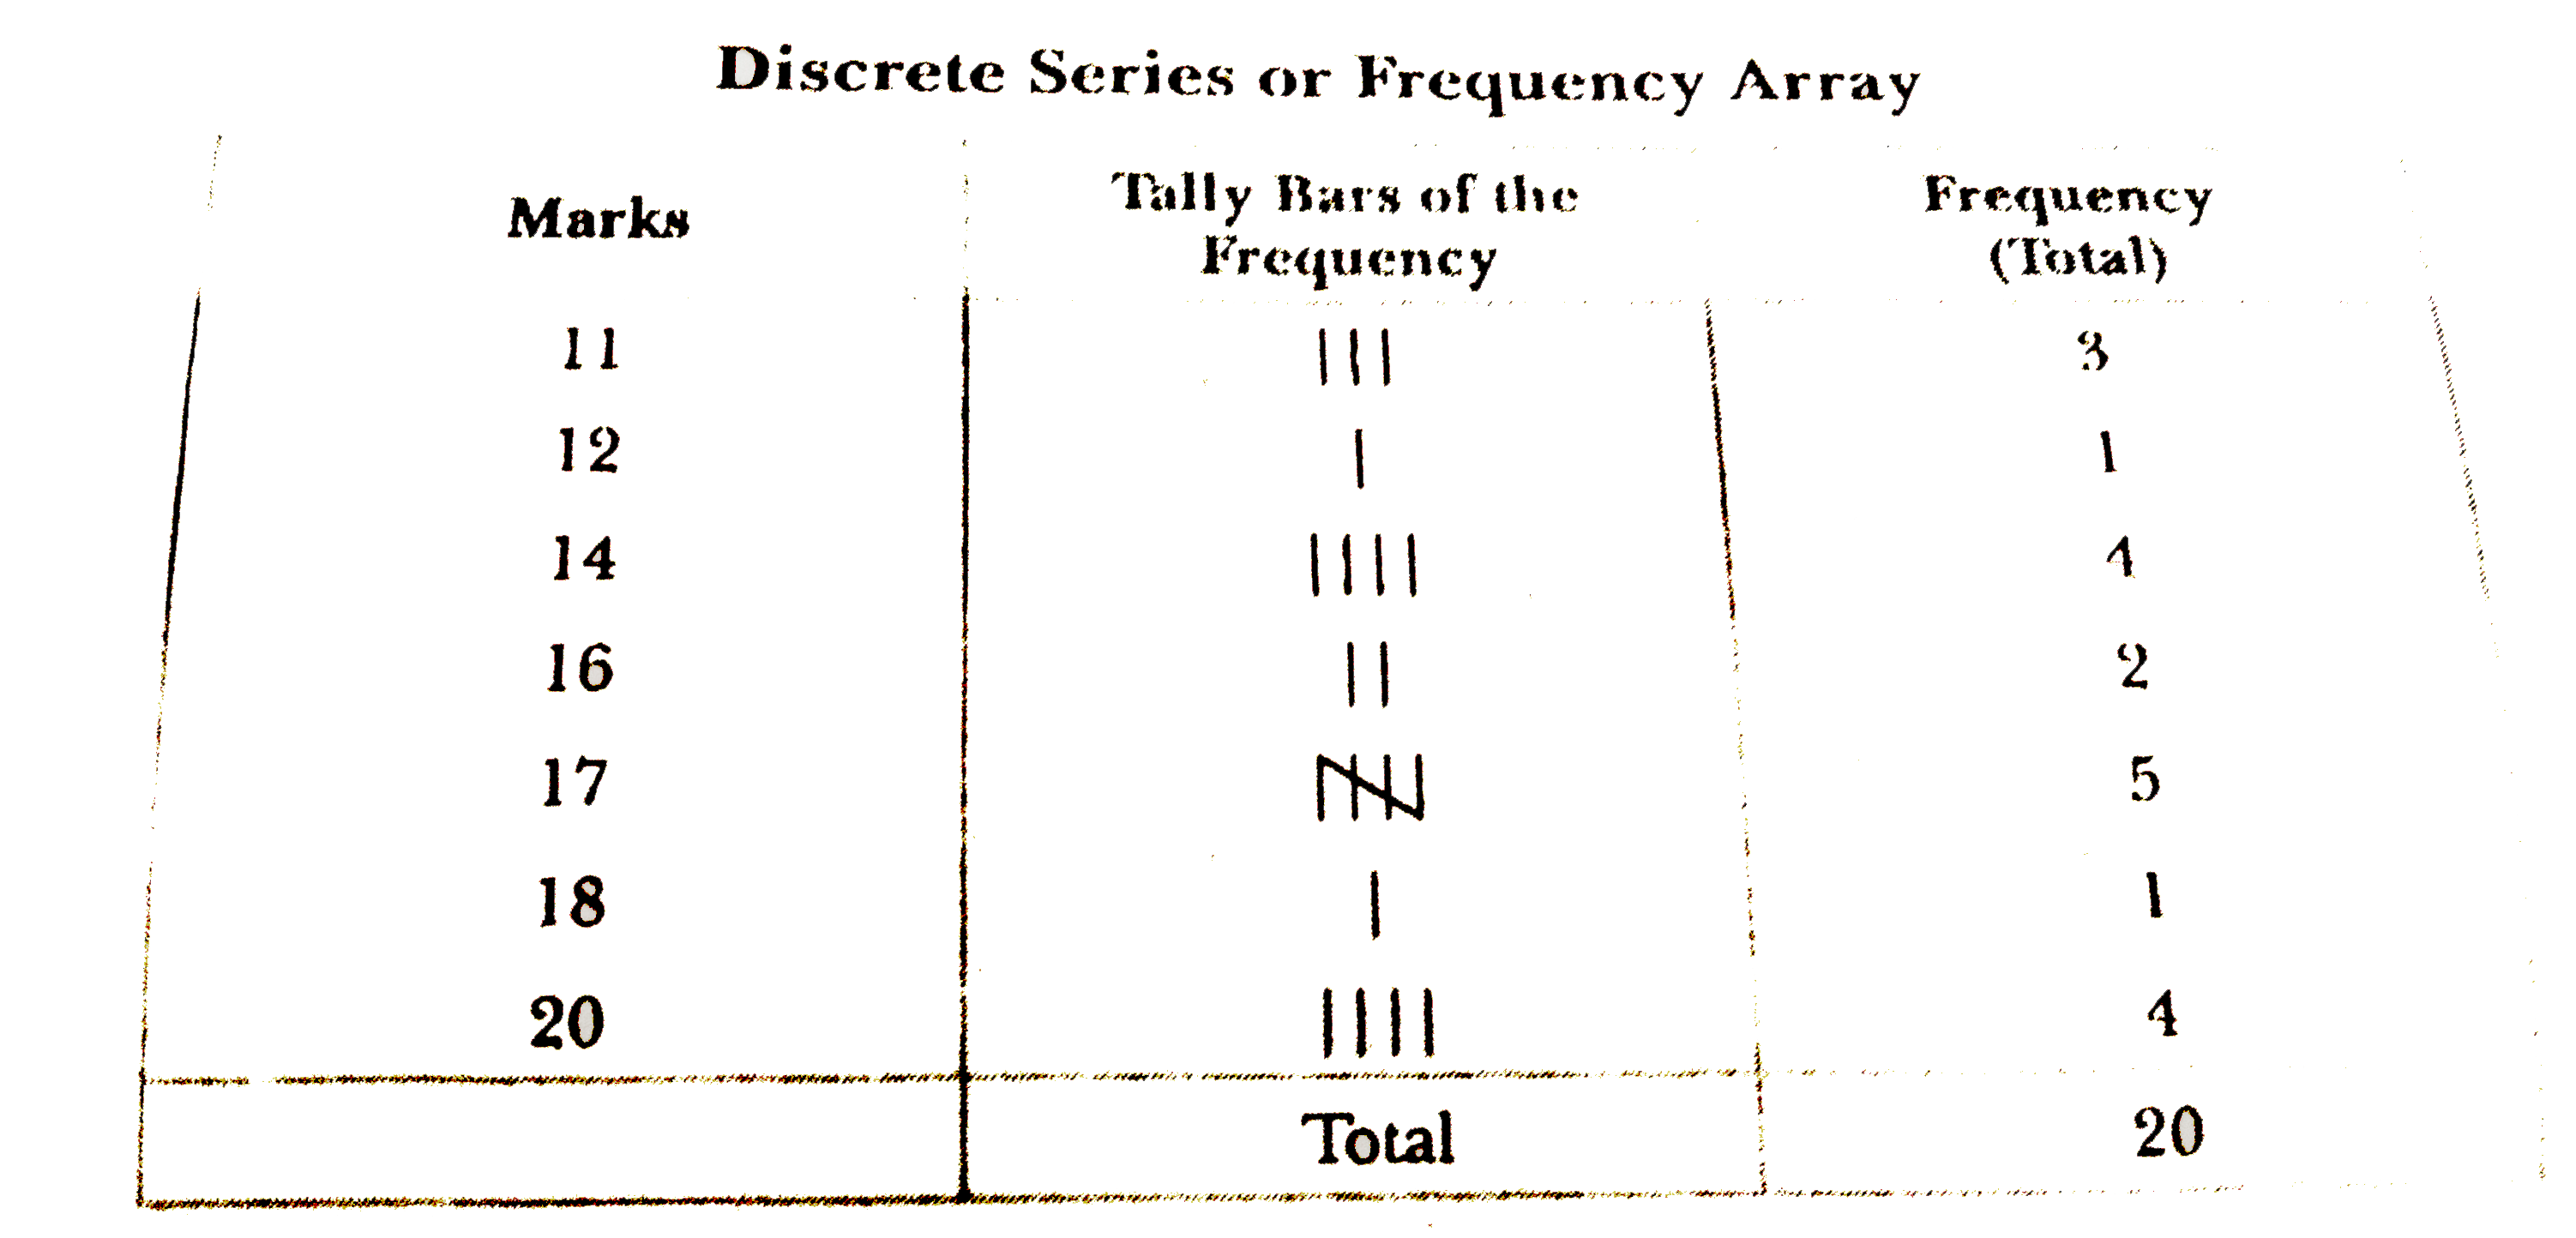
Thus, 3 is the frequency for 11, so 3 is written against it. This means 11 is occurring 3 times in the series, or 3 students have secured 11 marks. Likewise, 5 is written against 17, 5 is the frequency of 17 or 5 students have secured 17 marks.
Discrete series present the data in a very brief form. However, this type of presentation of the data becomes difficult when there is a large mass of data and a large number of small frequencies. In such situations, data are to be distributed in different classes.
Topper's Solved these Questions
- ORGANISATION OF DATABOOK - TARUN JAIN & VK OHRICHAPTER - ORGANISATION OF DATAEXERCISE - Miscellaneous Illustration
13 Videos
- ORGANISATION OF DATABOOK - TARUN JAIN & VK OHRICHAPTER - ORGANISATION OF DATAEXERCISE - EXERCISE M.C.Q
10 Videos
- MEASURES OF DISPERSIONBOOK - TARUN JAIN & VK OHRICHAPTER - MEASURES OF DISPERSIONEXERCISE - Learning by doing
30 Videos
- PRESENTATION OF DATA - TEXTUAL AND TABULAR PRESENTATIONBOOK - TARUN JAIN & VK OHRICHAPTER - PRESENTATION OF DATA - TEXTUAL AND TABULAR PRESENTATIONEXERCISE - ESSENTIAL PRATICALS
8 Videos
Similar Questions
Seven students of a class secured following marks in economics and history . Calculate cofficient of correlation with the help of these data:

View SolutionThe marks of the students of a class who appeared for a test in English are represented in the following frequency table :
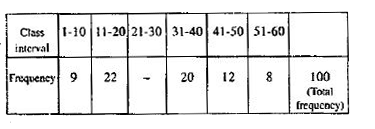
What is/are the modal class(es) ?
View Solution
Knowledge Check
Study the histogram of marks (in Mathematics) distribution of 50 students of class IX and answer the following questions.
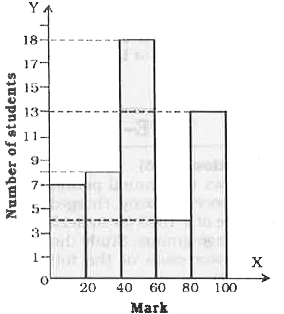
The number of students who have secured marks less than 60 is :A12B15C33D7Study the histogram of marks (in Mathematics) distribution of 50 students of class IX and answer the following questions.
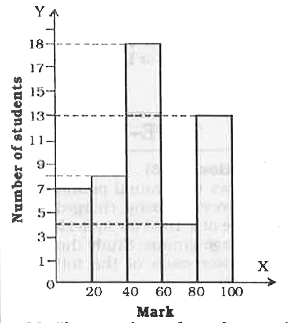
The percentage of students who have secured marks more than 59 is :A13B17C34D26The data below shows the number of students in class A having secured different marks.
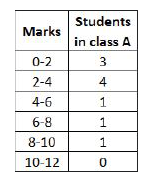
What is the mean marks of class A?A2B3.8C2.8D1.6
There were twenty students in the class.
View SolutionFill in the blank. Having secured the highest marks in the class, __________.
View SolutionA student draws a cumulative frequency curve for the marks obtained by 40 students of a class as shown below. Find the median marks obtained by the students of the class. (FIGURE)
View SolutionStudy the following histogram of marks in mathematics (out of 50) of students in a class and answer the following questions.
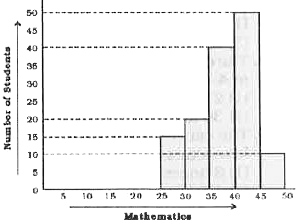
The total number of students in the class is :
View SolutionThe data below shows the number of students in class A and B having secured different marks.
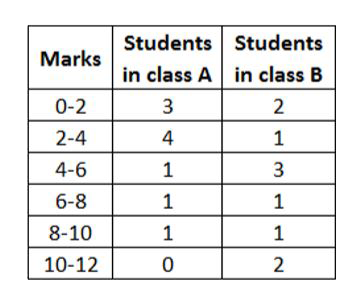
What is the combined mean of A and B?
View Solution
