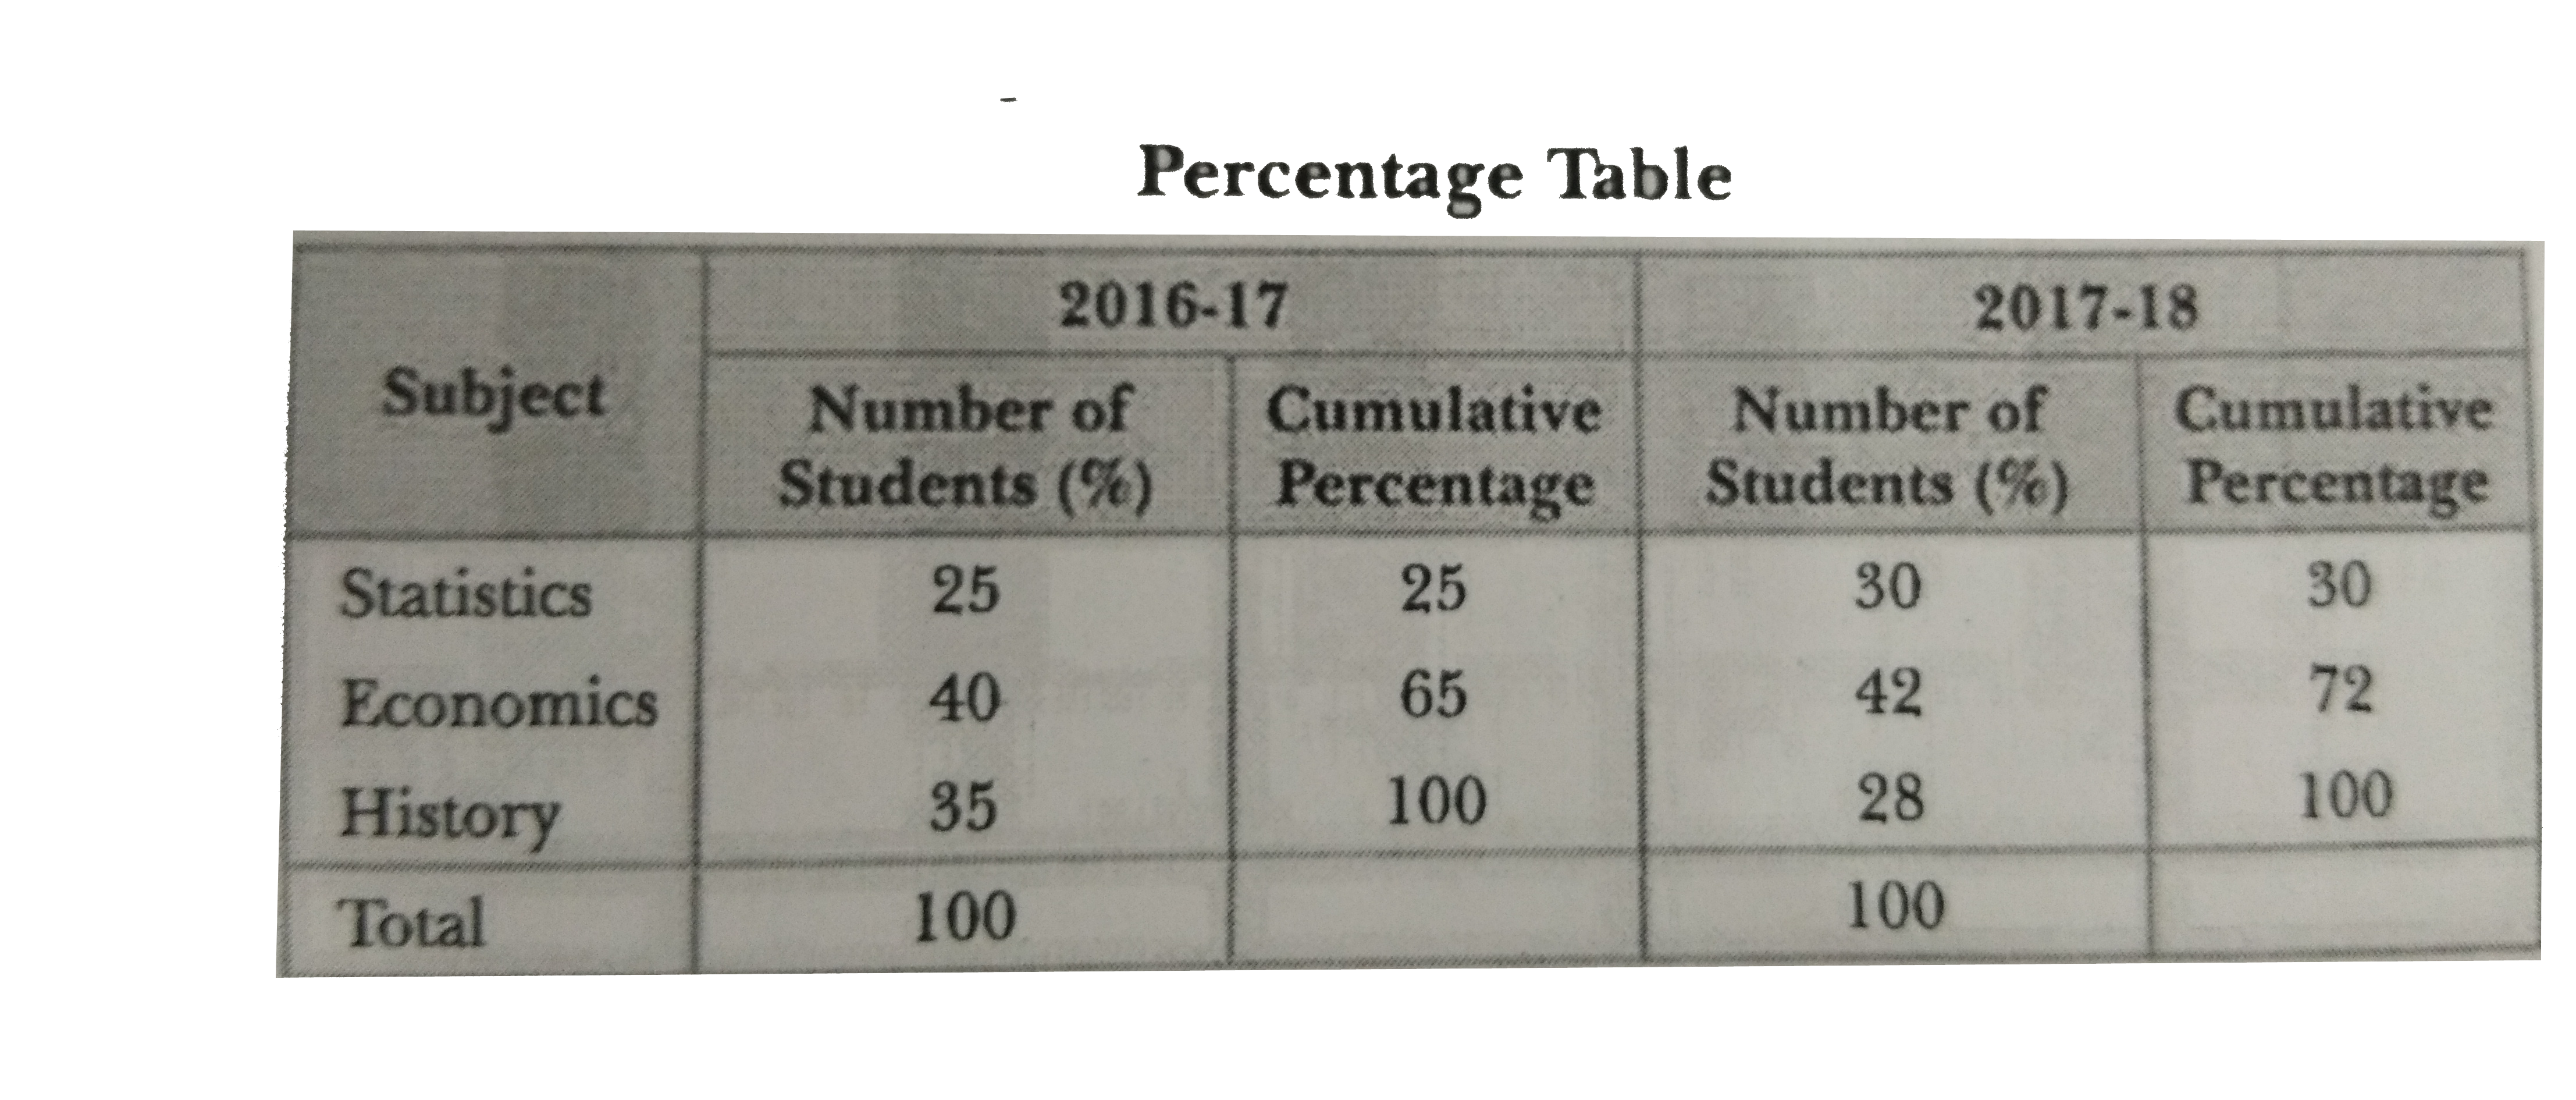
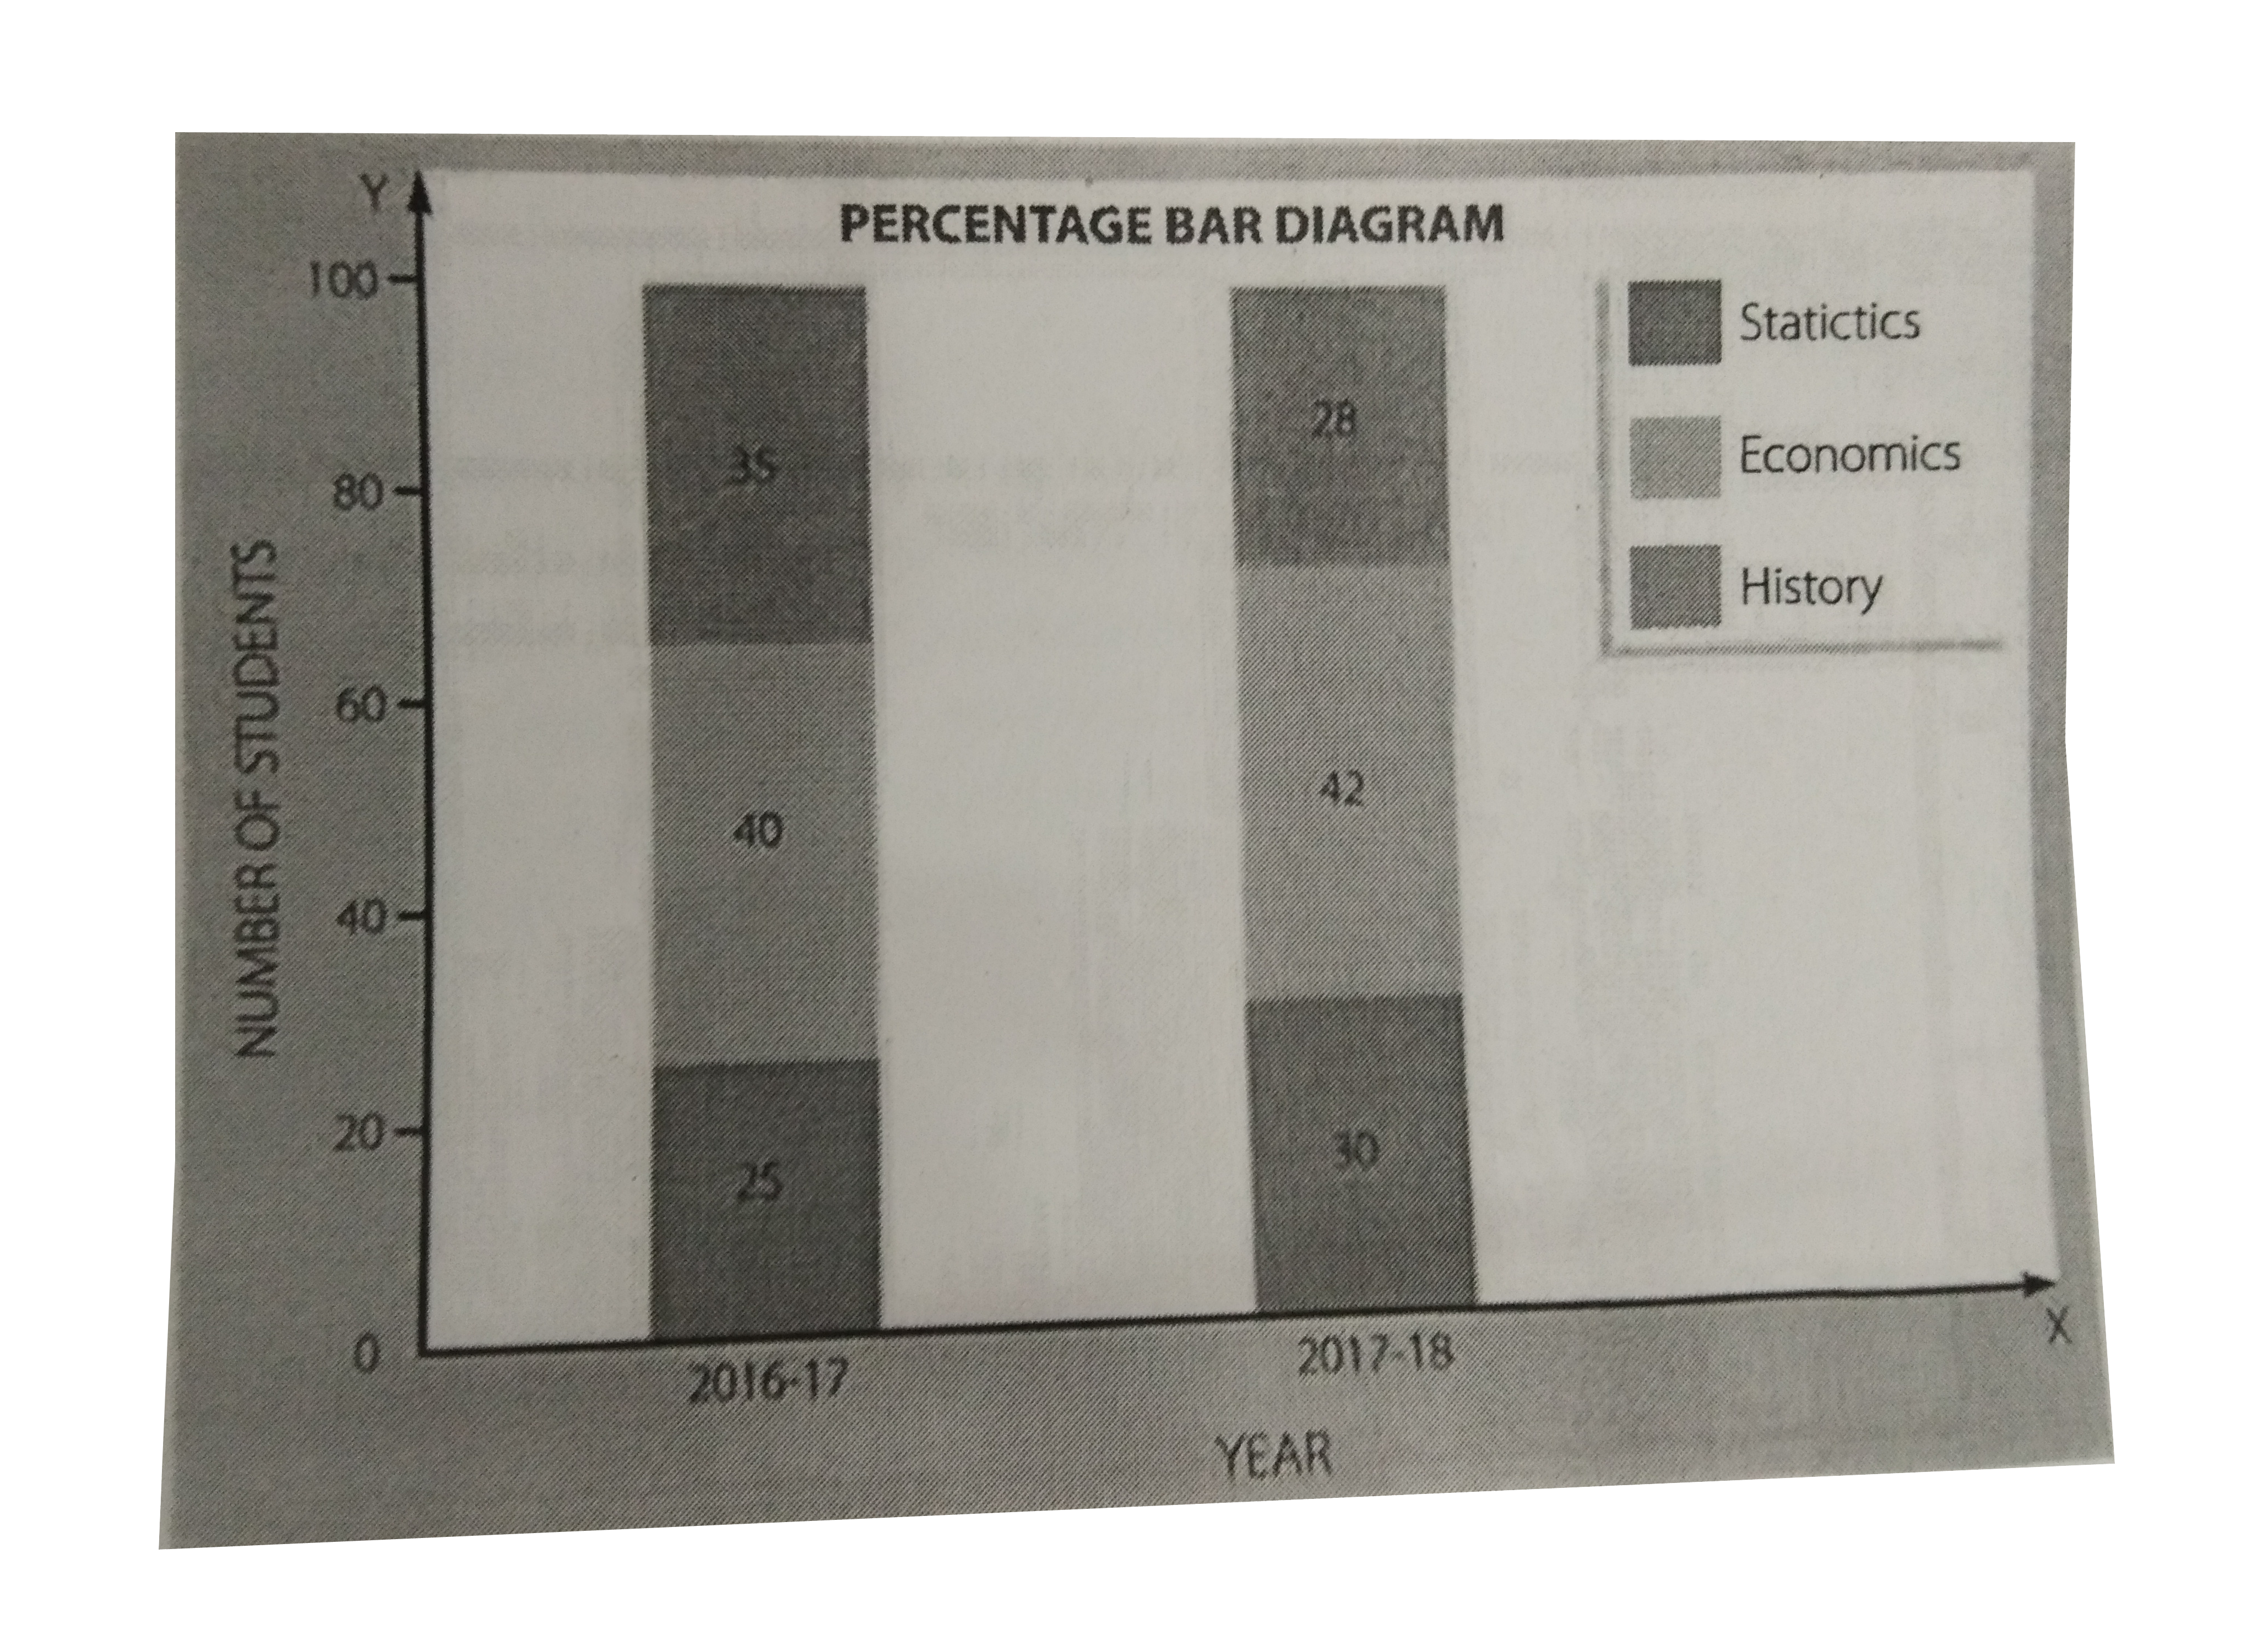
Reprent the following data by a percentage bar diagram :

Firstly we pecparc a percentage table

Now, we draw bars of equal length (100%) corresponding to each year. Then each bar is divided according to percentage of different constituents and should be different .

Similar Questions
Knowledge Check
- Question 1 - Select One
18 Bar diagram is
AsingularBmultipleC(1) and (2) both,DNone of these.
Present the following data by a devidation bar diagram showning the difference between sale proceeds and cost of a firm
 View Solution
Deifine percentage bar diagram.
View SolutionPresent the following data in the form of horizontal bar diagram :
 View Solution
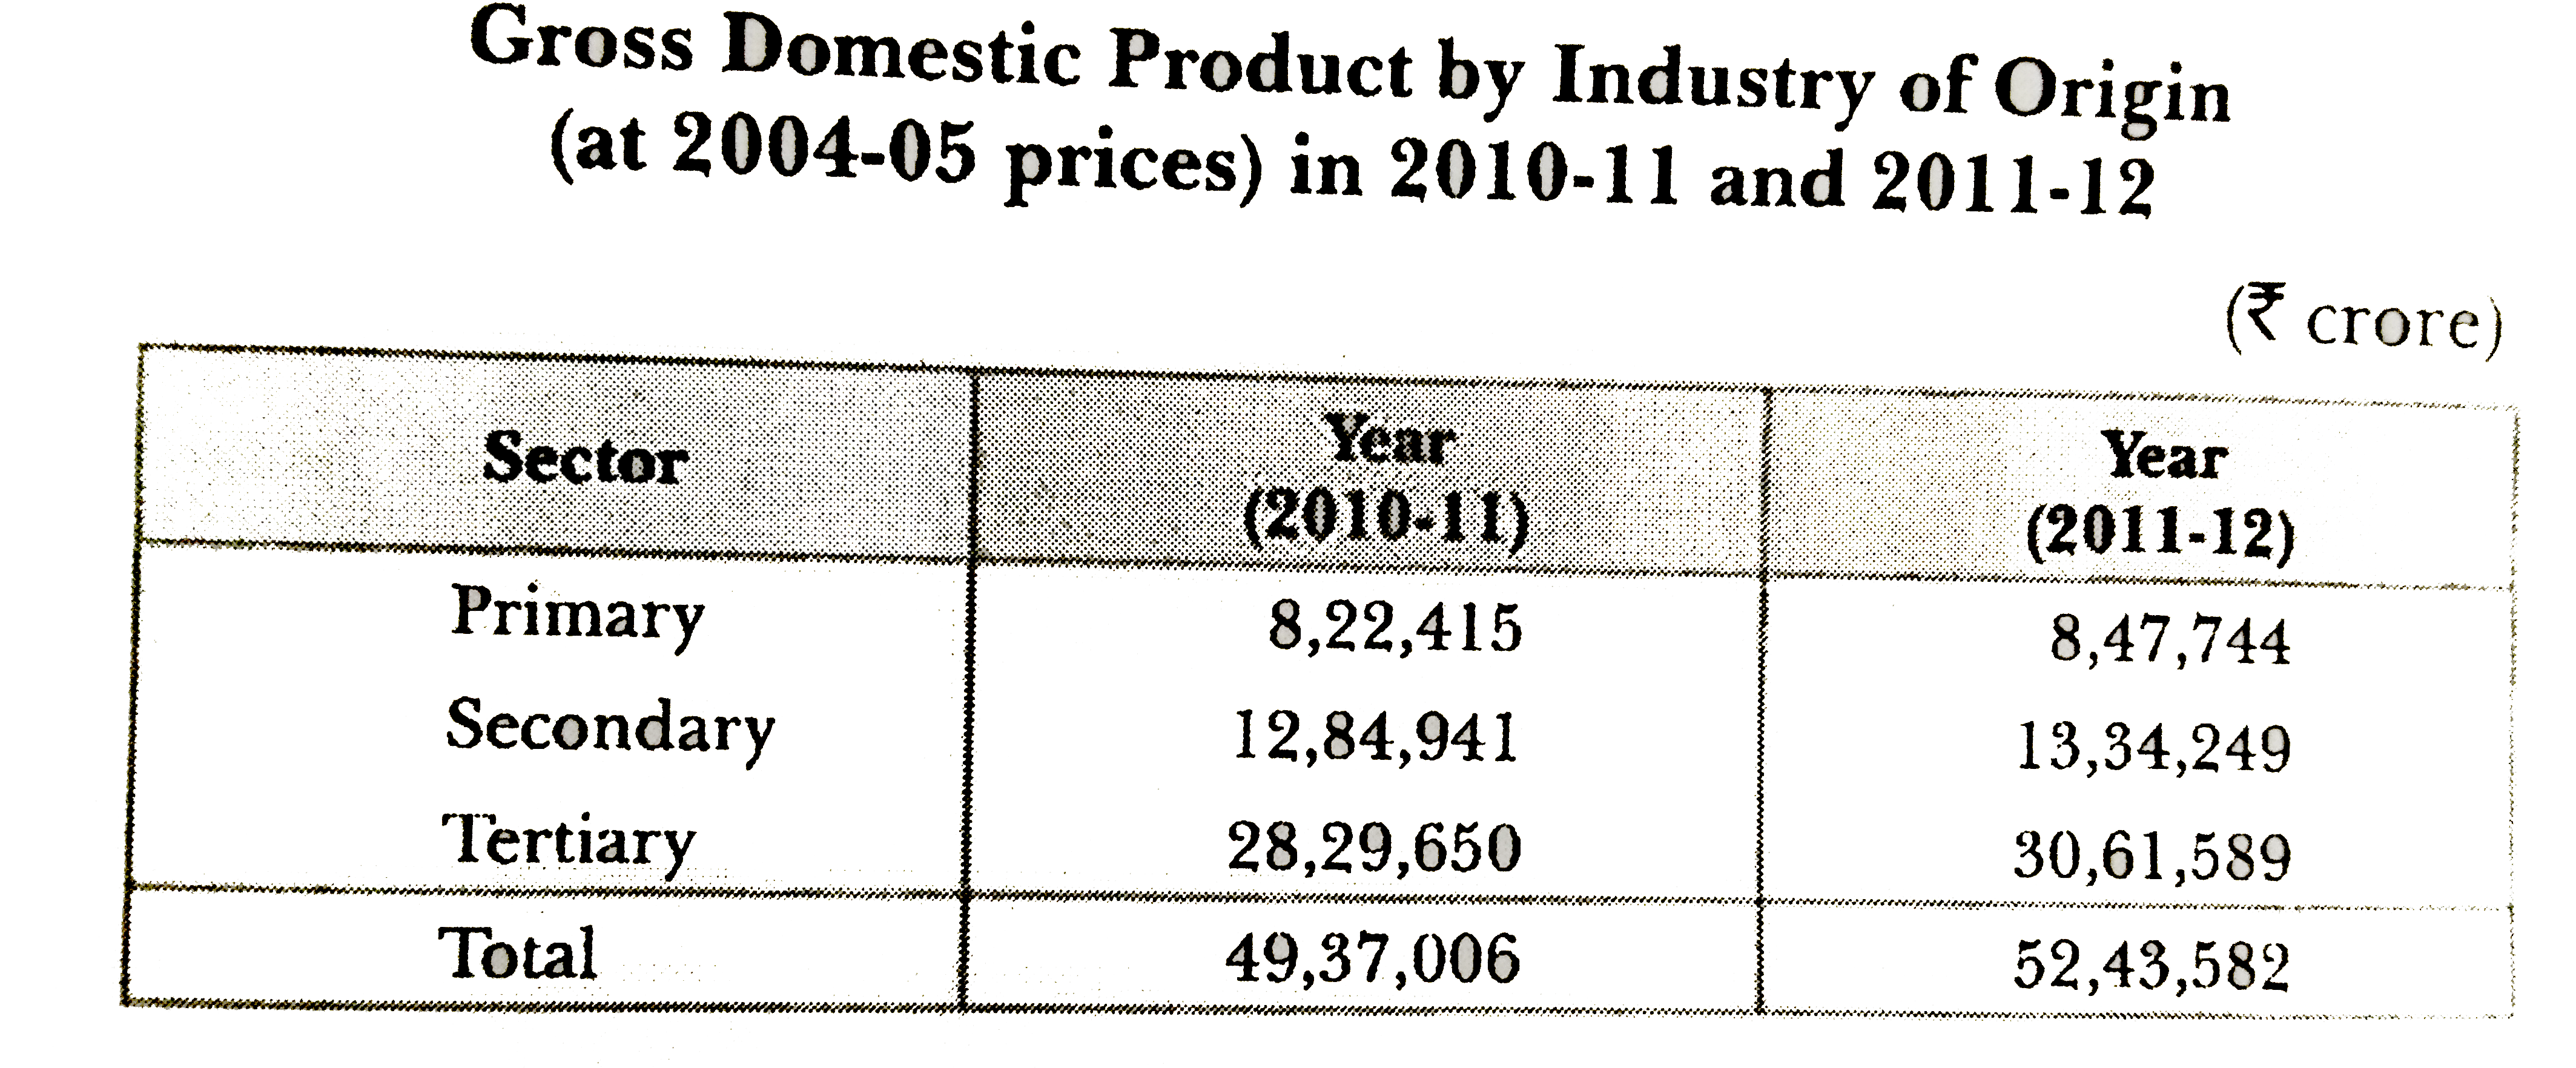
Gross Domestic Product by Industry of origin (at 2004-05 prices) is given for the years 2010-11 and 2011-12. Present this data in terms of percentage bar diagram.
 View Solution
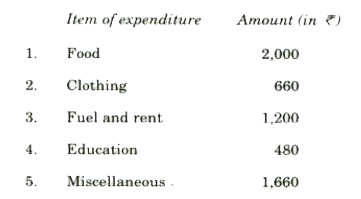
The monthly expenditure of a person is 6,000. The distribution of expenditure on various items is as follows :

If the above data is represented by a percentage bar diagram of height 15 cm, then what are the lengths of the two segments of the bar diagram corresponcling to education and miscellaneous respectively?View SolutionPresent the following data in the form of a multiple bar diagrm:
 View Solution
The following table gives the data on the marks obtained by two students 'A and B' in five subjects :

Represent the data by a multiple bar diagram.View Solution


